
Price Action Trading: Why Textbook Patterns Form Where They Do, and How Often They Fail
Price action trading means making decisions from the candles themselves: where price went, where it stopped and how fast, with few or no indicators. It is a way of reading a chart, not proof of an edge. We know of no independent evidence that it pays, and our own test of one version lost money after costs.
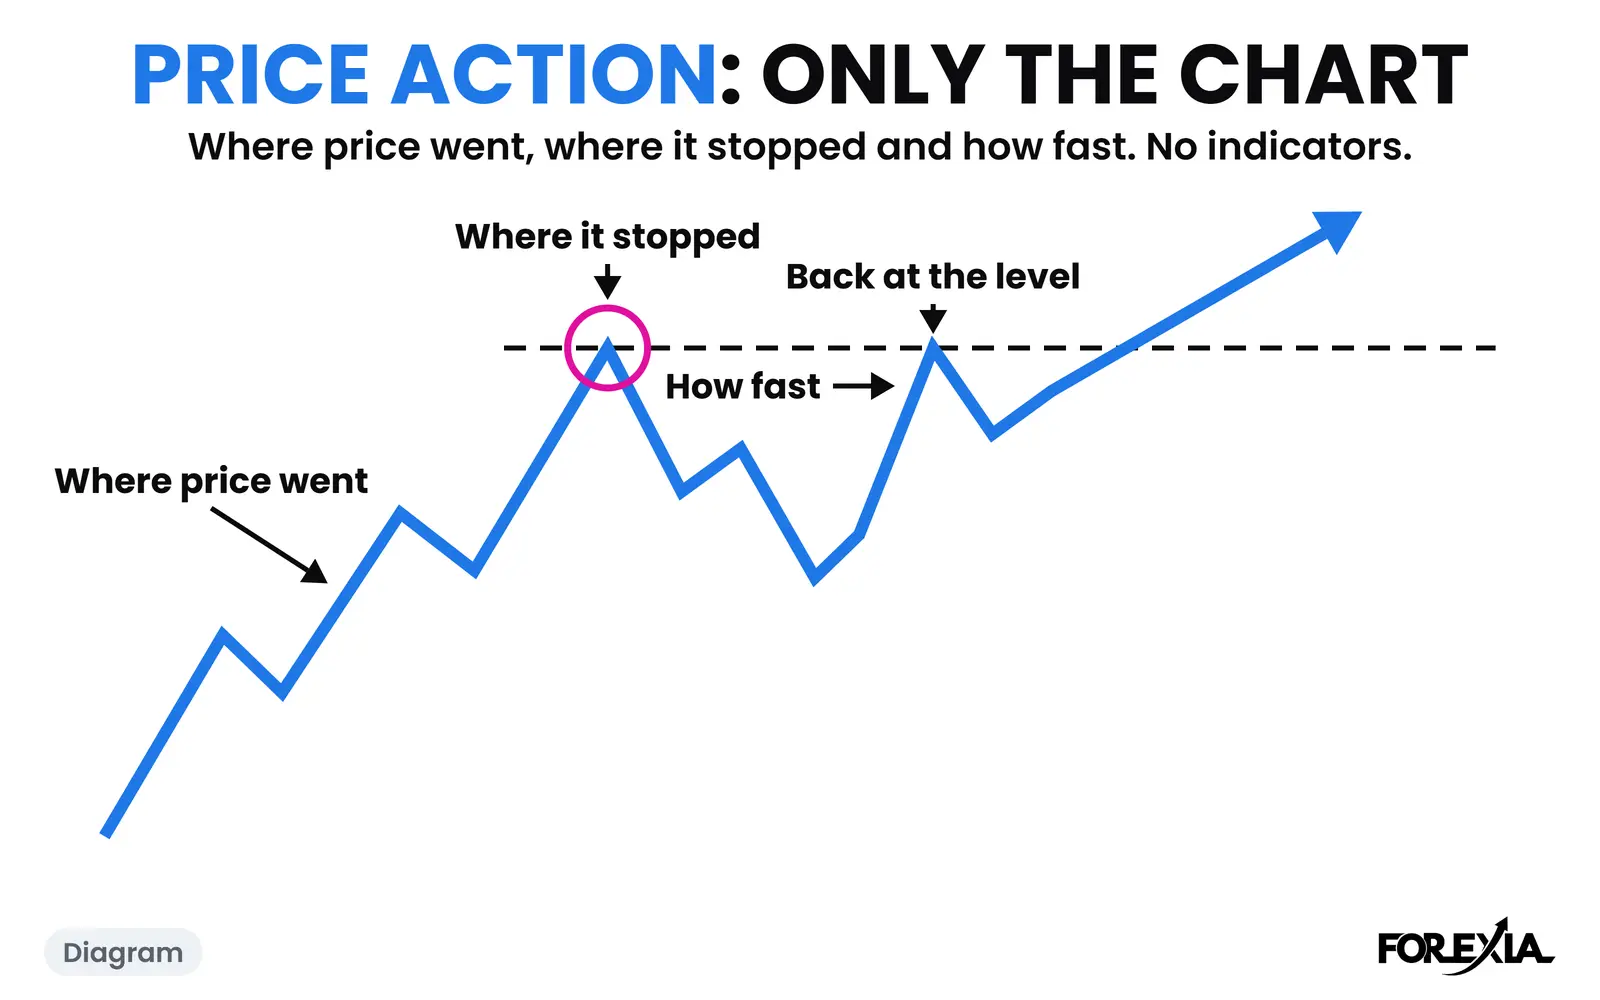
The usual page on this search shows the same diagrams: a double top, a rising wedge, a pin bar. This one counts them. Across 1,030 market-days on seven dollar majors and gold, we counted what 983 double tops and bottoms, 337 wedges and about 2,500 reversal-shaped candles did next. It also reads those patterns backwards, from the stops they leave, on five real dated charts. The counts are of candles, not trades.
What is price action trading? The definition and the honest limits
Price action trading is trading from price itself: the candles, the swing highs and lows they leave, and what happens when price comes back to those levels. It is a branch of technical analysis. Indicators are optional, because nearly all of them are calculations on the same candles.
Traders who use it mostly read five things:
- Trend. Higher highs and higher lows, or the mirror.
- Support and resistance. Levels where price turned before.
- Breakouts and pullbacks. Price leaving a range, then coming back to its edge.
- Candle shapes. Pin bars, hammers, engulfing candles, inside bars.
- Chart patterns. Double tops and bottoms, head and shoulders, wedges, triangles, flags.
A price action trading strategy adds rules for the entry, the stop and the size of the trade. The most quoted are trend pullbacks, breakout pullbacks, pin bars at a level, inside bar breaks and head and shoulders. All of it is used on forex, gold, stocks, crypto and futures, on every timeframe. The appeal is plain: a clean chart, any market, nothing to install.
The limits usually get one line. They deserve more:
- It is subjective. Two traders mark different levels on one chart and both call it price action. Which swing counts is a judgement.
- The reasons are stories. "Buyers stepped in" is told after the candle. A chart shows what happened, never who did it or why. That applies to our reading as well.
- The evidence is thin. We found no reliable published figure for the style as a whole. Most claims come from people teaching it, and we teach it too, so we show the counts.
- The survivors do the talking. Traders who lost stopped posting. The regulators' figures cover every style, not this one: the EU's markets regulator reported in 2018 that 74-89% of retail accounts typically lose money on CFDs.
- Spot forex has no central tape. "Confirm it with volume" is common advice, but the volume on a retail forex chart is a broker's count of price changes, not the market's.
The best evidence on the other side is about levels. A New York Fed study tested support and resistance levels that six firms gave their customers, and found strong evidence that they help predict where intraday trends pause, with power that varied by currency and firm. It was published in 2000, on levels from 1996 to 1998, and it asks whether trends paused there, not whether trading those levels paid.
The textbook read versus reverse price action
The textbook asks what a pattern predicts. Reverse price action asks why the pattern is there. Reverse Price Action is reading a pattern backwards: why it was built here and now, how textbook traders will react, where their stops sit, and how larger players use that pool. Then reading the opposite of the textbook story.
The reason to read it that way is simple. Every reader of the same book gets the same instruction, and that leaves a pile of orders in a known place. A stop-loss is an order to trade at the market once a price prints. So a pattern tells you where the crowd will stand before the crowd gets there:
| Pattern | What the textbook says | Where that puts the crowd's stops |
|---|---|---|
| Double top | Sell the neckline break | Above the peaks |
| Range breakout | Buy the new high | Under the range or the pullback |
| Rising wedge | Sell the lower line | Above the wedge's high |
| Pin bar at a low | Buy the close | Under the wick |
| Moving average cross | Buy the cross | Under the last swing low |
Those are the books' instructions, not our rules. Part of this idea can be shown. A New York Fed staff report used a major dealing bank's order book to find stop-loss sell orders clustered just below round numbers and buy orders just above them, and rates moved unusually fast after reaching those levels, over hours and not days. The orders date from 1999 and 2000, and the report says its statistics cannot prove the orders caused the move. Who uses that pool, and why, is our read and no more.
We read it from the three seats. Retail sees a pattern and takes the trade the book gives. The market maker sees where the orders are, and our read is that market makers build the chart. The observer reads both from outside and names nothing until the candles have closed.
Gold on Wednesday 16 September 2026 shows both reads on one candle. Times on this page are New York, a candle is named by the minute it opens, and on gold $1 counts as 1 pip. Asia left a 66-pip range, 4275.15 to 4340.72. London crossed its high at 06:00, and New York carried the break 21 pips past it, to 4361.34 at 11:45, the breakout the crowd buys. Price pulled back to 4341.39 by 13:00, and the Fed's decision was due at 14:00.
From the first seat that is a breakout, a pullback and a new push. Then the 13:45 candle crossed the first high, and the 14:00 candle ran to 4366.52, 5 pips past it, and closed at 4309.99. Now the book calls it a double top, 25 pips tall. But the one candle that confirmed it closed 31 pips under the neckline, already past the book's whole target. The diagram's sell at the neckline was never there.
Read backwards, the breakout left stops above 4361.34 and under 4341.39. The second leg took the first set and the fall took the second. We read that as the stop hunt, a liquidity sweep of the stops over the first high. By 15:00 price was 132 pips lower, at 4234.66, through the whole Asian range.
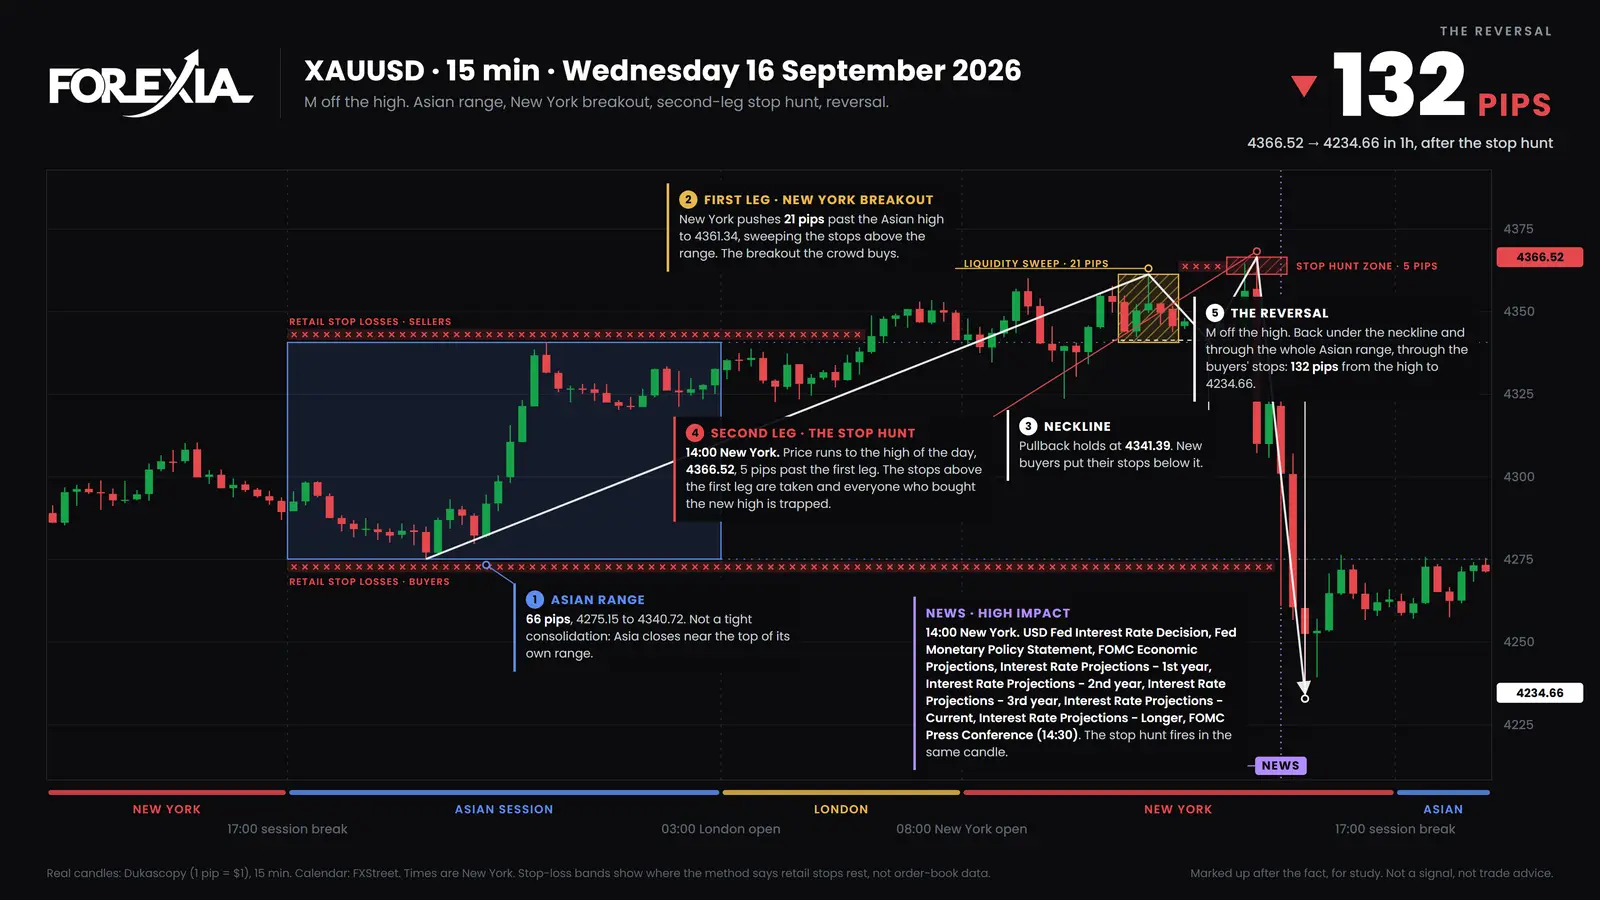
We picked this day because it reversed, and that is the catch in every chart like it. A reversal seen afterwards is not a setup. The rest of this page shows how many shapes do not end this way. To go further, how to spot reverse price action walks through another gold day, and the false breakout in forex reads the pattern behind a break that failed.
Double tops and bottoms: how often they fail, and the third tap
Double tops and double bottoms fail often, and most never give the textbook's signal at all. A double top is two highs at about the same price with a dip between them, and the low of that dip is the neckline. The book says sell on a close under the neckline, put the stop above the peaks and aim for the pattern's height below the neckline. A double bottom is the mirror.
We counted them on Dukascopy's 15-minute candles from Monday 6 April to Thursday 1 October 2026: 1,030 market-days across seven dollar majors and gold. Our rule was two peaks 2 to 12 hours apart in one trading day, within 10% of the average daily range of each other, nothing higher between them, and a dip of at least a quarter of that range. Outcomes were followed for up to one more day; the one shape whose day ran out at the end of 1 October is left out.
| What the 983 shapes did | Count |
|---|---|
| Never closed through the neckline that day, or went past the peak first | 680 |
| Closed through the neckline | 303 |
| Of those 303, traded back past the peak before reaching the book's target | 104 |
Three things stand out:
- Most shapes go nowhere. Nearly seven in ten never gave the signal. A chart full of double tops is mostly patterns nobody hears about again.
- One in three that did, failed first. That is 104 of 303, and it is the failure the diagrams leave out.
- A second peak past the first did not sort them. Where the second peak traded past the first, 49 of 147 failed. Where it stopped short, 55 of 156 failed. That gap is too small to read anything into.
These are counts of shapes, not trades, with no spread, cost or slippage. It is 25 weeks and four days and a rule we wrote.
EUR/USD on Wednesday 8 July 2026 is one of the 104. It printed peaks at 1.14147 at 06:30 and 1.14137 at 09:45, with a dip to 1.13930 between them at 07:30: a 22-pip double top. The 11:30 candle went to 1.13910 and closed at 1.13928, under the neckline. That is the book's sell. Price had already traded under the Asian low of 1.13983 at 05:00 and 07:30, so this candle went further past a level already taken. We read it as a hunt of the stops under the dip, not the start of a fall: price never went lower that day. The 13:00 candle traded to 1.14237, back past both peaks, within ninety minutes of that close.
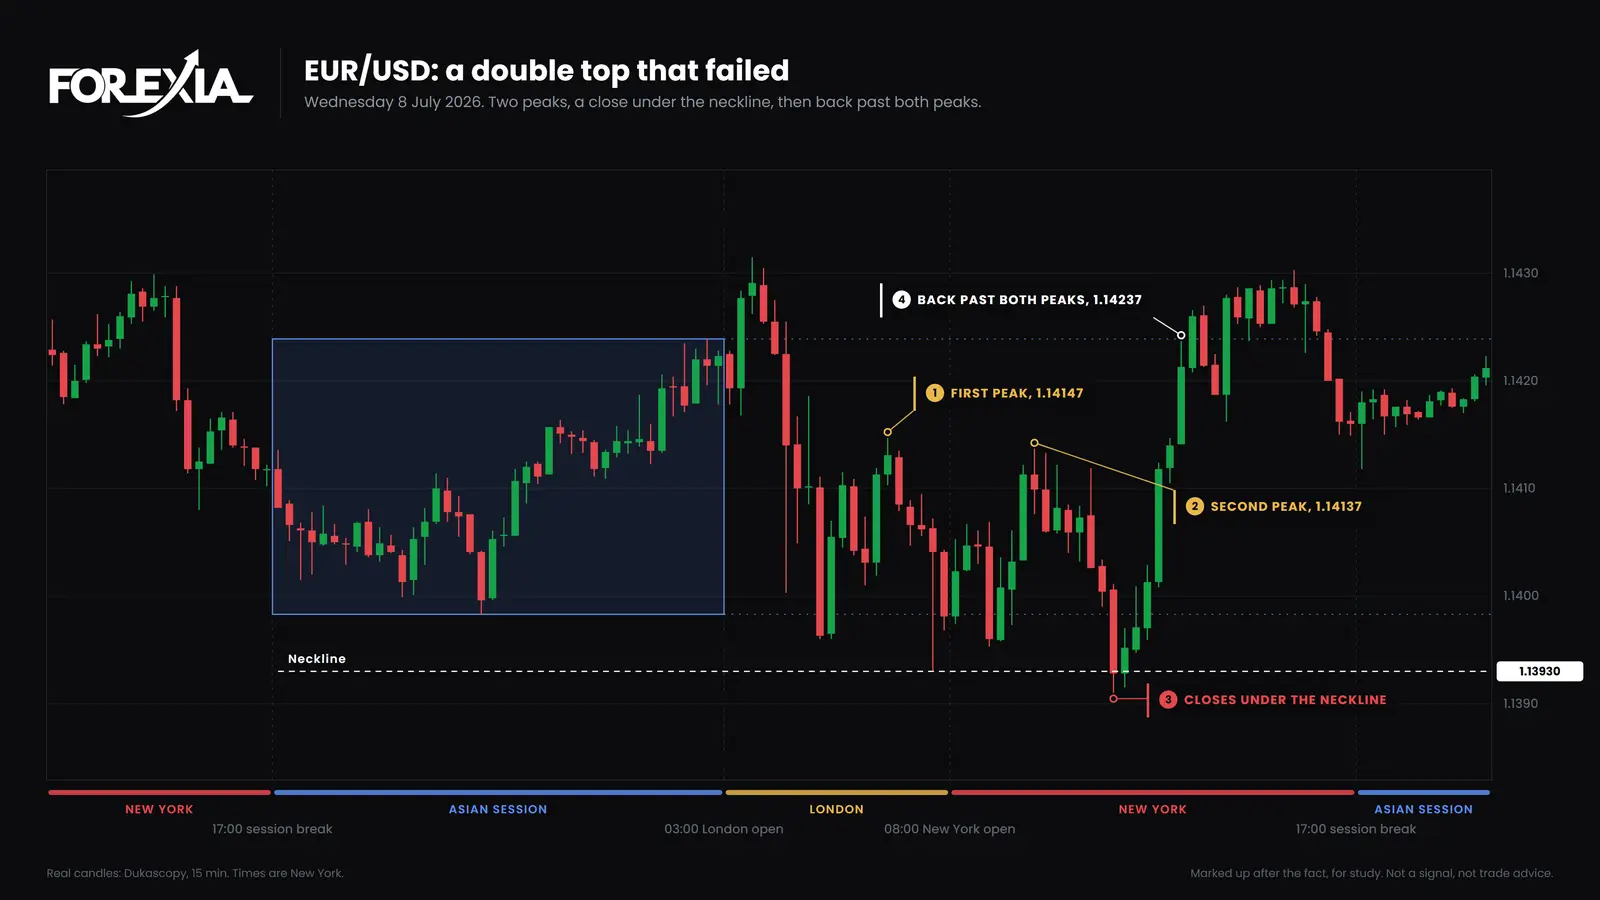
We go through this reading in why double tops and double bottoms fail and whether a double top is a stop hunt of its first high. The USD/CAD double top of 1 October 2026 is a single day taken from start to finish.
The same logic covers a level touched three times. The Third Tap is the perfect third touch of a level, where the trap is set. If the market hands you such a clean entry, ask why. Each touch makes the level look safer and adds to the stops behind it. That is our reading, and we have no count for it.
The rising wedge: which way it breaks and why the order matters
A rising wedge usually breaks down, but mostly because of its geometry. It is two rising lines that converge, with the lower line steeper. A market that simply goes sideways falls out of the bottom without falling at all, because the line rises to meet it. A falling wedge is the mirror. Pages on this search disagree on whether the pattern is a reversal or a continuation, and they show it with diagrams.
We used the same candles and dates, and one falling wedge whose break came too near the end of 1 October to follow is left out. Our rule was three rising highs and three rising lows that overlap in time, the lower line steeper, the closes inside the lines, and a width of at least 15% of the average daily range. The break is the first close outside a line.
| Shapes | Broke down | Broke up | No break | |
|---|---|---|---|---|
| Rising wedge | 184 | 140 | 39 | 5 |
| Falling wedge | 153 | 22 | 128 | 3 |
So the book has the direction right on our sample. One published figure, Thomas Bulkowski's from more than 1,400 trades in bull markets, has 60% breaking down and ranks that downward break last of the 36 patterns he measures. It is a different study with different rules, so neither figure is a law.
The order of events is what the diagram hides. A book draws the line break and the fall as one thing, but a line break comes first and a fall may never follow:
- The fall was rarely there. Of the 140 breaks down, only 16 had closed under the wedge's last low when the line broke. In the other 124, the line had mainly caught up with price.
- Many went straight back. Of the 140, 94 traded back past the wedge's high before travelling the wedge's starting width. Falling wedges were much the same: 88 of 128.
That race is tilted. By the time a wedge breaks, its far side is close and its starting width is a long way off. It is a description, not a result. What it does say is that a close under the line is not, on its own, a market falling.
Gold on Tuesday 14 April 2026 shows it. Highs at 4789.82, 4817.60 and 4843.02 and lows at 4761.90, 4790.99 and 4830.61 made the wedge. The 16:00 candle closed at 4842.45, under the steeper line and still 12 pips above the last low. Price had barely moved. Anyone selling that break had a stop over the high, and the next session took it, running to 4871.16 by 21:15, just past the end of this chart. Gold fell to 4785.89 the next morning, too late for a stop already taken.
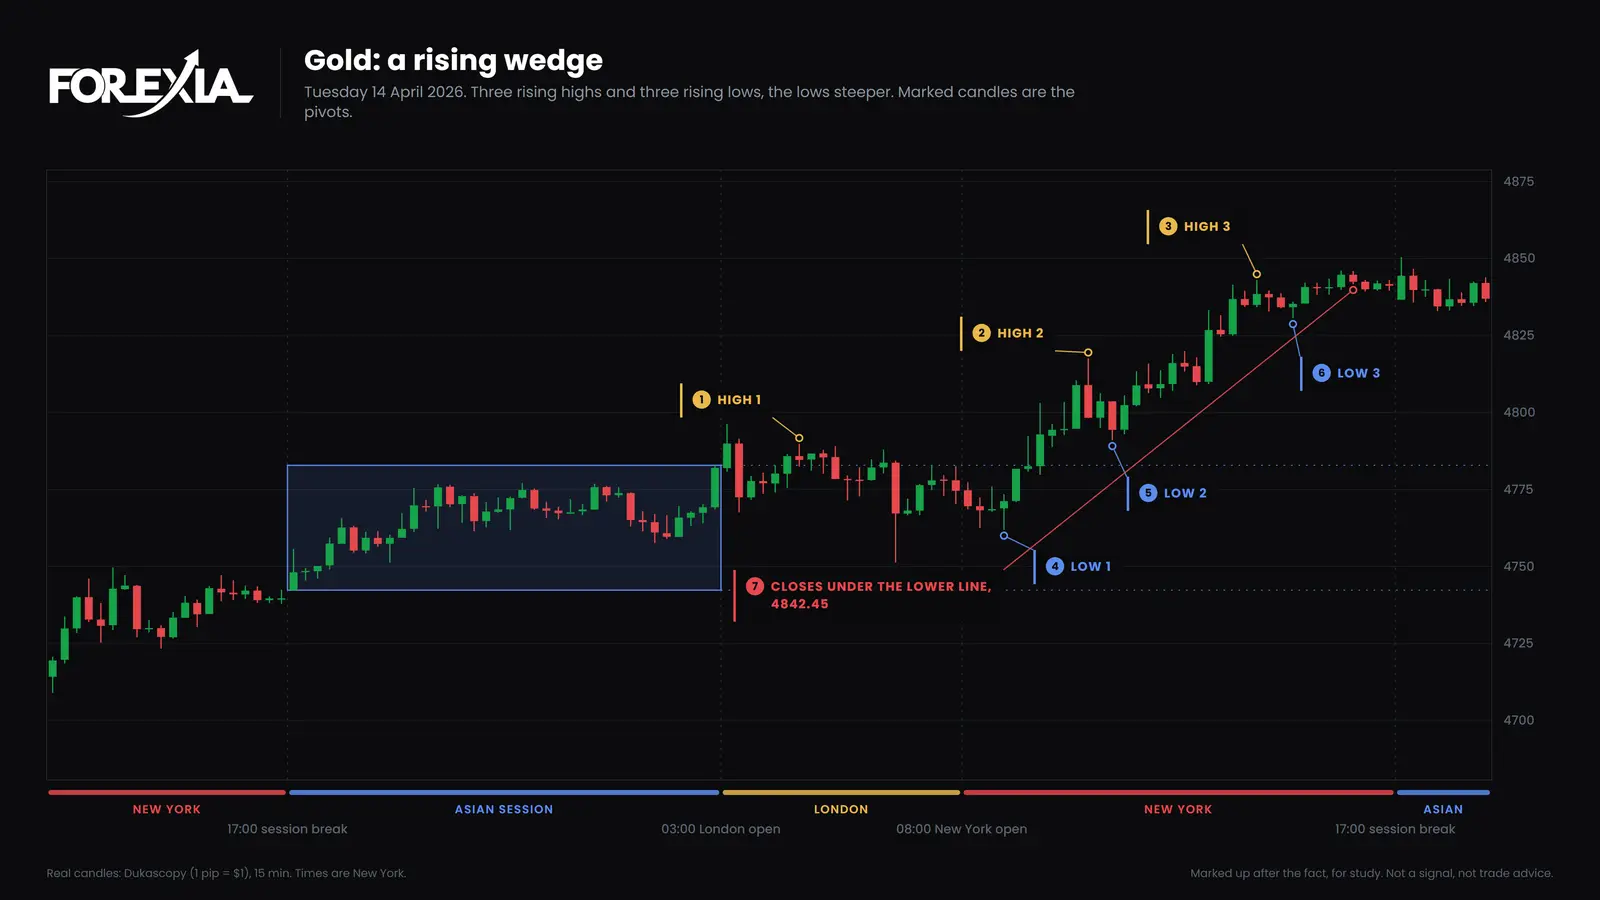
The spokes take this further: which way a rising wedge breaks has the fuller count, and rising wedge vs falling wedge separates the wedge from the ascending triangle.
The reversal candle versus pin bar and engulfing
Pin bars and engulfing candles are defined by shape, and The Reversal Candle is defined by place. A pin bar has a long wick and a small body at the far end, and hammers and shooting stars are the same idea. An engulfing candle has a body that covers the body before it. The Reversal Candle is one huge candle through the stops, straight after the crowd gets in. Gold's 14:00 candle above is one: 59 pips from top to bottom, through the first high and the neckline.
We tested the shapes against a yardstick, which the pattern lists never do. The yardstick is every 15-minute candle from the London open on that made a new low or high against the 12 candles before it, read as if it marked a turn. A pin bar here is one of those candles with a wick of at least two thirds of its range, and at least the median size of the 20 candles before it. The question is whether the close an hour later stood further that way. These are shares of candles, with no entry, stop or cost, so read each row against the yardstick and not as a result.
| Candle | How many | Close further that way an hour later | Median move after an hour, share of the daily range |
|---|---|---|---|
| Any new 12-candle low or high (the yardstick) | 15,978 | 51.8% | +0.5% |
| Pin bar at a new low or high | 771 | 51.5% | +0.5% |
| Engulfing candle at a new low or high | 1,721 | 50.0% | 0.0% |
| First candle past a level, closed back inside it | 392 | 47.2% | -1.0% |
Neither shape beat the yardstick, and the yardstick is close to a coin. Nor did place alone rescue it: a candle that took an edge of the Asian box or the previous day's high or low and closed back inside in that same candle did slightly worse. That last row is not a count of The Reversal Candle, which also has to be huge and to come straight after the crowd, and we have no count that captures those. It does fit the stop hunt page, where the hunt alone showed no lean.
USD/JPY on Thursday 3 September 2026 shows what a shape is worth in a falling market. Pin bars formed at 05:45, with a low of 156.196, at 06:00, with a low of 156.173, and at 07:15, with a low of 155.839, each at a new low. Each one was traded through. The low of the day was 155.299 at 12:45, 80 pips under the third pin bar's close.
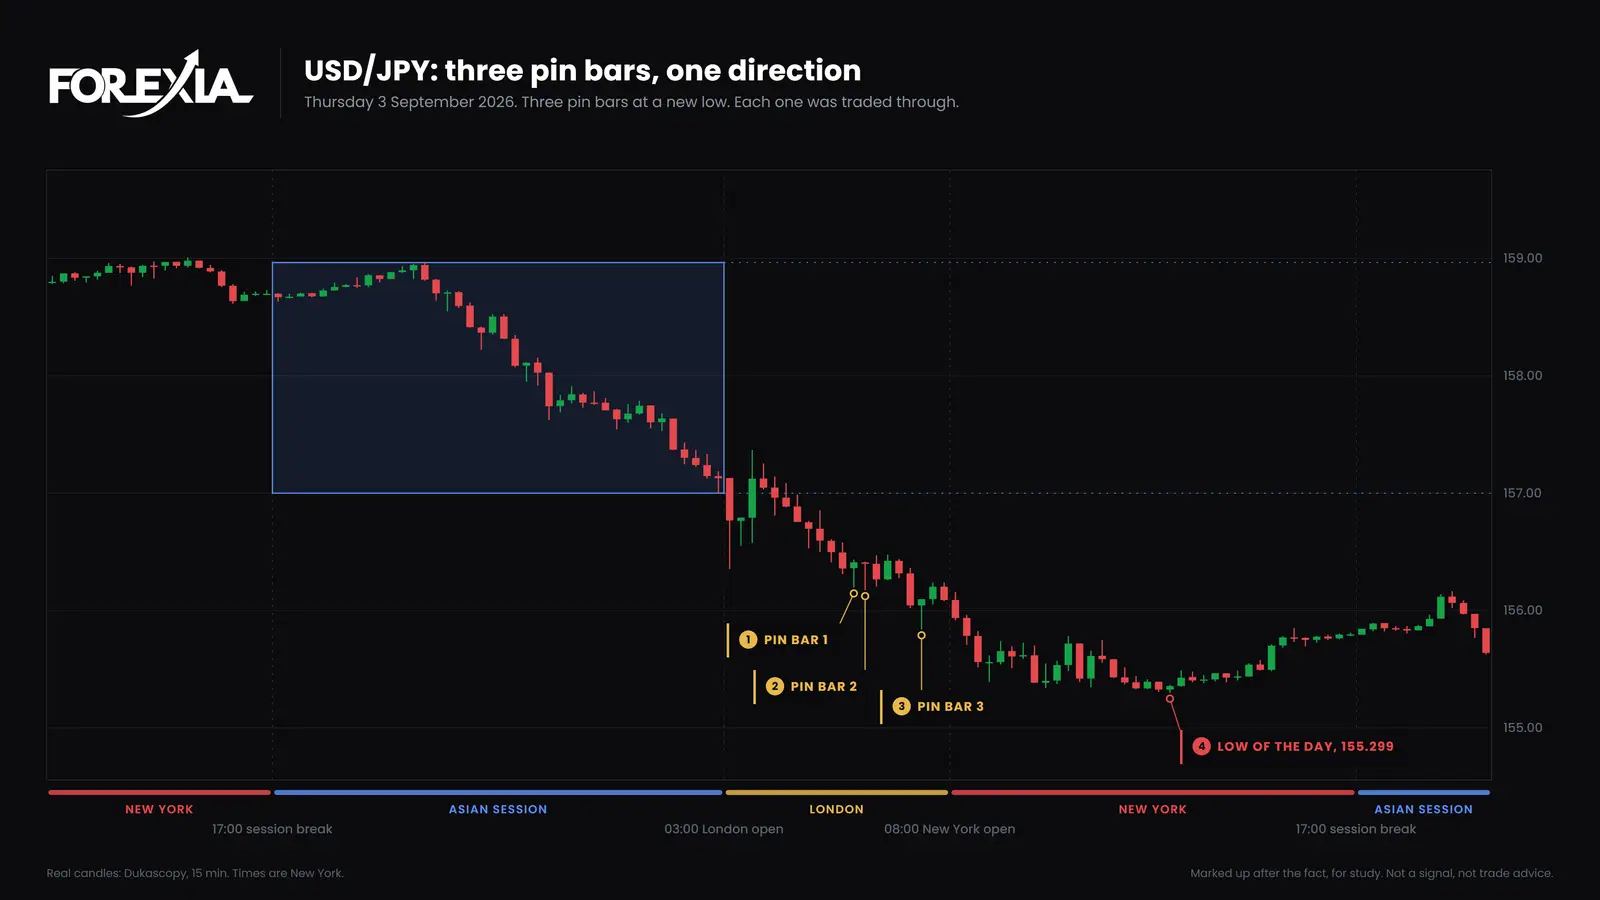
That one day proves nothing by itself, since we picked it. The table is the evidence and the chart is the picture of it. Pin bar vs engulfing goes further, and the trap candle in forex looks at the one huge candle from the wrong side.
M and W reversals and the second leg
M & W Reversals are the double top and double bottom read by place and time. They are an M off the highs or a W off the lows, drawn from a clear range in the Asian box, during London or New York. The second leg of the pattern is the hunt that confirms it.
The textbook double top can form anywhere on any chart. Our count above took them all, so it is not a count of M & W Reversals. An M in our vocabulary also has a place and a time, which that count ignores.
The Second Leg Climax is the volatile second leg that hunts the high or low of the day and confirms the M or W. It need not be large. On gold it ran 5 pips past the first high, and on the pound below it ran 17 pips past the first low.
These days are not clean either. Gold's Asian range took up 62% of its average daily range and closed near the top, which is not the clear range the M asks for, and it fell 132 pips anyway. Reading is not a checklist that sorts days in advance, and a close back can fail, as our stop hunt page shows on another gold day.
The spokes split this up: the M pattern in forex reads the shape and its W twin, what the second leg is goes through the hunt, and M and W vs double top and bottom sets them side by side.
A real day without indicators, marked up
GBP/USD on Wednesday 8 July 2026 needs no indicator to read, and nothing on our calendar for the pound, the euro or the dollar landed between a 03:30 speech and the Fed's minutes at 14:00. These are 15-minute Dukascopy candles in New York time, so your broker's chart may differ by a pip or so.
Look first at what Asia left: 1.33420 to 1.33657, 24 pips, about 29% of the average daily range. That shows where the crowd would mark its levels and says nothing about direction.
Then look at how London left it. The 04:15 candle broke the Asian low, and the 04:30 candle reached 1.33386, 3 pips under it. Price pulled back to 1.33515, and the crowd sells a break like that. Nothing on the chart yet said the low was in. The 04:45 candle slipped just past that first low, and the 05:00 and 05:15 candles ran to 1.33219, 17 pips past it. That took the stops under it, and it looked like a market falling hard.
The candle that opened at 05:30 closed back above the first low, at 1.33443. We read that as the sweep having happened, and it was a read and not a promise. The next four hours settled nothing. Price stayed under the Asian high until 09:30, but several candles closed back under the Asian low, and the 07:30 candle fell to 1.33294, 8 pips above the day's low. We read nothing from candle shapes in those hours.
The 09:30 candle closed above the Asian high, at 1.33723, and price dipped back to 1.33564 at 11:15. It then ran to 1.34101 at 13:15, 88 pips from the low, and that low turned out to be the low of the week.
The euro's failed double top above came on the same day, and the 13:00 candle rose on both charts. They share a dollar, so neither chart's story stands alone. We picked this day because it reversed, so it is a picture of what happened and not a setup.
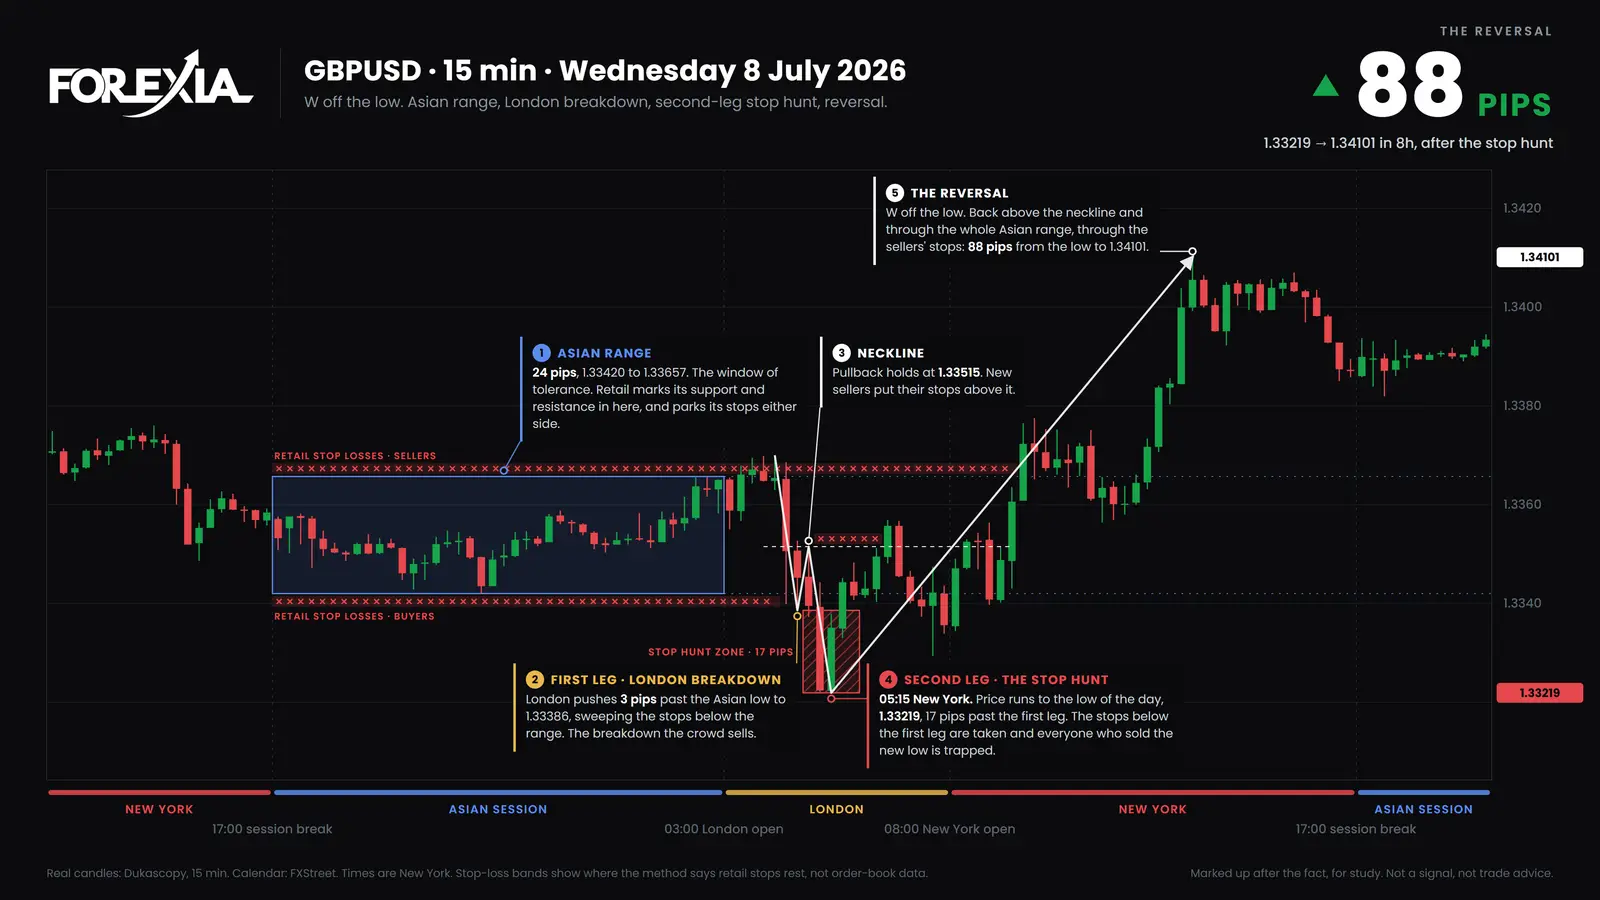
Price action trading without indicators reads a day candle by candle, and our forex chart markups add more real days every week.
Why indicators arrive late, and other common mistakes
Indicators arrive late because they are made from candles that have already closed. A moving average is an average of past prices, so a cross can only print after the move that caused it. We counted that on the same candles, using the 20 and 50 EMA on every 15-minute chart: 1,132 crosses from the London open to 17:00.
- The median cross came with 63% of the move already done. The middle half ran from 42% to 82%.
- 394 crosses came with at least three quarters of the move done.
- 444 crosses had crossed back before 17:00 the same day.
The end of a move is known only afterwards, so this says how late a cross came and not what to do at one. Our word for the crowd's version is The Trap: the averages cross late, pull the crowd in, then cross back onto their stops. Why moving average crossovers fail shows it on a USD/CHF day.
This does not mean you must delete your indicators. An average can still be a useful picture of trend or an alert for a person to judge. It only knows what the candles know.
The other mistakes we see most often:
- Trusting the name. "It's a double top" is a description of the past. Nearly seven in ten of ours never gave the signal.
- Reading a shape as a signal. In our count pin bars and engulfing candles went no further than any other new low or high.
- Borrowing another study's figures. A pattern count from other charts says nothing certain about 15-minute forex, and that includes the one we quote above.
- Learning only from marked-up days. Charts are chosen after the move, ours included. They teach what a reversal looks like, not how often one comes.
- Taking a reading for proof. Ours is a read as well. Keep a log of every setup you take or skip, since that is the only record that can show you whether your reading is worth anything.
Does price action trading work? What our own test says
As a way to read a chart, yes. As a fixed rule, the version we tested lost money. We ran the setup with no judgement on seven dollar majors and gold, from 2021 to 2026, on 5-minute candles with real spreads plus commission and slippage, about 2,200 trades a year. Every year lost, between -0.10R and -0.23R a trade, where R is the amount risked on one trade.
That does not show that a person reading the chart loses, or wins, and it is one rule we wrote on past prices. It does show that seeing the pattern is not enough on its own. The sample, costs, limits and why charts flatter the idea are all on the stop hunt page.
Course 3 of ForexiaPRO, Reverse Price Action, teaches this read step by step, from lesson 3.1.1, Every pattern is an invitation.
How it works
- How to Spot Reverse Price Action: Reading a Pattern Backwards on a Real Gold Day
How to spot reverse price action: what to look at behind a pattern, who it traps and where their stops rest, on gold, 25 September 2026, and USD/CHF.
- False Breakout in Forex: Who Built the Pattern You Just Traded, and Why Right There?
A false breakout in forex on three real days: whose stops sit behind a clean break, why price goes there, and how often a break turns out to be real.
- M Pattern Forex: How to Read the Double Top Backwards (and the W Double Bottom)
M pattern forex: what the M and its W twin trap, why a clear Asian range matters, and how each one played on USD/JPY and gold in 2026, with real prices.
Real days
- USD/CAD Double Top, 1 October 2026: Reading the M Backwards, Then What Price Did
A USD/CAD double top on 1 October 2026, read backwards: who it trapped, the stop hunt 4 pips past the first high, and what price did that day and the next.
Questions
- Why Double Tops and Double Bottoms Fail: The Third Tap and the Crowd It Fills
Why double tops and double bottoms fail: the book sends everyone to the same places. A count of 983 shapes and two real days from August 2026, with prices.
- Why Moving Average Crossovers Fail: The Crowd's Averages Cross Late, Then Cross Back
Why moving average crossovers fail: a count of 1,132 crosses on 15-minute forex candles, and two real days with the crowd's averages drawn and labelled.
- Is a Double Top a Stop Hunt? What the Second High Actually Took
Is a double top a stop hunt? Only when the second high runs past the first and closes back. A count of 303 shapes and three real days, one that kept going.
- What Is the Second Leg in a Reversal? Second Leg Climax on Gold and EUR/USD
What is the second leg in a reversal? In an M or W the first leg is bait and the second is the hunt. Six real days: how far each ran and what came next.
The words
- M & W Reversals: the M and W Pattern in Forex, Read Leg by Leg
M & W Reversals are an M off the highs or a W off the lows. Both shapes leg by leg, on gold and the pound in August 2026, and why the second leg matters.
- Reverse Price Action: Reading a Pattern Backwards, and What a Fake Breakout Really Is
Reverse Price Action reads a chart pattern backwards, from the stops it leaves to who uses them. A fake breakout on USD/JPY, 4 August 2026, with prices.
- Second Leg Climax: the Second Leg Reversal Pattern Behind the M and W
Second Leg Climax is the volatile second leg that hunts the day's high or low and confirms an M or W. One 46-pip candle on EUR/USD, 31 July 2026.
Frequently asked questions
What is price action trading?
Price action trading means making decisions from the candles themselves: where price went, where it stopped and how fast, with few or no indicators. Traders read trend, support and resistance, breakouts, candle shapes and chart patterns. It is a branch of technical analysis and a way of reading a chart, not proof of an edge.
Does price action trading work?
It works as a way to read a chart. Whether it pays is unproven: we know of no reliable published figure for the style as a whole. Our own fixed-rule version lost after costs in every year from 2021 to 2026, on seven dollar majors and gold, between -0.10R and -0.23R a trade. That does not show a person reading the chart loses, or wins.
Is price action a strategy or just technical analysis?
It is a part of technical analysis, not a strategy by itself. A strategy needs rules for the entry, the stop and the size of the trade. Price action is the reading those rules are built on, which is why two traders can both use it and take opposite trades on the same chart.
What is the best price action trading strategy?
We cannot name one, and we know of no evidence that anyone can. Trend pullbacks, breakouts, pin bars and head and shoulders are the most quoted. The fair test is to write the rule down, run it over years of candles with real spreads and costs, and see what is left. Ours lost money.
Why do double tops and double bottoms fail?
The textbook sends everyone to the same places: a sell under the neckline and a stop above the peaks. Our read is that those are pools of orders price can use. In our count, 680 of 983 shapes did not close through the neckline that day before price went past the peak, and 104 of the 303 that did traded back past the peak before reaching the textbook's target.
Does a rising wedge break up or down?
Usually down. In our count of 184 rising wedges on 15-minute forex and gold candles, 140 broke down, 39 broke up and 5 did not break. Most of that is geometry: the lower line is steeper, so a sideways market leaves through the bottom. Only 16 of the 140 had closed under the wedge's last low when they broke.
What is a reversal candle?
Most sites use the phrase for any candle shape said to signal a turn, such as a hammer, a pin bar or an engulfing candle. The Reversal Candle in our vocabulary is one huge candle through the stops, straight after the crowd gets in. It does the damage in a single bar, and it is known by where it happens rather than by its shape.
What is the difference between a reversal candle, a pin bar and an engulfing candle?
A pin bar is a long wick with a small body. An engulfing candle has a body that covers the body before it. Both are defined by shape, and in our count neither moved price further than any other candle making a new high or low. The Reversal Candle is defined by its place: it runs through a pool of stops.
Do you need indicators for price action trading?
No. Most indicators are calculations on the same candles, so they cannot know more than the candles do, and they arrive after them. In our count of 1,132 moving average crosses, the median cross came with 63% of the move already done. Some traders still use them as an alert or a filter, and nothing here proves that is wrong.
What is the best timeframe for price action trading?
We have no evidence that any timeframe is best, and we have not seen any. Patterns look the same on every chart, but costs do not: spread and commission take a larger share of a small stop. In our own test smaller stops made every version worse. Our counts on this page are 15-minute candles only.
Does price action work on gold, crypto and stocks?
The same reading is used on all of them. Our counts cover seven dollar majors and gold, and gold's double tops were in line with the rest. We have no count for crypto or stocks, which differ: stocks gap overnight and have a central volume record, and crypto trades all week. Do not carry a figure from one market to another.
Can price action trading be backtested?
Only once it is written as a rule, and a rule loses the judgement some traders say is the point. A fixed rule still sets a bar. Ours lost money, and a person who believes they read better can prove it by logging every setup taken or skipped. A test run over hand-picked charts proves nothing, because they were picked after the move.
The latest chart markups
- Forex Chart Markups: Weekly Stop Hunt & Reversal Archive
Forex chart markups, week by week: stop hunts, M and W formations and midweek reversals on the majors and gold, drawn on real candles.
- Reverse Price Action: How to Read a Forex Chart Markup
Reverse price action reads a chart from the side of the crowd: where retail orders and stop losses sit, and how price collects them. A visual guide.
- EURUSD Stop Hunt: Forex Chart Markups, 28 September 2026
An EURUSD stop hunt through Tuesday's high on US PCE data completed an M formation and fell 165 pips. Chart markups, 28 September 2026.