
Liquidity Sweep: Where the Stops Sit and Why Price Goes to Take Them
What is a liquidity sweep? A definition in two sentences
A liquidity sweep is price running past an obvious high or low to take the stop-loss and breakout orders resting there, then closing back inside the level. Those orders are the liquidity, and a chart can show you the move but not who made it.
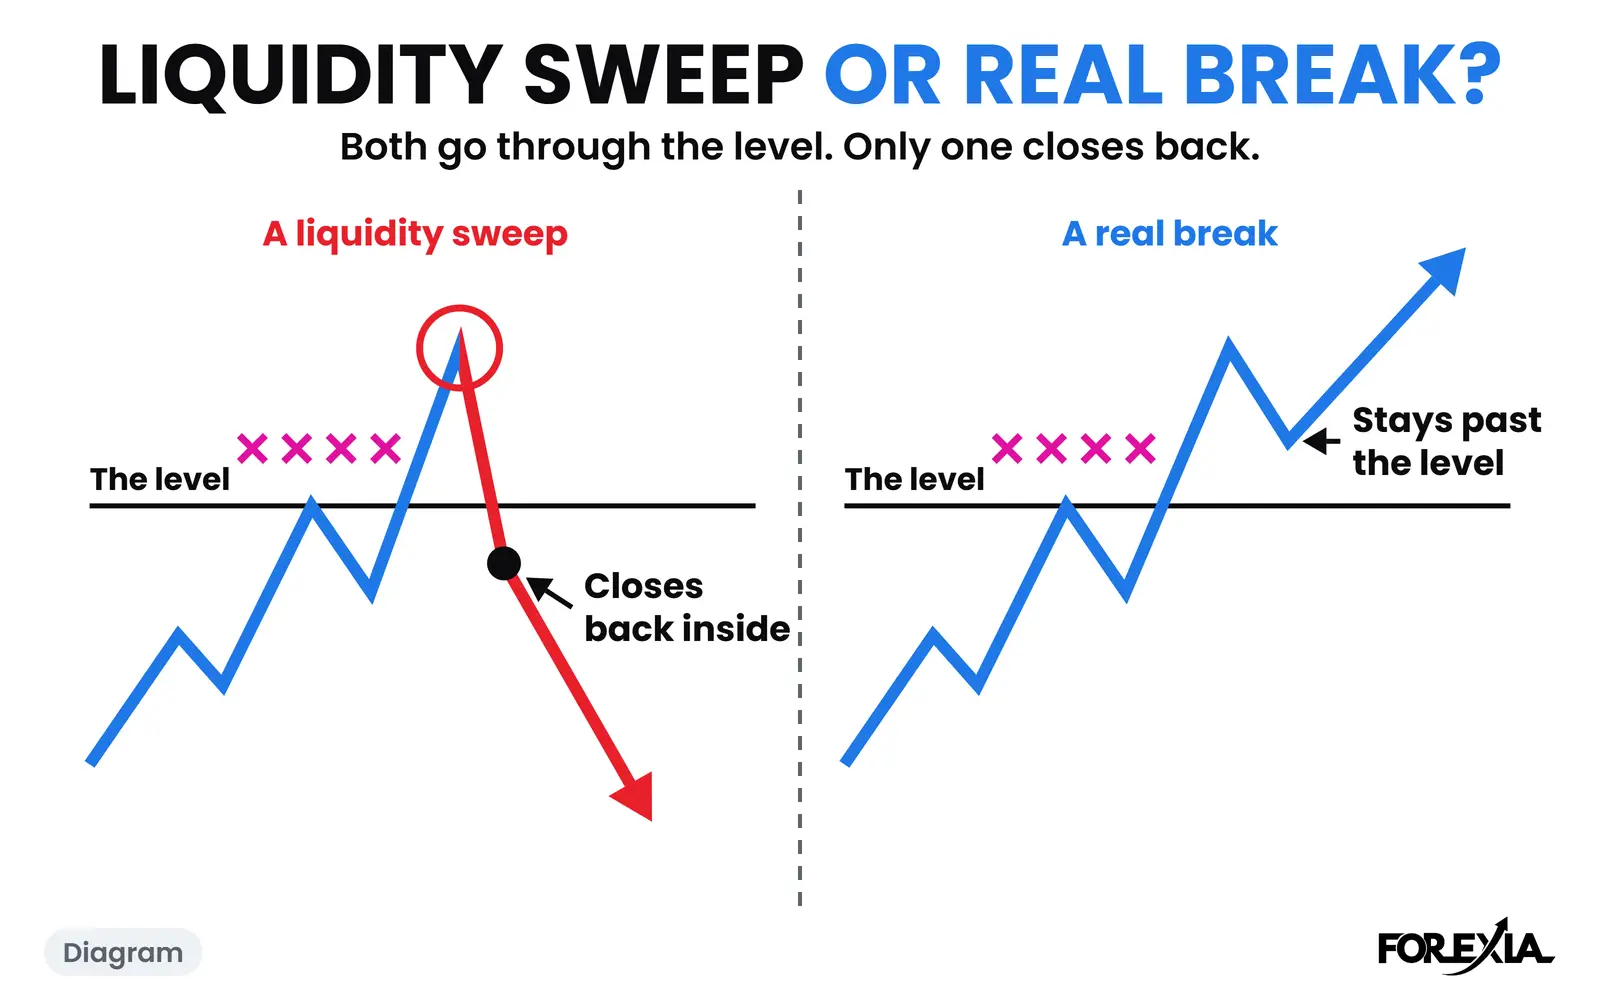
We call the same move The Stop Hunt. A stop hunt names where price went, and a sweep names what it took. If a bank's page sent you here, that is another thing altogether: a bank's sweep moves spare cash between accounts, and the two meanings are split here.
This page explains where the orders rest and why price goes to them. It then shows five dated days on our own charts, one of them candle by candle, and counts 1,601 levels on eight markets. It ends on what a sweep cannot tell you, including that our own rule built on it did not make money.
What is liquidity in forex? Orders resting above every high and below every low
Liquidity in forex is the orders available to trade against at a price. A trader buying in size needs someone selling, and the more orders wait at a price, the more can fill there without moving it. Foreign exchange trades over the counter, about $9.6 trillion a day across all its products in April 2025, with no central exchange. So no public book shows everyone's orders.
The orders that matter for a sweep are the ones a textbook tells everyone to place:
- Above a high: buy orders. The stop losses of traders who are short, because a stop on a short is a buy, and the buy-stop entries of breakout traders.
- Below a low: sell orders. The stop losses of traders who are long, and the sell-stop entries of breakout traders.
That is the whole difference between a sweep of a high and a sweep of a low: which way the orders fire.
Stops pile up past highs and lows because everyone learned the same places. Not every swing gathers a crowd, and which highs and lows count as obvious has its own page. A walk through one chart is in where liquidity sits on a chart.
Marking those places before the session is what we call Liquidity Mapping. Reading the chart for the crowd's stops, by working back from how they were taught to trade it, is Liquidity Visualization. Both are readings. The red crosses on our charts mark where the method says stops rest, and they are not order-book data.
Why is price drawn to the stops? The market maker's seat
Our read is that price goes to stops because stops are orders that have to fill. A buyer in size wants sellers, and a pile of stops under a low is a pile of sell orders. It can fill there without chasing the price up.
The move also feeds itself. Each stop that fires is a market order, which pushes price toward the next one, and breakout traders join in. When those orders run out, the push has nothing left behind it.
The three seats make this easier to see:
- Retail sees a level and a break. The textbook says sell the breakdown, or keep the stop just under the low.
- The market maker sees where the orders are. Our read is that market makers build the chart: the quiet hours give the crowd its levels, and the sweep collects the stops behind them.
- The observer reads both from outside, and waits for a candle to close before calling it anything.
That read has a limit. A sweep can happen with no hunter: a large order with nothing to do with the level, a thin market around a release, or a chain of stops feeding itself. Those candles look the same, which is why we write "we read this as". Whether anyone can be shown to have done it on purpose is on our stop hunt page, with what regulators have put in writing.
A real liquidity sweep example, marked up candle by candle
USD/CAD on Wednesday 30 September 2026 swept the low of the Asian range on a US data candle, and the candles after it were not tidy. Asia left a 25-pip range, 1.41747 to 1.41996, which we draw as the Asian Box. London pressed down on its low all morning, coming within 2 pips of it several times without going through. That is how a level becomes obvious. The ADP jobs figure was due at 08:15 New York, and US core PCE and final GDP at 08:30.
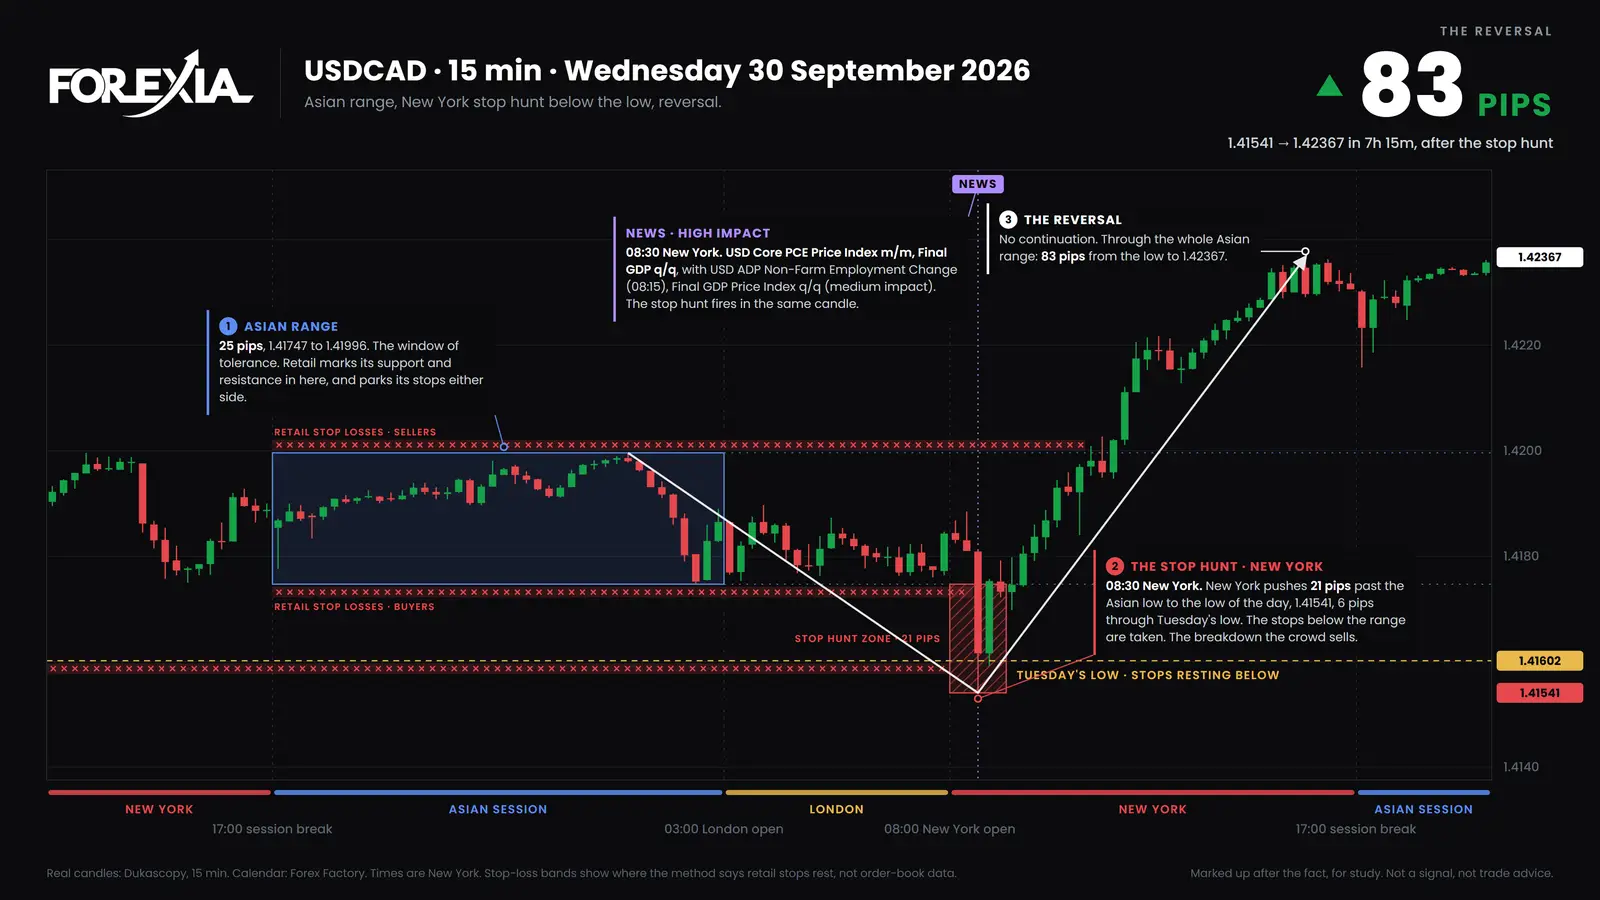
Times are New York, and each candle is named by the minute it opens.
| Candle | High | Low | Close | What it did |
|---|---|---|---|---|
| 08:15 | 1.41885 | 1.41810 | 1.41810 | The candle before the release, with ADP on the calendar. Closes 6 pips over the Asian low. |
| 08:30 | 1.41810 | 1.41541 | 1.41616 | The release. Runs 21 pips under the Asian low to the low of the day, and 6 pips through Tuesday's low. Closes under the Asian low. |
| 08:45 | 1.41757 | 1.41592 | 1.41753 | Closes back over the Asian low, by under a pip. |
| 09:00 | 1.41792 | 1.41722 | 1.41733 | Closes under it again. |
| 09:15 | 1.41798 | 1.41698 | 1.41746 | Still under, by a tenth of a pip. |
| 09:30 | 1.41820 | 1.41742 | 1.41805 | Closes back over. No later candle that day closes under the Asian low. |
We read the 08:30 candle as the sweep. The crowd sold the break, and those stops funded the turn. By 11:00 price had traded through the top of the Asian range, where the sellers' stops were. It printed the day's high of 1.42367 at 15:45, 83 pips off the low and 7 hours 15 minutes after it.
Two things here are missing from the usual diagram. The first is that the close back was undone by the next candle, and for 45 minutes the read was unclear. Only the 09:30 candle settled it, and only looking back.
The second is that one of the levels may not be quite real. Tuesday's low of 1.41602 printed on the first candle of that session, at the 17:00 rollover on Monday evening, when spreads widen. Our data feed is the bid price, so a low there can be the spread rather than a traded price. Without that candle's wick the low is 1.41648. The sweep went through it either way, but the 08:30 close sits above one figure and below the other. Your broker's chart may differ by a pip or so.
More days like this are in our forex chart markups, every week.
Liquidity sweep, grab or run? What each word means, and the meaning in banking
We treat a liquidity sweep and a liquidity grab as the same event and a liquidity run as a different one, because the sources do not agree on the lines. Some say a grab is one fast candle and a sweep takes several. Some split them by how deep price goes. Some say a sweep reverses and a run continues, and at least one says a sweep continues and a grab reverses.
| Word | What writers use it for | What we mean by it |
|---|---|---|
| Liquidity sweep | A move through a level that reverses, or one that lingers there, or any move through it | Through the level, and a candle closes back inside |
| Liquidity grab | A quick one-candle poke, or a plain synonym for a sweep | The same as a sweep |
| Liquidity run | A move through a level that keeps going | Through the level, and candles keep closing beyond it |
| Stop hunt | A sweep, named for the stops | Our word, from the market maker's seat |
Candle count does not hold up as a line. In the count further down, 25% of levels closed back on the same candle, 37% in the next hour and 20% later that day, so there is no gap to draw a line through. Nor is the fast one the safer one. When the close back came on the first candle, a later candle traded past the wick 76% of the time. When it came later, 57%. Those are counts of candles, not of trades.
Days of each are on liquidity sweep vs liquidity run, and the name most often paired with these is covered in stop hunt vs liquidity sweep. Fakeout and false breakout name the same move from the breakout trader's side, on stop hunt vs fakeout.
The liquidity sweep meaning in banking has nothing to do with any of this. There, a liquidity sweep or cash sweep is an automatic transfer of spare cash between accounts, often at the end of the day, so idle money earns interest or pays down a loan. Brokers run a version too: the US regulator describes a bank sweep program as moving a client's uninvested cash into a bank deposit account. Our page on the two meanings sorts them out. A third sense is on some broker order tickets: a sweep-to-fill order takes each available price until it is filled or reaches its limit.
How do you tell a liquidity sweep from a real break? The close back
A sweep closes back inside the level and a real break keeps closing beyond it, so you only know which once candles have closed. The Close Back is our name for that candle. It is the proof that a sweep happened, and it is no promise about what comes next. The two are compared on liquidity grab vs breakout.
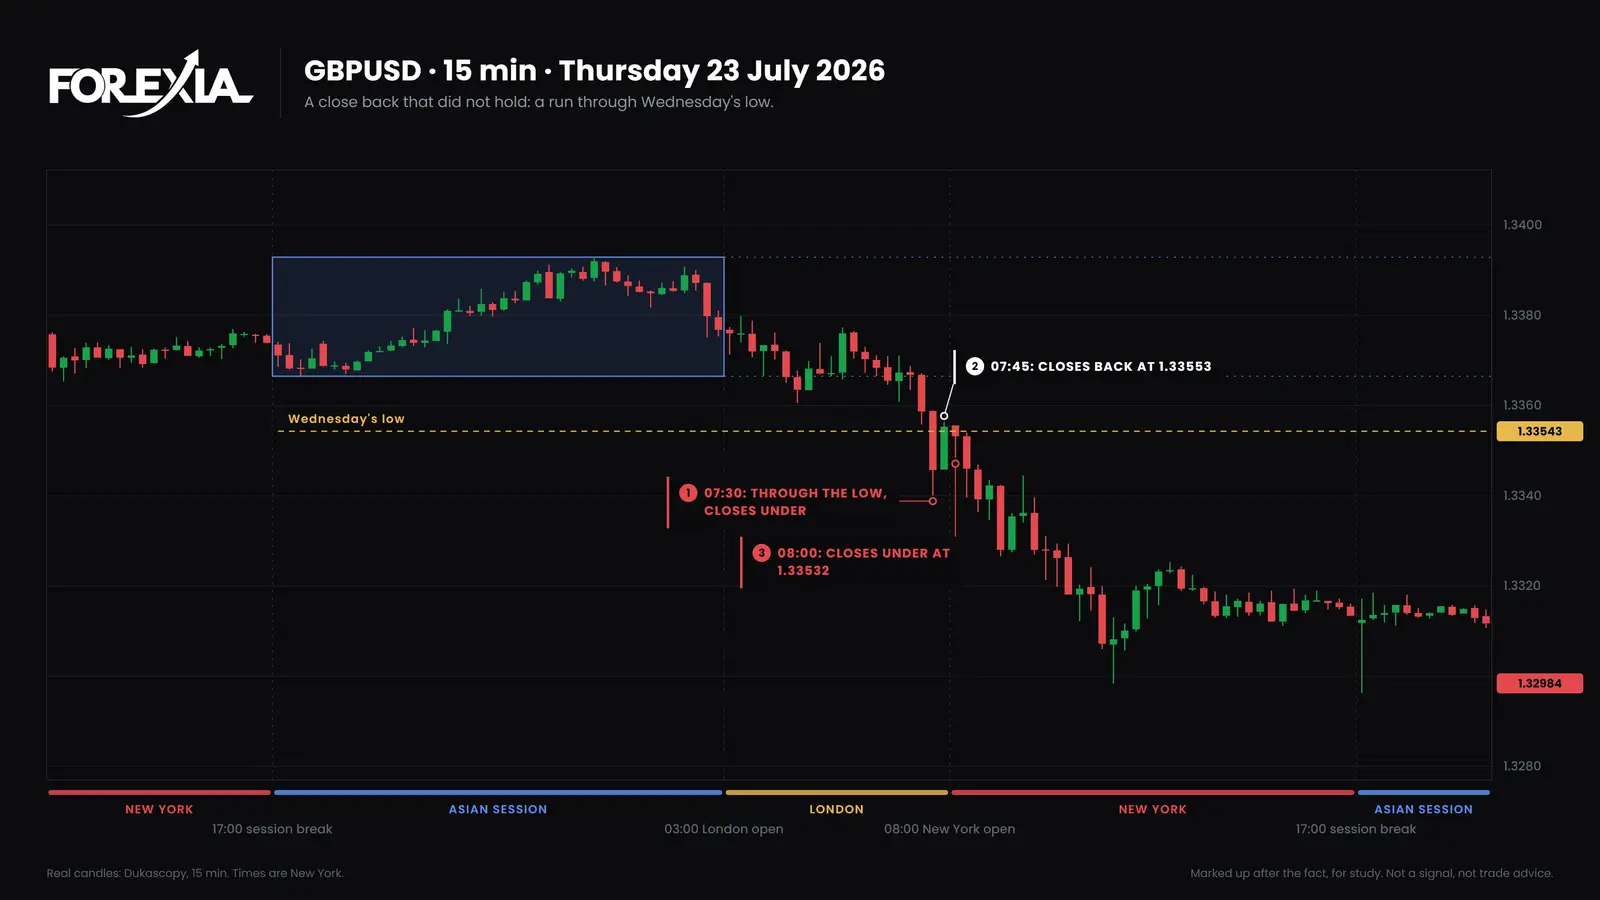
GBP/USD on Thursday 23 July 2026 shows why the second half of that matters. The level was Wednesday's low, 1.33543. The 07:30 New York candle ran 14 pips through it to 1.33401 and closed under it. The 07:45 candle closed back at 1.33553, a pip over the line. That is a close back.
The 08:00 candle closed at 1.33532, back under. No candle closed above the level again that day. The European Central Bank's decision came at 08:15, and the day's low printed at 11:30, at 1.32984, 56 pips past the level. The day ended 41 pips under it. That was a run with a close back inside it, and the crowd who sold the break were right.
So how much is a close back worth? We counted. The sample is seven dollar majors and gold on 15-minute candles, from 6 April to 1 October 2026. A level is an edge of the Asian range or the previous day's high or low, unless Asia had already traded past it. Taken means traded past by at least 3% of the average daily range, between the London open and 17:00 New York. Closed back means a candle closed on the near side of the level, or exactly on it, by 17:00. Depth is how far past the level price had gone by the close back, or by 17:00 where none came. On gold $1 counts as 1 pip.
| Market | Levels taken | Closed back that day | Median sweep, pips | Middle half of sweeps, pips | Of those, a later candle passed the wick |
|---|---|---|---|---|---|
| EUR/USD | 218 | 83% | 6.5 | 3.3 to 11.4 | 59% |
| GBP/USD | 221 | 82% | 7.3 | 4.2 to 14.2 | 65% |
| USD/JPY | 183 | 81% | 7.4 | 5.2 to 13.2 | 57% |
| USD/CHF | 222 | 80% | 4.1 | 2.5 to 7.6 | 73% |
| AUD/USD | 180 | 78% | 4.6 | 2.9 to 7.7 | 59% |
| USD/CAD | 223 | 83% | 5.7 | 3.2 to 10.3 | 63% |
| NZD/USD | 170 | 85% | 4.3 | 2.6 to 7.1 | 63% |
| Gold | 184 | 82% | 10.1 | 5.3 to 15.4 | 64% |
| All eight | 1,601 | 82% | 63% |
Three things follow.
- Most levels that get taken close back. That was 1,310 of 1,601, so a close back alone separates very little.
- The ones that did not close back went much further. The median was about two thirds of an average day past the level, against about a tenth for those that closed back. A normal sweep is only a few pips, so a stop a few pips behind a level is often still in reach.
- A close back is not a reversal. After 825 of the 1,310 close backs, price traded past the wick again the same day.
These depths are shorter than the ones on our stop hunt page, because they count every level that closed back. That page's table measures the day's extreme past the Asian range on days that reversed at least 0.4 of the daily range, over 2021 to 2026, and on that stricter test 41% to 51% of breaks became a hunt.
Where are the pools? The Asian range, the previous day and the week
The pools we mark first are the edges of the Asian range, the previous day's high and low, and the week's high and low, because those are the levels the most traders can see. A pool is any place where orders are likely to gather. Other guides also list equal highs and lows, round numbers and trendlines, and traders do put orders there. We have no count for those. A full walk through finding them is in how to find liquidity pools in forex.
The two daily pools behave much alike in our count: 82% of the 1,179 box edges taken closed back, and 81% of the 422 previous-day levels. Last week's high and low behave much the same: of the 177 weekly lines taken in 24 weeks, 157 closed back. The first leg of a move also leaves a level of its own, the High and Low of the Day, which a later leg can sweep.
The Asian range: gold, Friday 28 August 2026
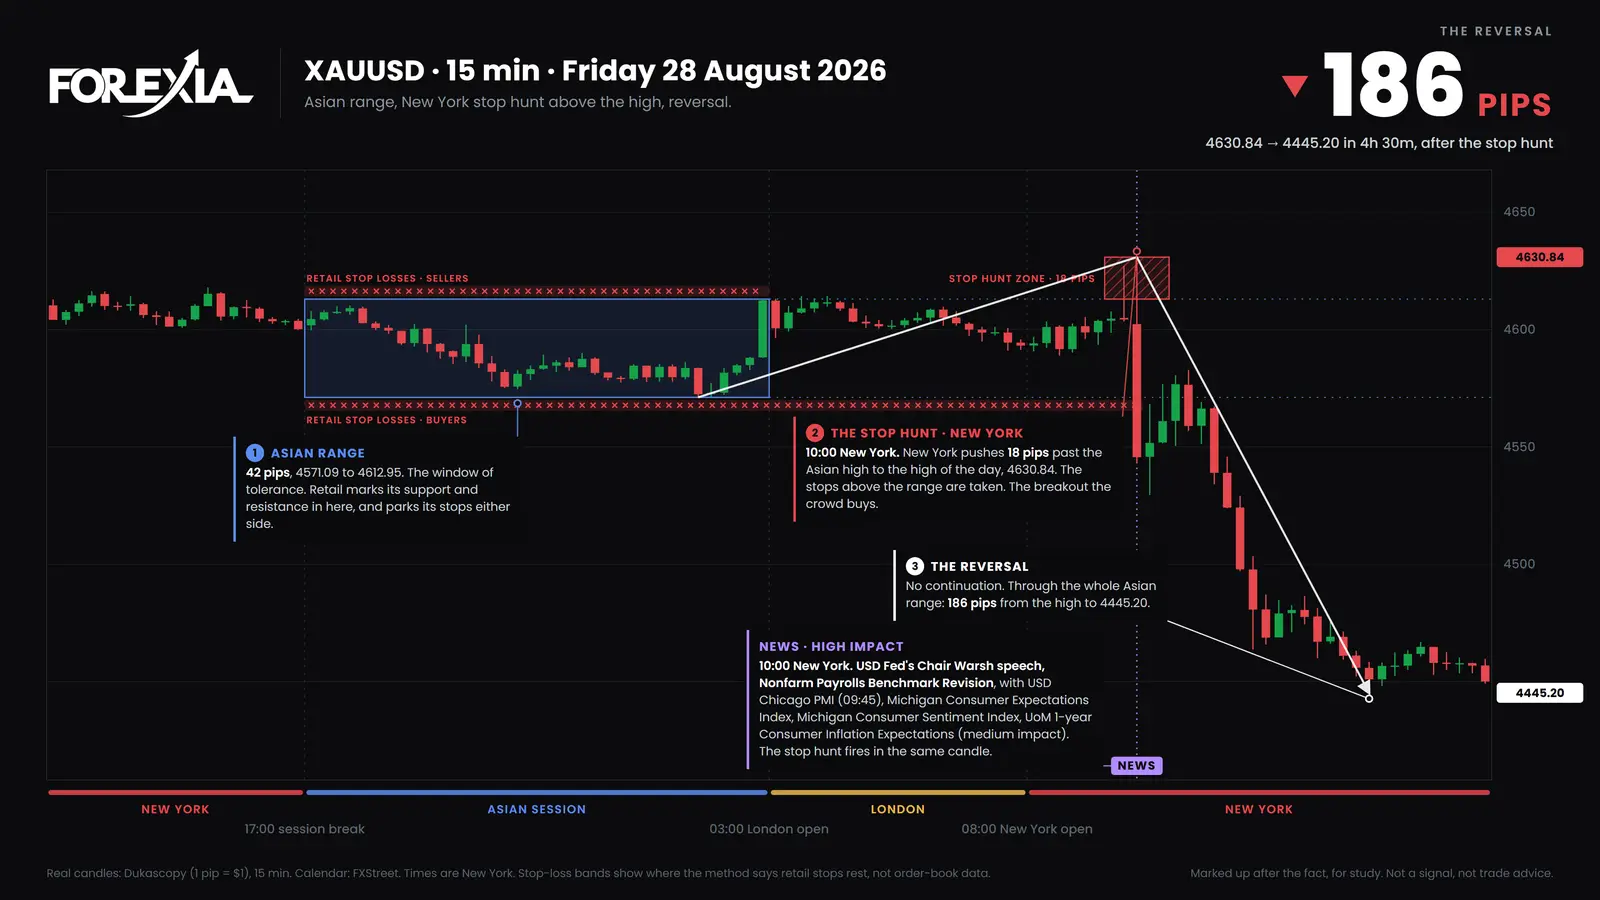
Gold left a 42-pip range in Asia, 4571.09 to 4612.95. On gold we count $1 as 1 pip. At 09:45 New York a candle ran to 4627.09 and closed at 4604.27, back under the top. The next one opened at 10:00, with the Fed chair's speech and a payrolls revision on the calendar. It went to 4630.84, 18 pips past the Asian high and the high of the day, then closed at 4545.60, under the whole range.
On our read, those two candles took the stops above the range, and the second went on to take the stops below it. By 14:30 price was at 4445.20, 186 pips off the high. It never reached Thursday's high at 4642.53, 12 pips further up, so price does not have to reach the biggest pool in sight. The first two pools of the day are the subject of the Asian range liquidity sweep, and gold has its own page on sweeps.
The previous day: EUR/USD, Wednesday 16 September 2026
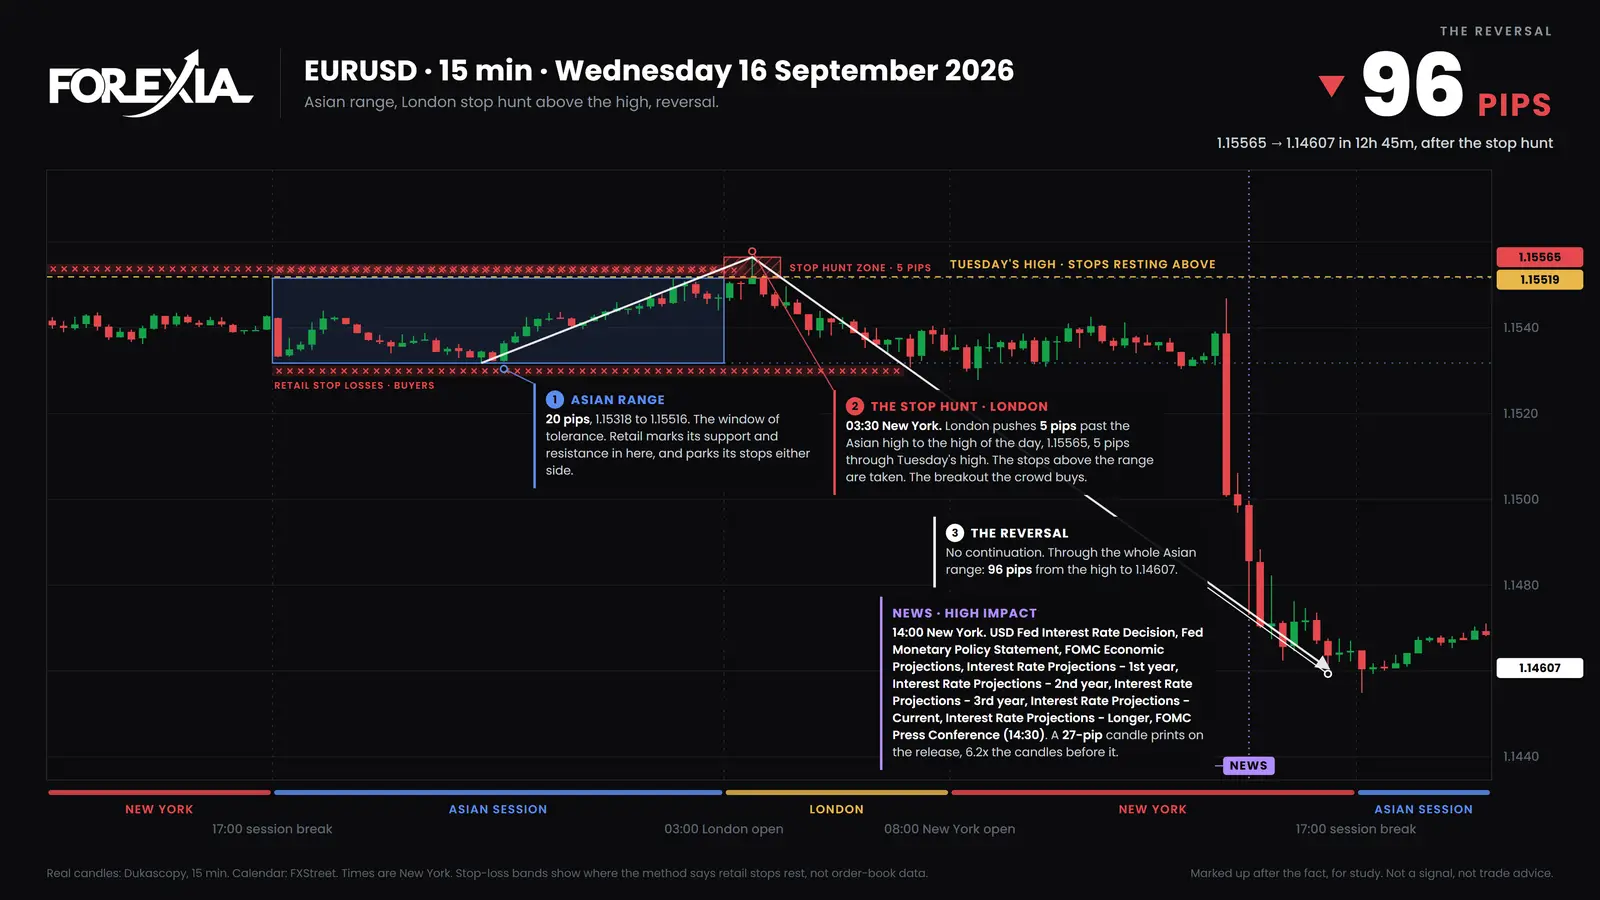
The Asian high, 1.15516, sat almost on the previous day's high, 1.15519, which made two sets of stops into one pool. Half an hour into London, the 03:30 New York candle ran 5 pips through both, to 1.15565, and closed at 1.15516, exactly on the Asian high and just under Tuesday's. The whole sweep took one candle.
It is tempting to credit that candle with the 96-pip fall to the day's low at 16:15, and we would not. When the 13:45 candle closed, price was only 18 pips off that high. The rest followed the Fed's decision at 14:00, ten and a half hours after the sweep. A sweep candle says nothing about a release still to come. More on this level is in the previous day high and low trading strategy.
The week: USD/CHF, Tuesday 22 September 2026
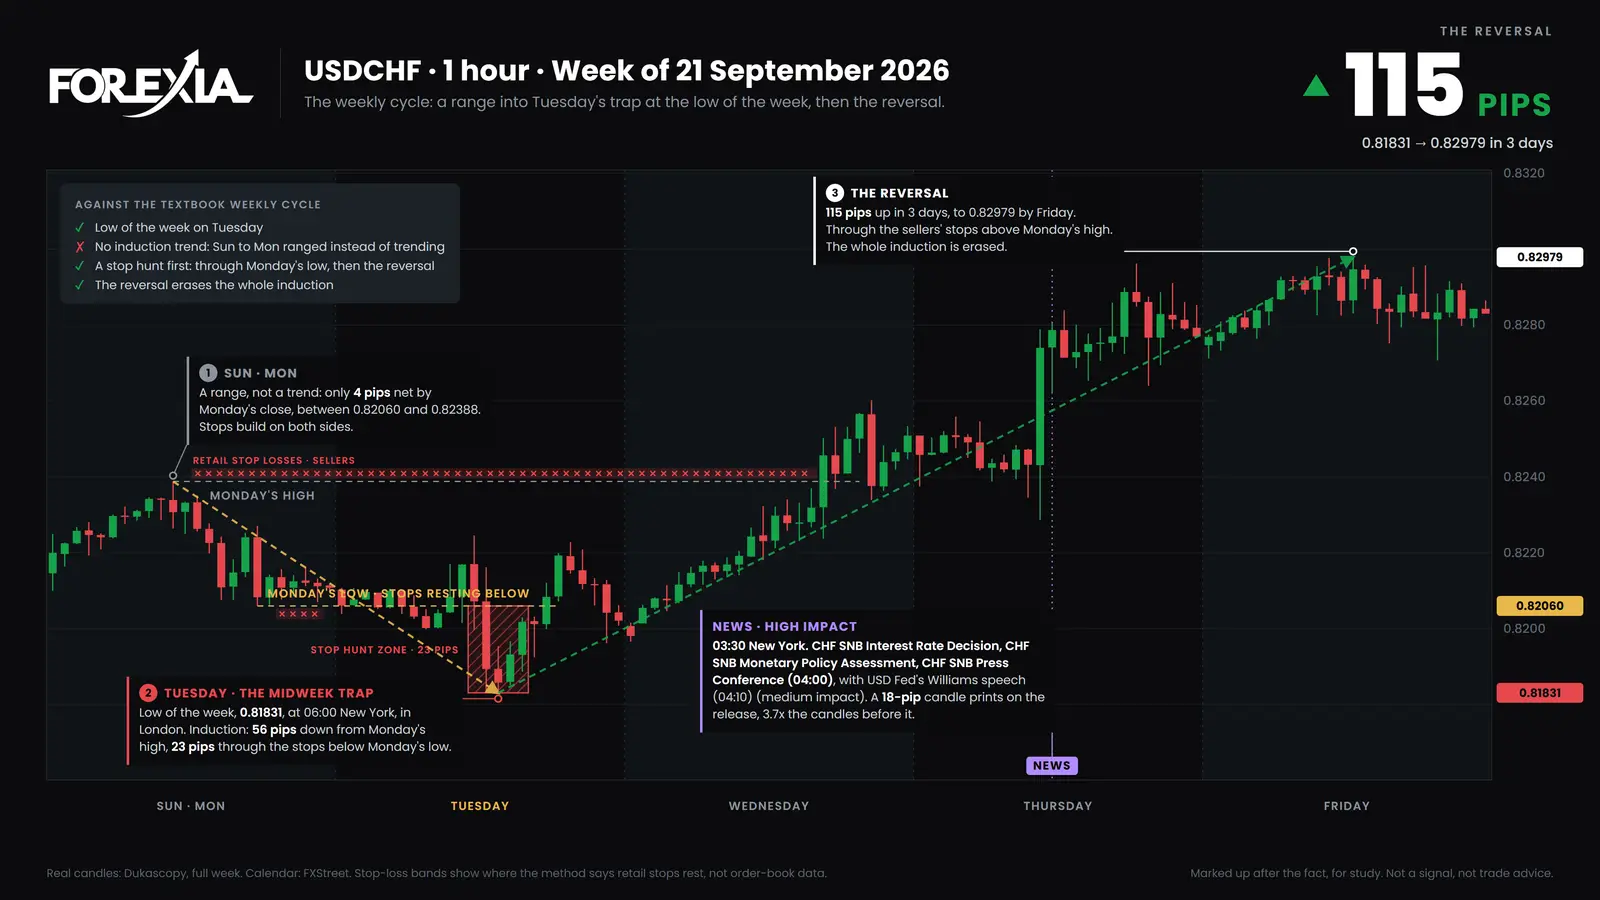
The Week's High and Low work the same way on a larger clock. Monday ranged between 0.82060 and 0.82388. Asia had already dipped through Monday's low, to 0.81999, so our count above leaves this level out for the day. London pushed on and reached 0.81831 at 06:00 New York, 23 pips under it. That turned out to be the low of the week, though nobody could know it on Tuesday.
This one took time. On 15-minute candles the first close back over Monday's low after that came on the 10:30 candle, at 0.82091, four and a half hours later. Price cleared Monday's high on Wednesday and reached 0.82979 by Friday, 115 pips off the low, with a Swiss National Bank decision on the way. A week is more moving parts than a morning, and weekly high and low liquidity goes further.
Common liquidity sweep mistakes, and what a sweep cannot tell you
Most mistakes come from naming the move too early or asking it to say more than it can.
- Calling it before the candle closes. Until then it is a break, and the 08:30 candle on USD/CAD looked like a breakdown right up to its close and beyond.
- Treating a close back as a promise. GBP/USD above closed back and fell another 56 pips.
- Treating a sweep seen afterwards as a setup. Every day on this page was picked after the fact, and we only mark up days that reversed. A chart of a reversal flatters what could be seen at the time.
- Dropping to a smaller chart to find a close back. A 1-minute candle can close back while the 15-minute closes beyond. Choose the chart first.
- Taking a spread spike for a sweep. Around the 17:00 New York rollover and around releases, the spread can widen and print a price another feed never showed. Check a second feed before you read anything into it.
- Crediting the sweep with everything after it. EUR/USD above fell 96 pips, and the Fed did most of that.
And what a sweep cannot tell you, however clean it looks:
- Who did it, or whether anyone did. The chart shows what happened, not who or why.
- That the stops were there. Nobody outside a broker can see those orders, and a broker sees only its own clients'. The level is a reading.
- That it beats chance. Prices that wander also cross a line and come back. A level traded just past will often be recrossed, so an 82% close-back rate is no evidence of hunting on its own, and we have not separated the two.
- How far it will go. The pool on the other side may be reached or it may not. Gold ran 186 pips, while GBP/USD did not turn at all.
- That it pays. We ran the setup as a fixed rule, with no judgment, against each flagged hunt on seven dollar majors and gold. From 2021 to 2026 every year lost after real spreads, commission and slippage, between -0.10R and -0.23R a trade, where R is the amount risked on one trade. That is one rule on one data source. It does not say a person reading the chart wins or loses. Our stop hunt page has its limits.
We have no count for crypto or stocks, where the same idea is used. The reasoning about orders carries over, but our figures do not.
Course 1 of ForexiaPRO, Reading the Map, teaches marking these pools from lesson 1.2.1, The Chart Is a Map of Orders. Course 3, Reverse Price Action, takes up the read from lesson 3.2.1, The Stop Hunt: The Liquidity Sweep Before the Move.
Start here
- Where Is Liquidity on a Chart? Just Past the Lines the Crowd Draws
Where is liquidity on a chart? Just past each line the crowd draws, in its stops and breakout orders. Three real 2026 days: AUD/USD, gold and NZD/USD.
How it works
- Asian Range Liquidity Sweep: The First Two Pools of Stops
An Asian range liquidity sweep takes the stops past the session's high or low. How to mark the range, then two real days: USD/CAD and NZD/USD in 2026.
- Liquidity Grab vs Breakout: How the Close Back Separates a Sweep from a Real Move
Liquidity grab vs breakout: the close back tells them apart, and even that can change. USD/CHF twice and USD/CAD in 2026, plus a count of 1,601 levels.
- Previous Day High and Low Trading Strategy: A Hunt or a Real Break?
A previous day high and low trading strategy fades the level or trades the break. Three real 2026 days, and what the textbook versions leave out.
- Liquidity Sweep vs Liquidity Grab vs Liquidity Run: What Separates Them
Liquidity sweep vs liquidity run: one closes back, one does not. A grab is mostly a sweep. Real dated days of each, and 1,601 levels that test the split.
- Weekly High and Low Liquidity: Why the Week's Extremes Hold the Most Stops
Weekly high and low liquidity: last week's fixed lines and this week's moving ones. A count of 177 lines taken, and three real 2026 weeks, one unturned.
Real days
- How to Find Liquidity Pools in Forex: EUR/USD and Gold on CPI Day, 11 September 2026
How to find liquidity pools in forex: what was on the chart before the 08:30 CPI candle on 11 September 2026, what price did, and a pool that never turned.
Questions
- Why Do Stop Losses Sit Above Highs and Below Lows?
Why stop losses sit above highs and below lows: four pressures, one bank's order book with its limits, and one round number from both sides on real days.
The words
- Liquidity Mapping: How to Mark the Pools of Stops Before the Session
Liquidity Mapping is marking the pools of stops before the session. One real map, AUD/USD on 25 August 2026, line by line, and what it cannot tell you.
- Liquidity Visualization: Seeing Where the Crowd's Orders Rest Before a Sweep
Liquidity Visualization is reading the crowd's mindset from the chart to see where its orders rest. GBP/USD on 9 September 2026, and how a map differs.
- The High and Low of the Day: the First Pool the Second Leg Hunts
The High and Low of the Day are the first pool a second leg hunts, a level that moves as the day runs. Gold on 22 September 2026, candle by candle.
- The Previous Day's High and Low: What Rests There, and How Often Price Closes Back
The previous day's high and low, PDH and PDL: whose orders rest past them, three real days and a count of 422 times price went through, and what came next.
- The Week's High and Low: the Biggest Pool of Stops, and Why It Moves
The Week's High and Low are the biggest pool of stops on the chart. Why the map moves daily, on a rising and a falling week, and what no chart can say.
Frequently asked questions
What is a liquidity sweep in forex?
A liquidity sweep is price running past an obvious high or low to take the stop-loss and breakout orders resting there, then closing back inside the level. Those orders are the liquidity. The chart shows that the move happened, but it cannot show who made it or prove the orders were there.
What does liquidity sweep mean in banking?
In banking it means something else entirely: an automatic transfer of spare cash from one account to another, often at the end of the day, so that idle money earns interest or pays down a loan. It is also called a cash sweep. It has nothing to do with charts or stop losses.
What is the difference between a liquidity sweep and a liquidity grab?
There is no agreed difference. Some writers say a grab is one fast candle and a sweep takes several, others split them by depth, and at least one says a sweep continues and a grab reverses. We treat them as one event: price goes through a level and a candle closes back inside it.
Is a liquidity sweep the same as a stop hunt?
In practice, yes. It is one move named from two sides: stop hunt says where price went, liquidity sweep says what it took. The Stop Hunt is the name Forexia uses. Neither name proves anyone planned the move, because a candle cannot show who moved it.
What is liquidity in forex?
Liquidity is the orders available to trade against at a price. For a sweep, the ones that matter rest just past obvious highs and lows: stop losses and breakout entries. Spot forex has no central exchange, so no public order book shows them. Where they rest is a reading of the chart, not data.
Why do stop losses sit above highs and below lows?
Because that is where traders are taught to put them. A short position's stop goes above the last high and a long position's stop goes below the last low, so anyone who learned the same pattern puts the order in the same place. A stop above a high is a buy order, and a stop below a low is a sell order.
What is the difference between a sweep of a high and a sweep of a low?
Only the direction of the orders. A sweep of a high fires buy orders, because stops on short positions and breakout entries above a high are buys. A sweep of a low fires sell orders. This page shows a low swept on USD/CAD on 30 September 2026 and a high swept on gold on 28 August 2026.
How do you tell a liquidity sweep from a real breakout?
Wait for the candle to close. A sweep closes back inside the level, and a real break keeps closing beyond it. A close back can still fail: on GBP/USD on 23 July 2026 one candle closed a pip back above Wednesday's low, the next closed under it, and price ran 56 pips past the level that day.
Does every liquidity sweep reverse?
No. In our count of 1,601 levels taken on seven majors and gold from 6 April to 1 October 2026, 291 had not closed back by the end of the day. Of the 1,310 that did, a later candle traded past the wick again the same day after 825. That is a count of candles, not of trades.
What timeframe should you use to read a liquidity sweep?
The move appears on any chart, but the answer can change with the chart: a 1-minute candle can close back while the 15-minute candle closes beyond the level. Pick one before you look. Our counts and the readings on this page use 15-minute candles, and we have no count on other timeframes, or for crypto or stocks.
Is there a liquidity sweep indicator?
Many. An indicator can draw swing levels and flag a wick that closes back, which saves time on marking a chart. None can see the stops, because no public order book shows them, and it flags the candle only once it has printed. When our own program flagged hunts as they happened, many of those days never turned into one.
Can you make money trading liquidity sweeps?
Our own fixed rule did not. Traded against each flagged hunt on seven dollar majors and gold from 2021 to 2026, every year lost after costs, between -0.10R and -0.23R a trade. That does not prove a trader reading the chart cannot do better, or that one can. It does mean spotting the sweep is not enough.
The latest chart markups
- Forex Chart Markups: Weekly Stop Hunt & Reversal Archive
Forex chart markups, week by week: stop hunts, M and W formations and midweek reversals on the majors and gold, drawn on real candles.
- Reverse Price Action: How to Read a Forex Chart Markup
Reverse price action reads a chart from the side of the crowd: where retail orders and stop losses sit, and how price collects them. A visual guide.
- EURUSD Stop Hunt: Forex Chart Markups, 28 September 2026
An EURUSD stop hunt through Tuesday's high on US PCE data completed an M formation and fell 165 pips. Chart markups, 28 September 2026.