Liquidity Sweep vs Liquidity Grab vs Liquidity Run: What Separates Them
Dylan Forexia8 min read
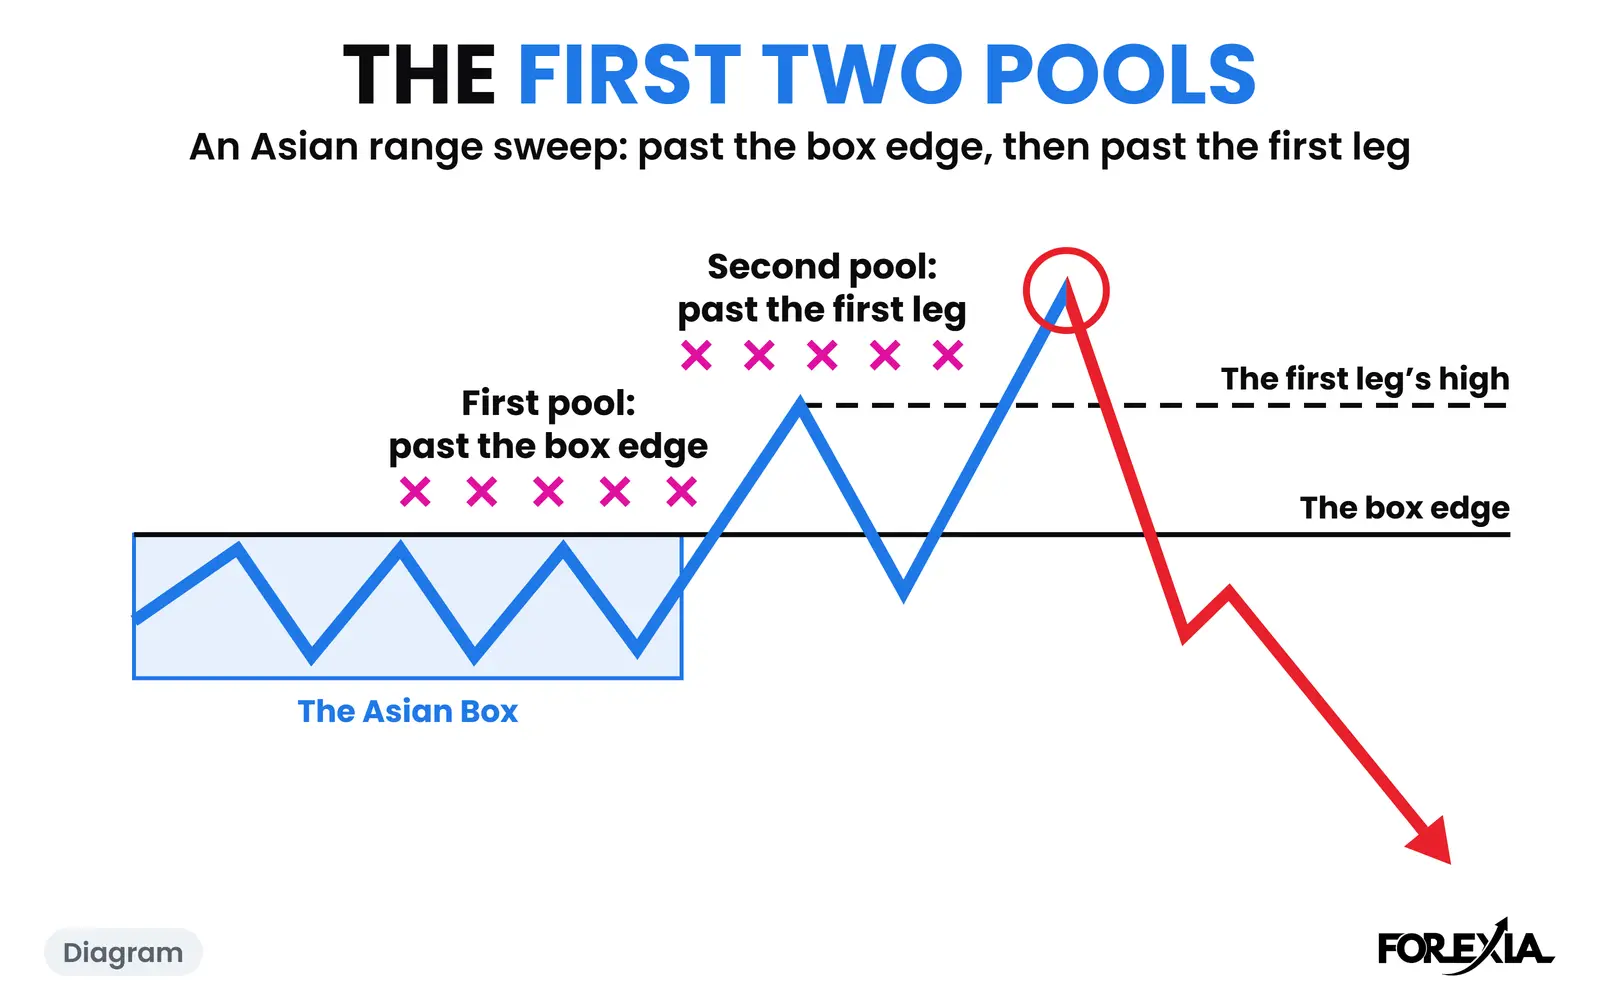
A liquidity sweep takes the stops past a level and then closes back inside it. A liquidity run takes the same stops and keeps closing beyond the level. That is the difference in liquidity sweep vs liquidity run, and you can only call it once candles have closed. A liquidity grab is usually a sweep under another name.
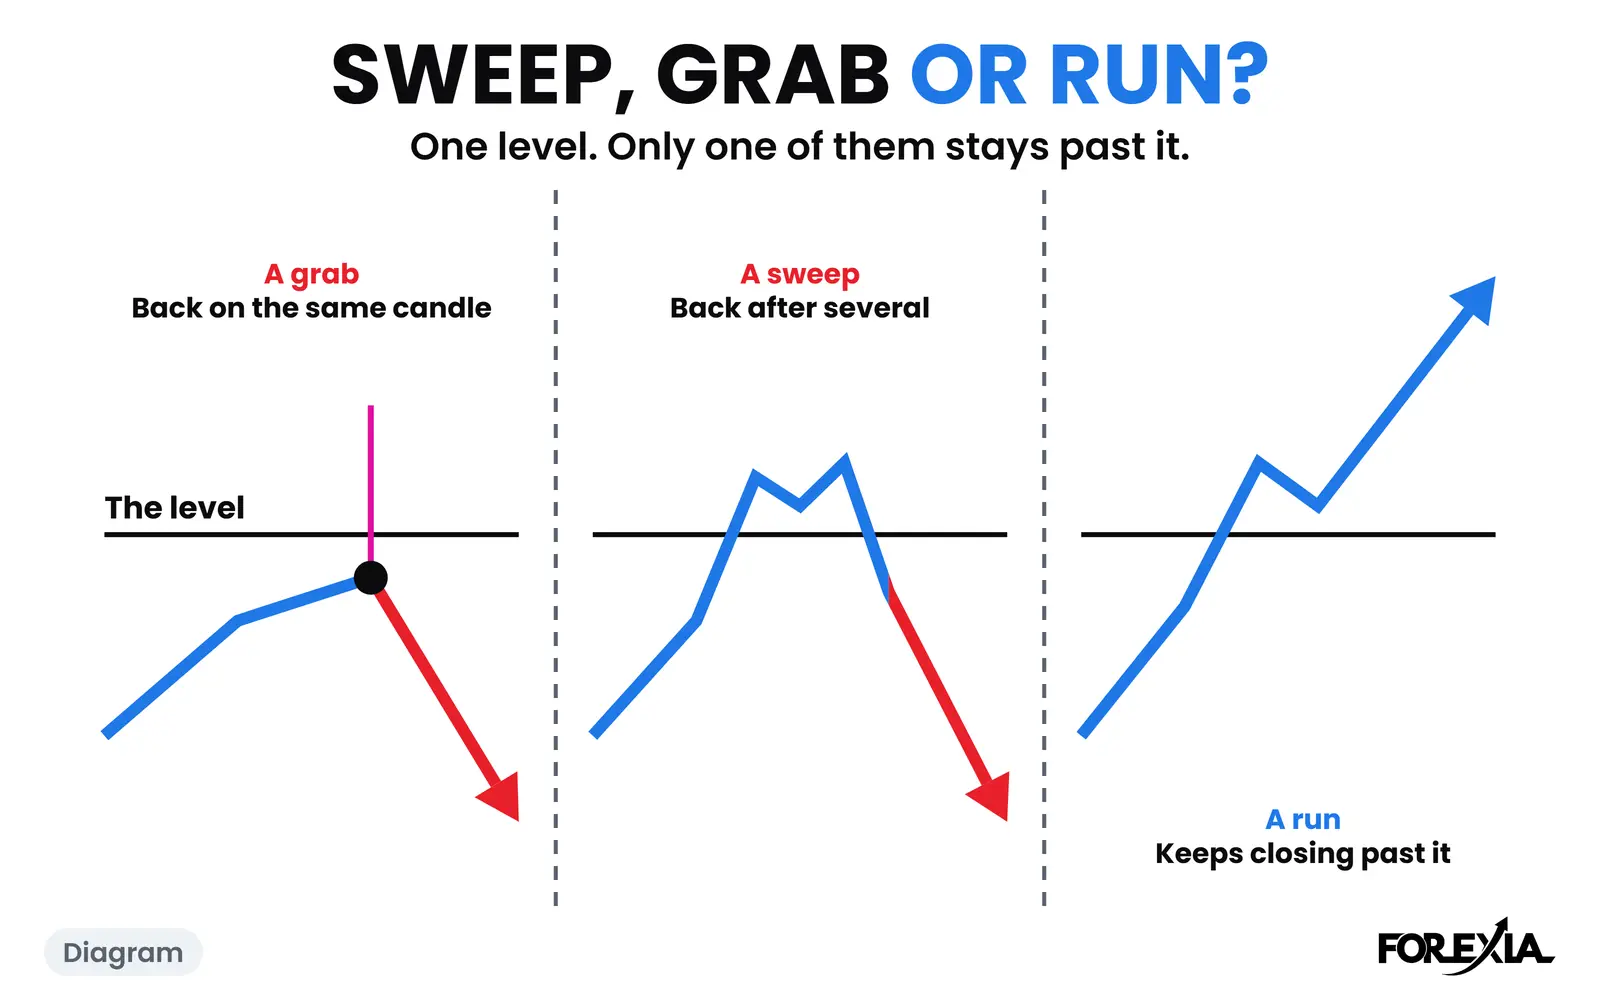
Writers disagree about these words. Some say a grab is one fast candle and a sweep takes several. Some split them by depth. Some say a sweep reverses and a run continues, and at least one has a sweep continuing and a grab reversing. None of them tests the line it draws, so we counted it on 1,601 levels. The move itself is explained on our liquidity sweep page. This page only separates the names.
Liquidity sweep vs liquidity run vs liquidity grab: the table
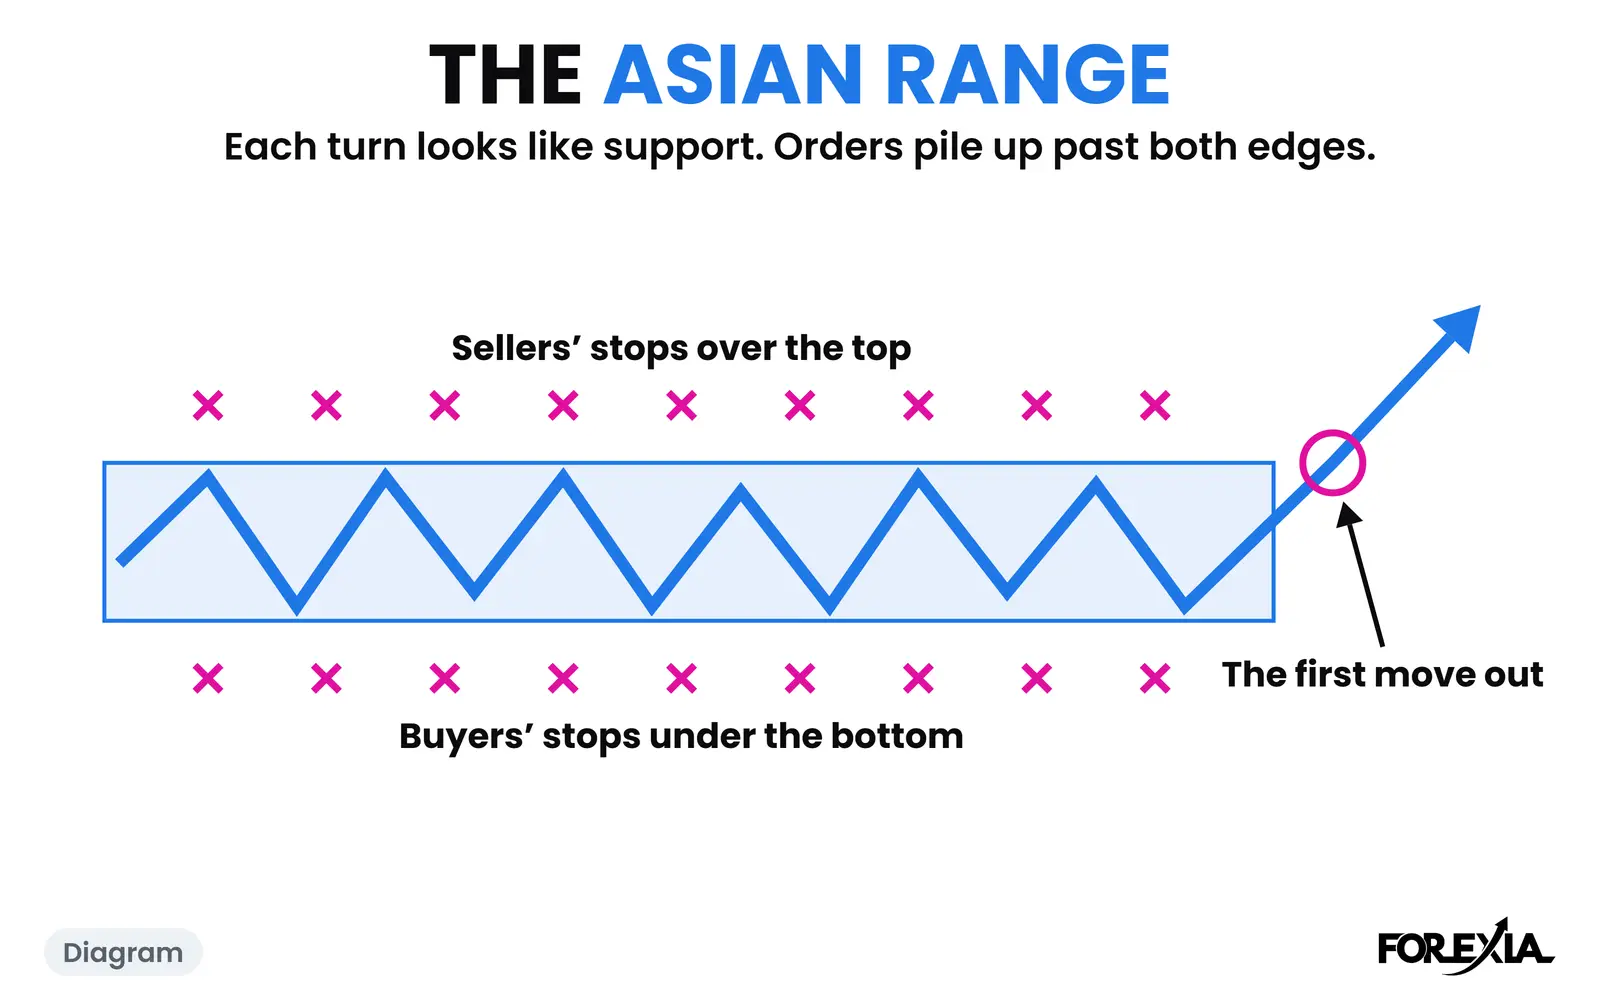
All three begin the same way: price goes through a level and fires the orders resting past it. Why those orders sit there has its own page, and so does finding them on a chart. The words differ only in what the candles do next.
| Liquidity grab | Liquidity sweep | Liquidity run | |
|---|---|---|---|
| What the candles do | Close back inside on the same candle | Close back inside on a later candle | No close back inside that day |
| Median distance past the level | 4.7% of the average daily range | 12.5% | 65.1% |
| When you can name it | When that candle closes | When the close-back candle closes | At the end of the window you chose; we use 17:00 New York |
| What the name proves | A candle closed back | A candle closed back | Nothing closed back, so far |
| Our word | The Stop Hunt, as a read | The Stop Hunt, as a read | A break |
So we treat a grab and a sweep as one event and a run as a different one. The candle that settles it we call The Close Back. If a bank's page sent you here, its sweep is another thing altogether: the banking meaning moves spare cash between accounts.
Does speed separate a grab from a sweep?
No. Speed tells you how far price had gone by the close back, and it gives no better idea of what comes after. We counted seven dollar majors and gold on 15-minute candles, from 6 April to 1 October 2026. A level is an edge of the Asian range or the previous day's high or low, unless Asia had already traded past it. Taken means traded past by at least 3% of the average daily range, between the London open and 17:00 New York. Closed back means a candle closed on the near side of the level, or exactly on it, by 17:00.
| What happened by 17:00 | Levels | Median depth, share of the average daily range | Of those, a later candle passed the wick |
|---|---|---|---|
| Closed back on the same candle | 397 | 4.7% | 301 |
| Closed back on a later candle | 913 | 12.5% | 524 |
| No close back | 291 | 65.1% |
Three things follow, and these are counts of candles, not of trades.
- The fast one is the fragile one. A one-candle close back was shallower, and a later candle went past its wick about three times in four. After a slower close back it was under three times in five. So the neat wick in the usual picture is not the safer version.
- A run goes much further. The median was about two thirds of an average day past the level, against a tenth or so for the rest. That gap is the real split between the words.
- Part of this is built into the measure. Depth is taken up to the close back, or up to 17:00 where none came. A level that closed back at once had less time to travel, and a run had all day. Do not read those medians as how far each kind "wants" to go.
One candle, two names: USD/JPY and EUR/USD, 1 October 2026
The clearest way to see the split is one candle on two markets. At 03:15 New York on Thursday 1 October 2026 the dollar was rising against the yen and the euro together. No medium or high-impact release for those currencies came within the hour. That candle took a level on five of our eight markets.
USD/JPY: a sweep, then a grab. Asia left a 107-pip range, 157.326 to 158.400, which we draw as the Asian Box. The 03:15 candle reached 158.454, 5 pips over the top and the high of the day, and closed still over it at 158.427. The 03:30 candle closed back inside at 158.297. Later the other edge went. The 10:30 candle, half an hour after the ISM manufacturing figure, ran to 157.226, 10 pips under the box and the low of the day, and closed back inside on the same candle at 157.601. The day ended at 158.080, inside the box.
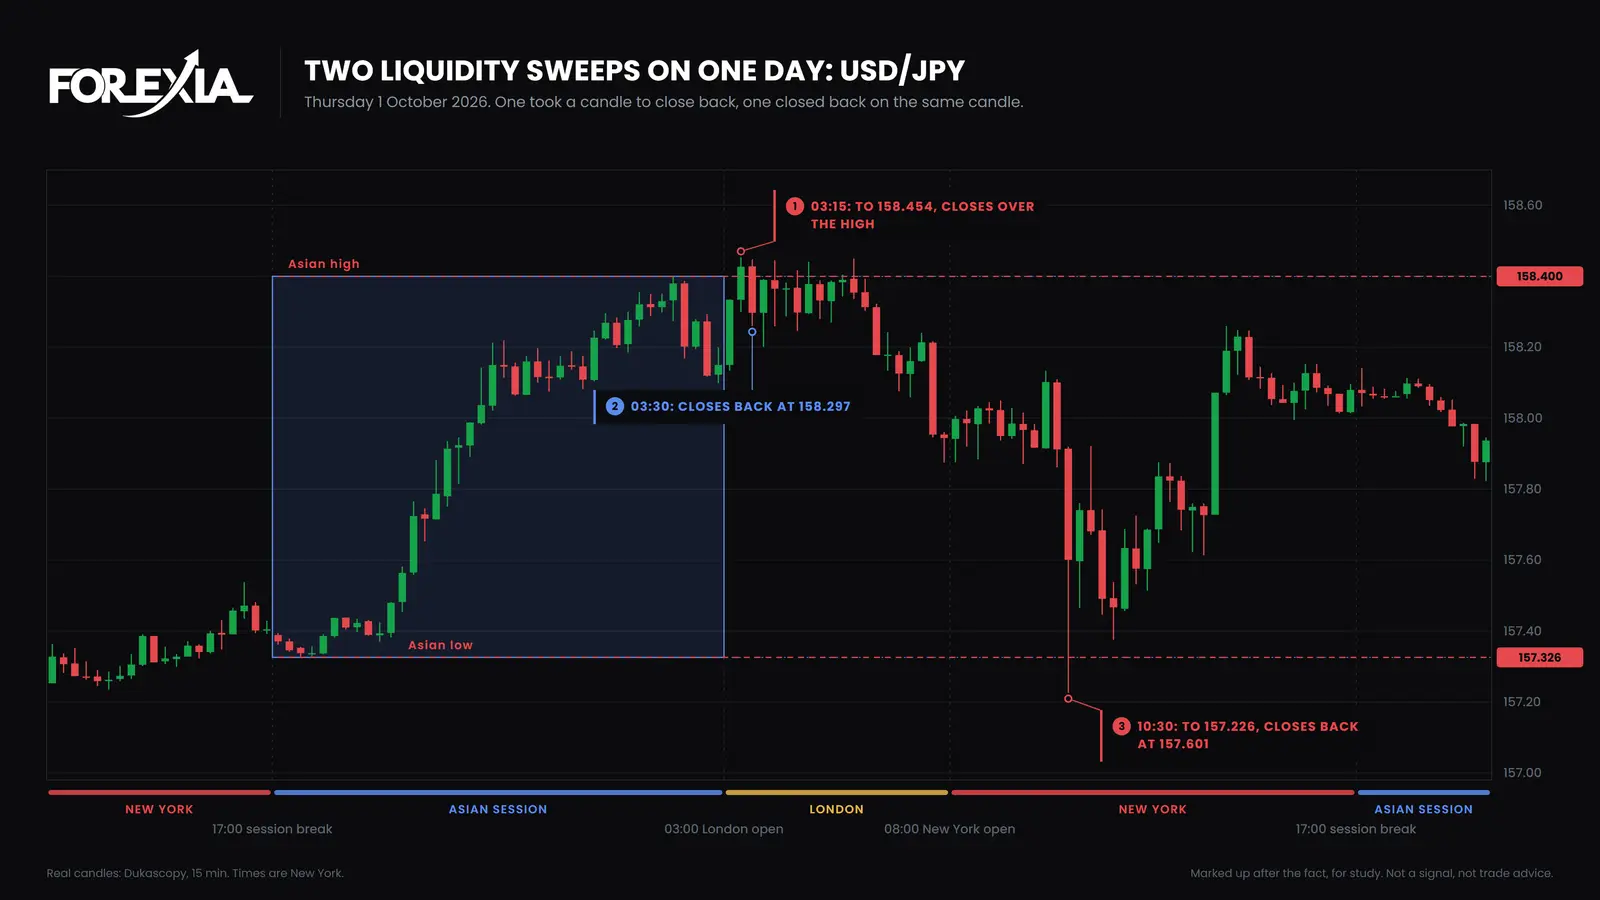
A writer who splits by speed calls one of those a sweep and the other a grab. One candle is all that separates them.
EUR/USD: a run. The same 03:15 candle went through the low of EUR/USD's 30-pip box at 1.13065. It reached 1.13040 and closed half a pip under, at 1.13060. It was a smaller trip than USD/JPY's. At 03:45 a wick reached 1.13118, 5 pips back over the line, and the candle closed under it at 1.13036. A wick back is not a close back. No candle closed over the level by 17:00. The low came at 13:15 at 1.12149, 92 pips past it, and the last candle closed at 1.12426, 64 pips under it.
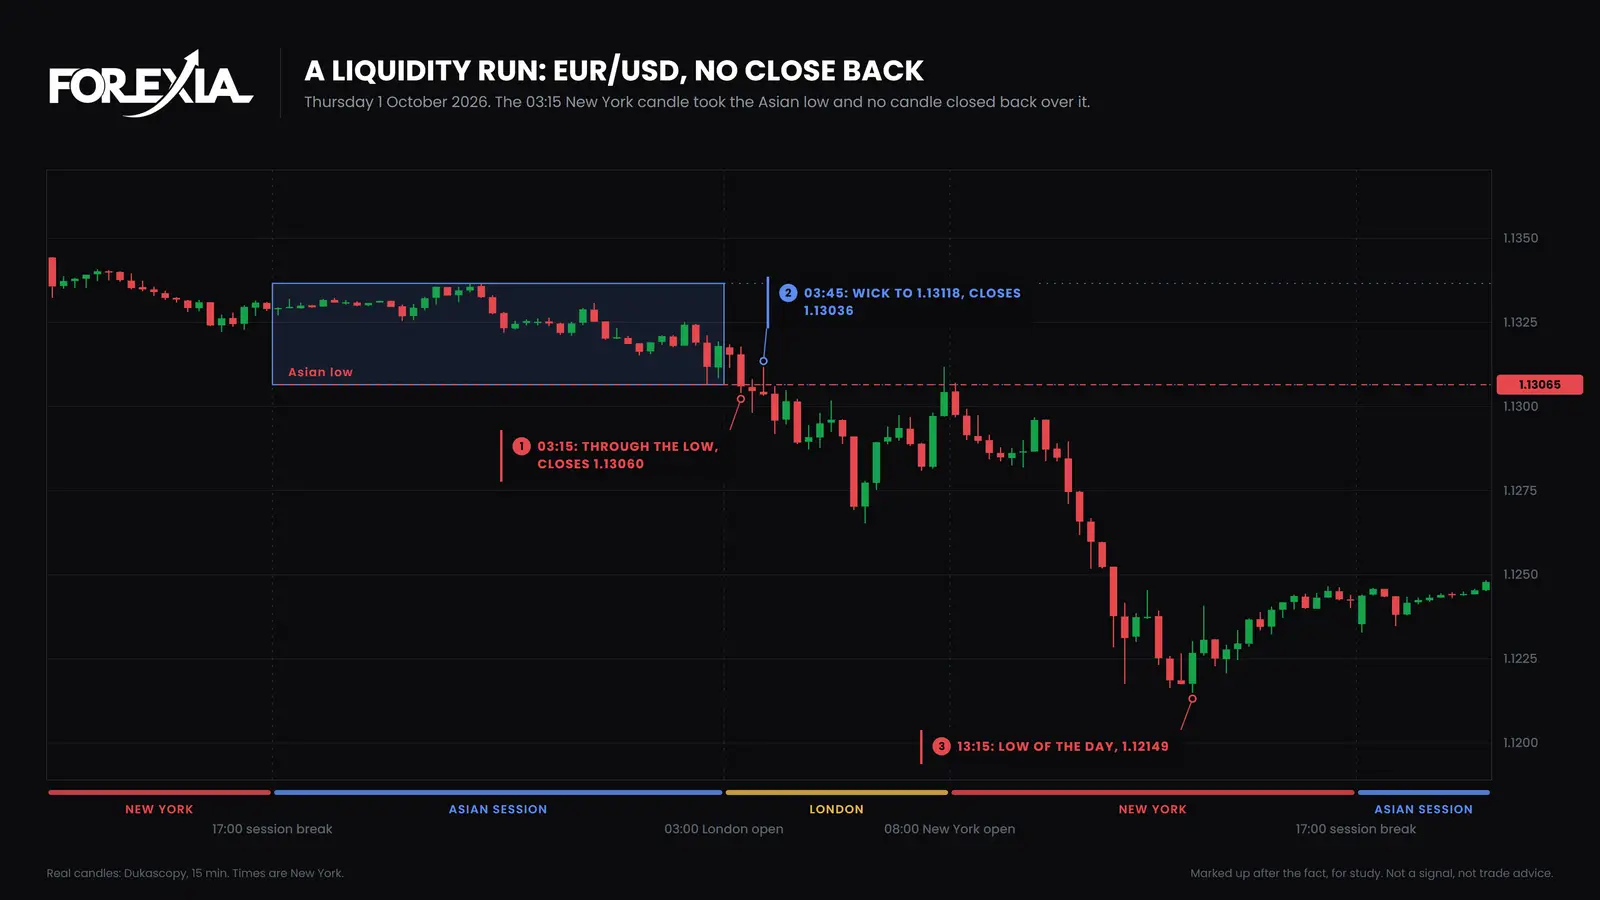
Of the five markets, USD/JPY, AUD/USD and NZD/USD closed back on the next candle, and EUR/USD and GBP/USD did not close back that day. NZD/USD closed exactly on its line at 0.56105 and then reached 0.55931, 17 pips past it, so a close back settled nothing there either.
A slow sweep and a run on one chart: USD/CHF, 5 June 2026
Friday 5 June 2026 has both words on one box, and it is a less tidy picture than the diagram. The box ran 15 pips, 0.78806 to 0.78954.
The low: a sweep that took its time. The 03:00 candle dipped a pip under the low, the 03:15 candle closed through it, and the 03:30 reached 0.78717, 9 pips under it and the low of the day. Thursday's low, 0.78677, sat 4 pips further down and was not reached. The first close back came on the 04:45 candle, half a pip over the line at 0.78811. The next candle closed back under it, and no candle closed over it again until the 08:00 candle, at 0.78819. By our table that is a sweep. Anyone who defines a sweep as a quick wick would not call it one.
The high: a run. Nonfarm Payrolls came at 08:30. That candle went from 0.78851 to 0.79165 and closed at 0.79134, 18 pips over the top of the box. No candle closed back under it. The high came at 14:00 at 0.79675, 72 pips past the level, and the last candle closed at 0.79566.
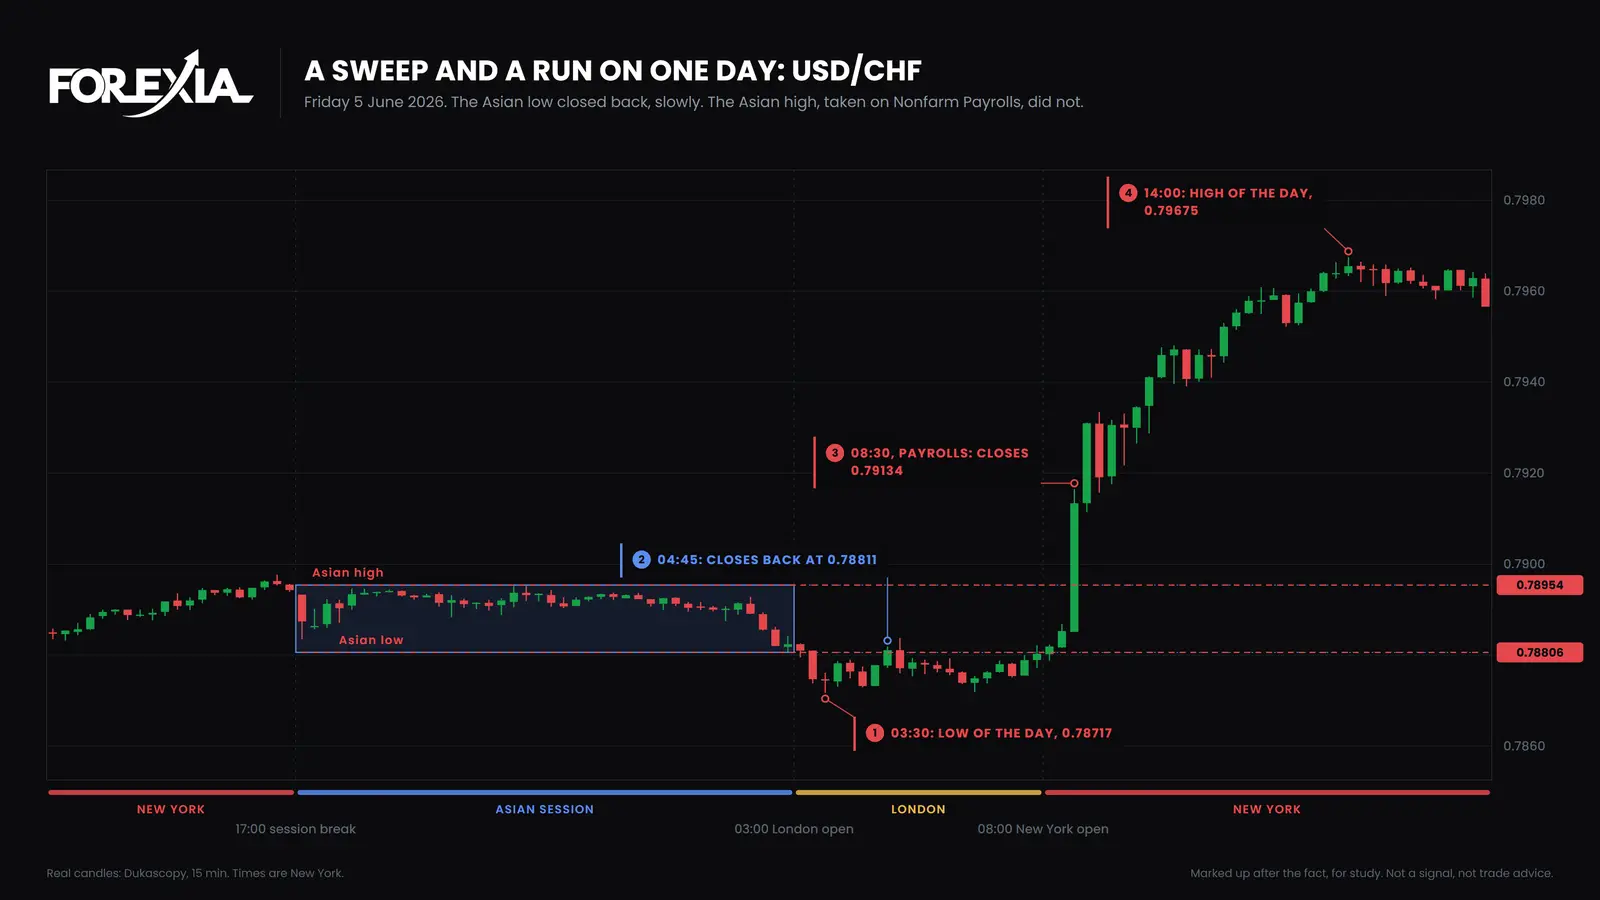
It is tempting to say the sweep caused the run. Payrolls came five hours after that low, and a sweep candle says nothing about a release still to come.
How do you tell a sweep from a run as it happens?
Mostly you cannot, because both words are earned by candles that have not printed yet. On 1 October the size of the first trip gave no clue: 5 pips on the one that turned, 2.5 on the one that ran. Nor did a wick back, since EUR/USD had one and never closed back.
The three seats show why the words get confused. Retail, in the first seat, saw the 03:15 break and read it as a good one, and on EUR/USD that reader was right. The market maker's seat is our read: the stops past the line are the orders someone needs, and when they are spent the push has nothing behind it, which fits USD/JPY and not EUR/USD. From the observer's seat, neither candle had a name at 03:15. USD/JPY got one when the 03:30 candle closed, and EUR/USD only at 17:00.
Both lines were on the chart before that candle. Marking them is what we call Liquidity Mapping. That tells you where the question will be asked. It does not answer it.
The name also depends on the clock. Our count stops at 17:00, so a run here means a run for that day, and we have no count of what those levels did after it. On a 1-minute chart a candle can close back while the 15-minute candle does not, so pick the chart before you pick the word.
What neither word can tell you
Neither name says who moved the price or whether anyone meant to, which is the question behind stop hunt vs liquidity sweep. Neither is a trade. Every day on this page was chosen afterwards, and a reversal seen afterwards is not a setup. When we ran the idea as a fixed rule against flagged hunts, it lost money after costs in every year, as our stop hunt page sets out.
Course 1 of ForexiaPRO, Reading the Map, teaches marking these levels from lesson 1.2.1. Course 3, Reverse Price Action, takes up the read in lesson 3.2.1.
Frequently asked questions
Is a liquidity grab the same as a liquidity sweep?
In practice, yes. Some writers keep grab for one fast candle and sweep for several, and others split them by depth, but those lines do not agree with each other. We treat them as one event: price goes through a level and a candle closes back inside it. Speed changes how far price went on the way, and not what the move is.
Is a liquidity run a continuation?
A run is price taking the orders past a level and then continuing to close beyond it. Whether it counts as continuation depends on how long you watch. Our count stops at 17:00 New York, so a level with no close back by then is a run for that day. We have no count of what those levels did on later days.
Does a liquidity sweep always reverse?
No. A sweep only means a candle closed back inside the level. In our count of 1,310 close backs on seven majors and gold from 6 April to 1 October 2026, a later candle traded past the wick again the same day after 825 of them. NZD/USD on 1 October 2026 closed exactly on its line and then went 17 pips past it.
Can you tell a sweep from a run on the first candle?
Not from the days we checked. On 1 October 2026 the same 03:15 New York candle took a level on five markets. USD/JPY went 5 pips past its line and closed back on the next candle. EUR/USD went 2.5 pips past its line and never closed back that day. Nothing on that candle said which was which.