
The Stop Hunt: Why Price Takes Your Stop First
What is a stop hunt? The short answer
A stop hunt is price driven into a cluster of stop-loss orders, past an obvious high or low, so that those stops fill the other side of someone's trade. Most traders call the same move a liquidity sweep. The candle shows what happened. It does not show who did it, and no chart can.
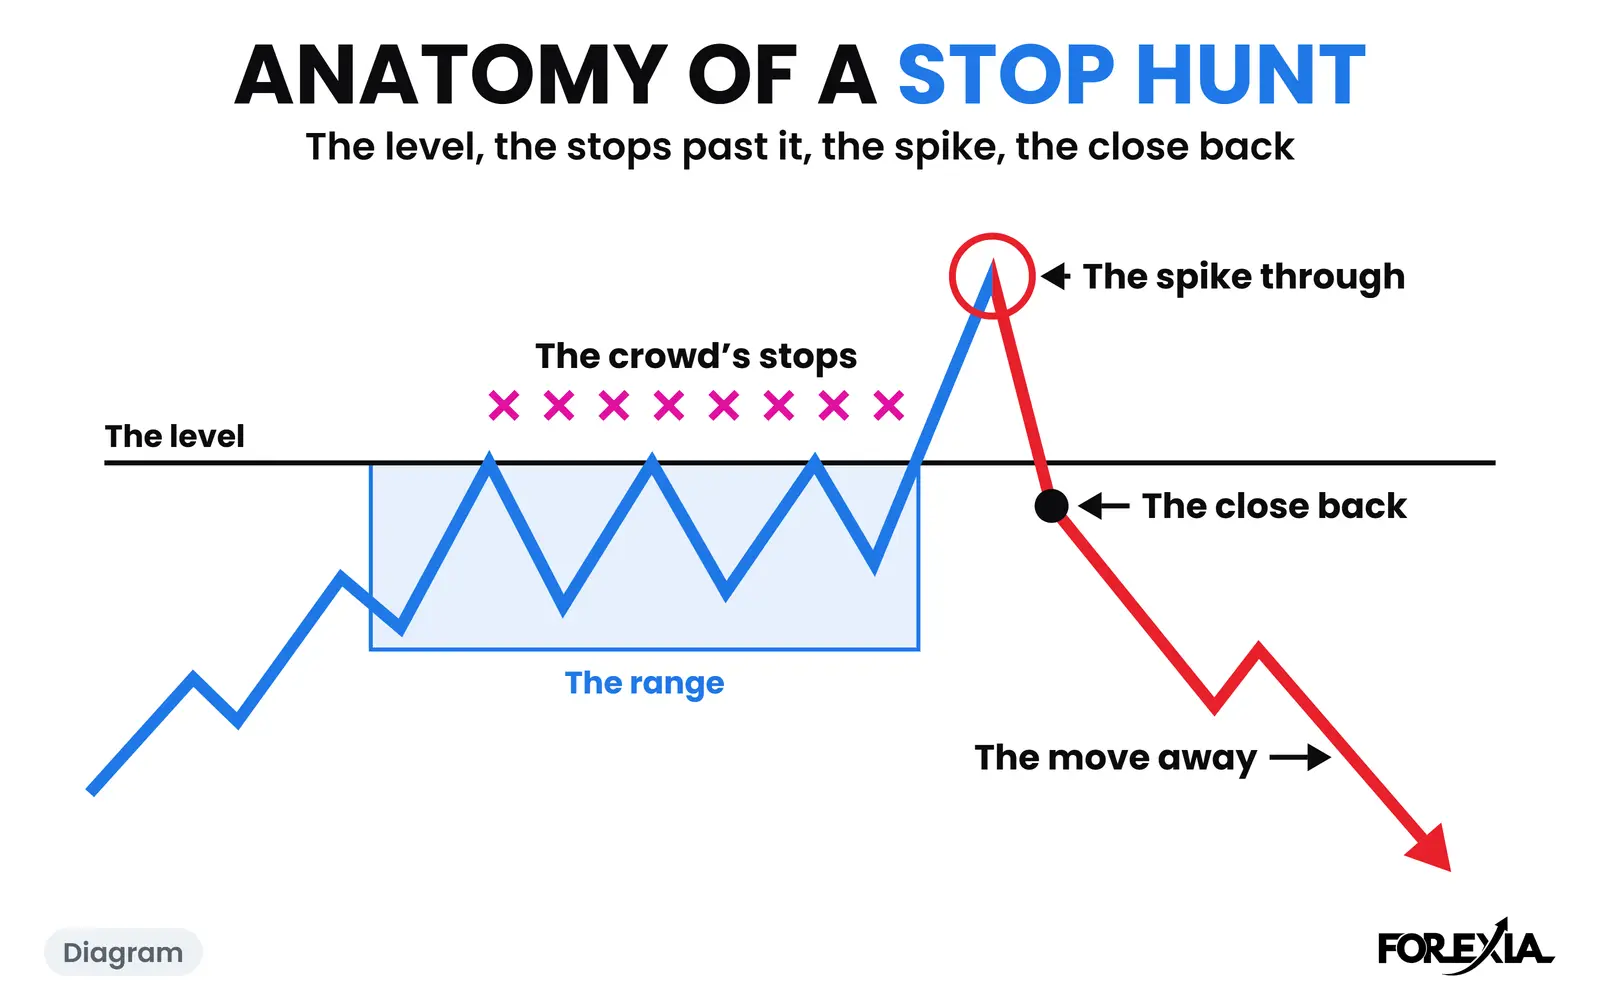
The stop hunt is the name we use. You will also see stop hunting, stop-loss hunting and stop run. It matters because a stop placed where the textbook says sits where everyone else's sits, and that makes a pool that price can reach in one candle.
This page shows the move on four dated days on our own charts, counts how often it happens on eight markets, separates what a broker can do from what the whole market does, and reports what happened when we ran the idea as a fixed rule. It did not make money.
Anatomy of a hunt: level, spike, close back, what came next
Every stop hunt has four parts, and only the last two tell you it was one.
- The level. An obvious high or low where stops are likely to rest: the edge of the Asian range (we draw it as the Asian box), the previous day's high or low, the top of a double top.
- The spike. Price runs through it fast. Stops fire, breakout traders join, and the candle looks like the start of a move.
- The close back. A candle closes back inside the level. That is our read that the sweep has happened and this was not a real break. Until the candle closes, it can still go further.
- What came next. Price either moves on from the line, or it does not. A close back can fail, as gold shows below.
The pound on Friday 11 September 2026 shows all four. The Asian session left a low at 1.34953, with Thursday's low at 1.34910 four pips under it: two sets of stops, one pool. US inflation came out at 08:30 New York. That candle ran 15 pips past the Asian low to 1.34801, 11 pips through Thursday's low, and closed at 1.35081, back above both. That was the stop hunt, a liquidity sweep of both sets of stops. The crowd sold the break; those stops funded the turn. One candle did the whole job, which is what we call The Reversal Candle. By 09:45, an hour and a quarter after the low, price was 54 pips higher, at 1.35345, through the whole Asian range.
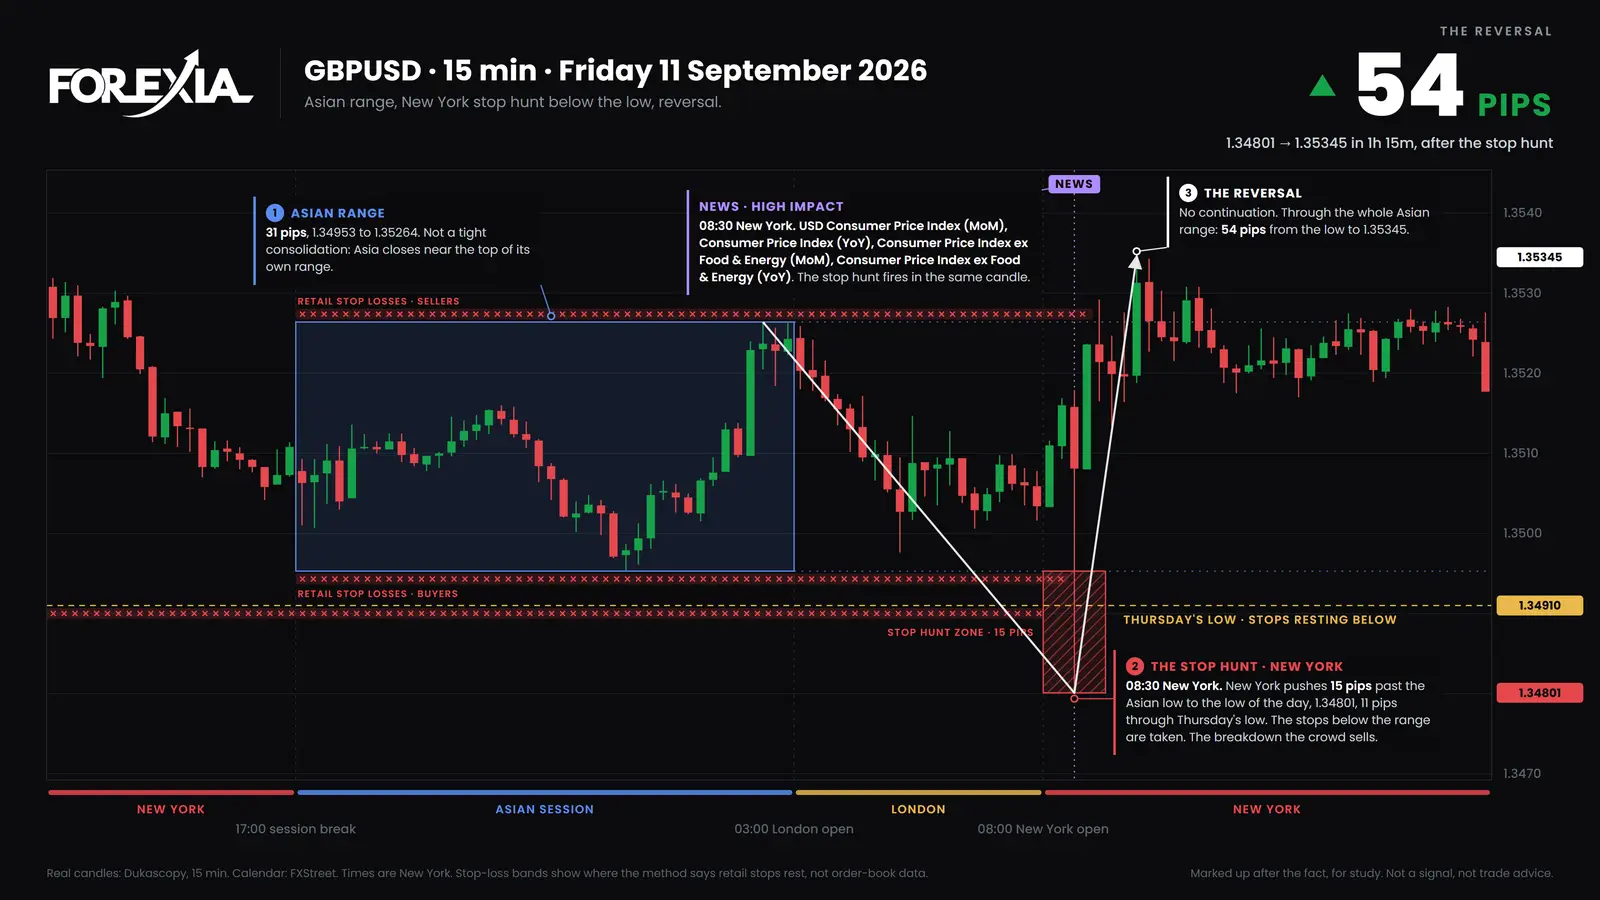
The red crosses on our charts mark where the method says stops rest. They are a reading of the structure, not order-book data: nobody outside a broker can see those orders.
If your complaint is "price hit my stop and then reversed", this is the move you are describing. We walk through one USD/CAD day in full on why price hits your stop loss and then reverses.
Why price goes there: the market maker's seat
Price goes to stops because stops are orders. A stop-loss is an instruction to trade at the market once a price prints. Under a low they are sell orders, and above a high they are buy orders. For anyone who has to buy in size, a pile of sell orders under a low is somewhere to fill without chasing the price up.
Nobody needs to know your stop for this to work. The pattern tells them where it is, because the textbook told you. Stops pile up above highs and below lows and around round numbers because everyone was taught the same places, and marking those places on a chart is what we call Liquidity Mapping.
We read it from the three seats:
- Retail sees a pattern and a break. The textbook says buy the breakout, or sell the double top with a stop just over it.
- The market maker sees where the orders are. Our read is that market makers build the chart: a quiet range gives the crowd its levels, and the hunt collects the stops behind them.
- The observer reads both from outside and waits for the close back before calling anything a hunt.
That is why we distrust a perfect level. The Third Tap is the clean third touch that makes a level look safe, and The Trap is its indicator version: the averages cross late, pull the crowd in, then cross back onto their stops. A scheduled release adds to it, because everyone knows the minute and orders gather around it. We call that News-Induced Liquidity.
So who does it? Pages on this search name banks, hedge funds, market makers and high-frequency firms. We cannot tell you which, and neither can they. A sweep can also happen with no hunter at all: a large order with nothing to do with your level, a thin market around a release, or a chain of stops feeding itself. Those candles look the same, which is why we write "we read this as" and never "they did this".
Three real days, marked up: one that turned, one that kept going, one that was just a break
These are 15-minute Dukascopy candles in New York time, and your broker's chart may differ by a pip or so. Each day was marked up after the fact, for study. None is a signal or trade advice.
A hunt that turned: USD/CHF, Wednesday 15 July 2026
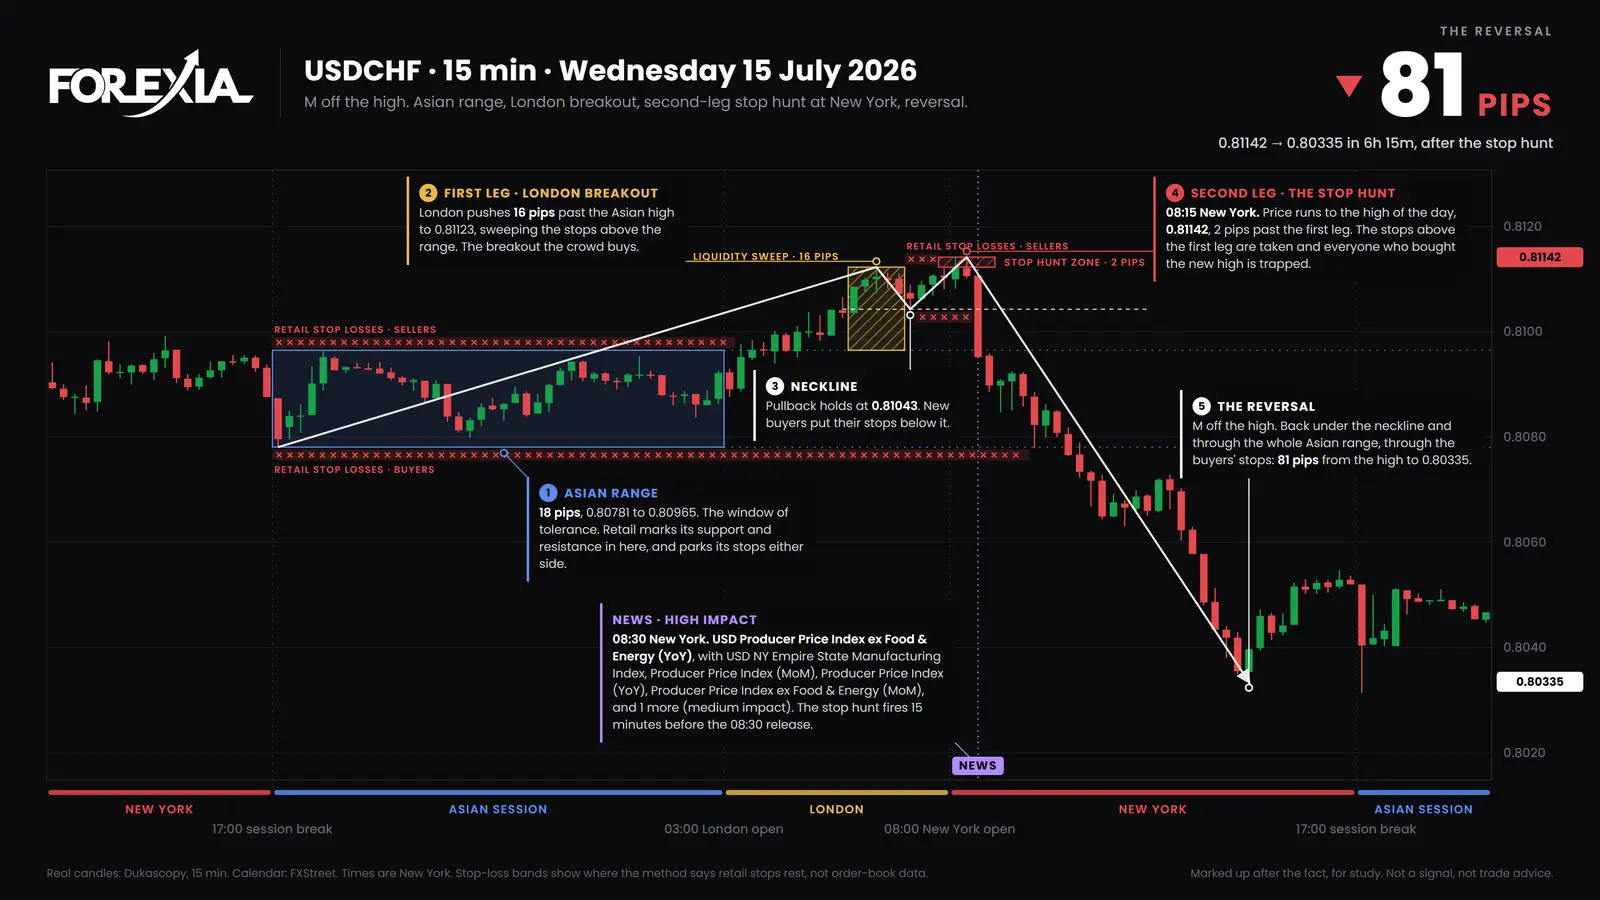
London broke the high of an 18-pip Asian range by 16 pips, to 0.81123 at 06:15. That is the breakout the crowd buys, and those buyers put their stops under the pullback, which held at 0.81043. Then New York opened and price ran to 0.81142 by 08:15, 2 pips past the first high. That was the stop hunt, a liquidity sweep of the stops over the first high, and the Second Leg Climax: it trapped whoever bought the new high.
The 08:15 candle closed at 0.81106, back under the first high. US producer prices came out at 08:30, and that candle closed at 0.80952, back under the Asian high. By 14:30 price was 81 pips lower, at 0.80335.
Two pips was all the hunt needed. This shape is the M, one half of M & W Reversals, and it is why we read a double top as a hunt of its first peak.
A hunt that kept going: gold, Thursday 24 September 2026
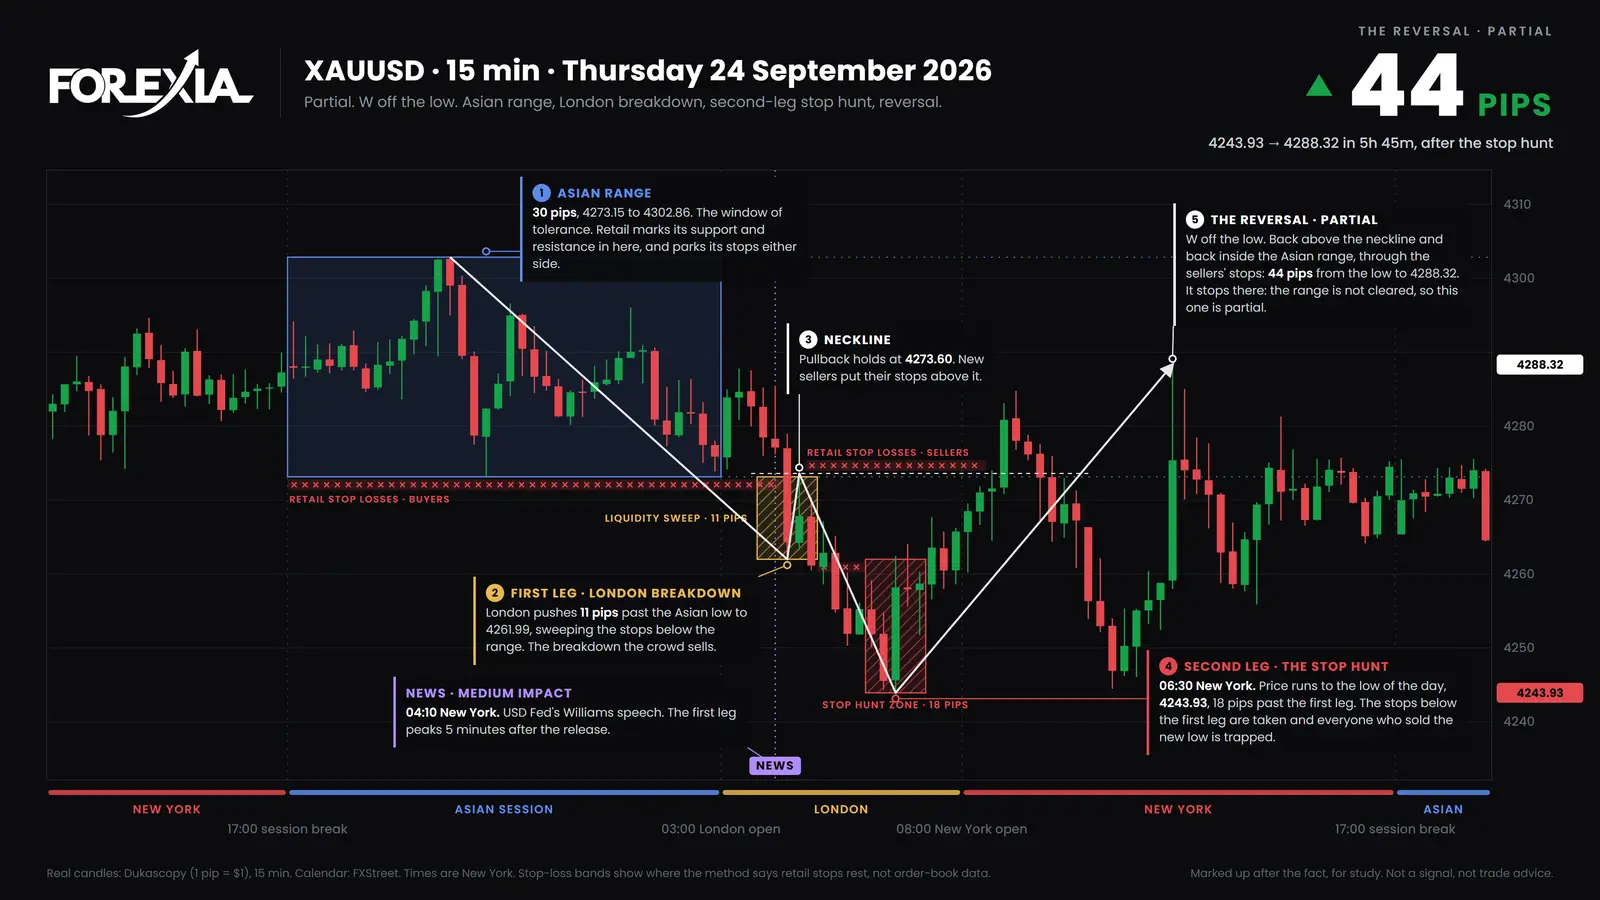
Gold shows why a close back is a read and not a promise. On gold we count $1 as 1 pip. London broke the low of a 30-pip Asian range at 04:15, by 11 pips, to 4261.99, and price pulled back to 4273.60. At 05:00 a candle ran to 4258.57 and closed at 4262.88, less than a dollar back over that first low. It looked as if the sweep was done.
The next candle closed at 4255.20. By 06:30 price had printed 4243.93, 18 pips past the first low and the low of the week. Anyone who read the first close back as the end was early, and their stops fed the next leg. Price then rallied 44 pips to 4288.32 by 12:15, and finished the day near 4274.
Gold's own hunts at the New York open have a page of their own.
Just a break: EUR/USD, Wednesday 29 July 2026
EUR/USD hunted one side and broke the other on the same day. At 08:15 it pushed 8 pips under the Asian low, to 1.13744, and turned. That part was a hunt.
The Fed's decision came at 14:00. That candle ran through the Asian high and 25 pips past Tuesday's high of 1.14052, to 1.14306, and closed at 1.14276, 22 pips above the level. Anyone expecting a hunt of Tuesday's high had a perfect-looking spike to sell, and the close back never came. The press conference candle at 14:30 dipped to 1.14067, 1.5 pips above the level, and closed at 1.14353. No candle closed under Tuesday's high for the rest of the day. The day's high was 1.14709, 66 pips over it, and the week went on to 1.15471 on Friday.
The buyers of the break were right. Plenty of breaks fail, for reasons that come down to the orders behind them. This one did not.
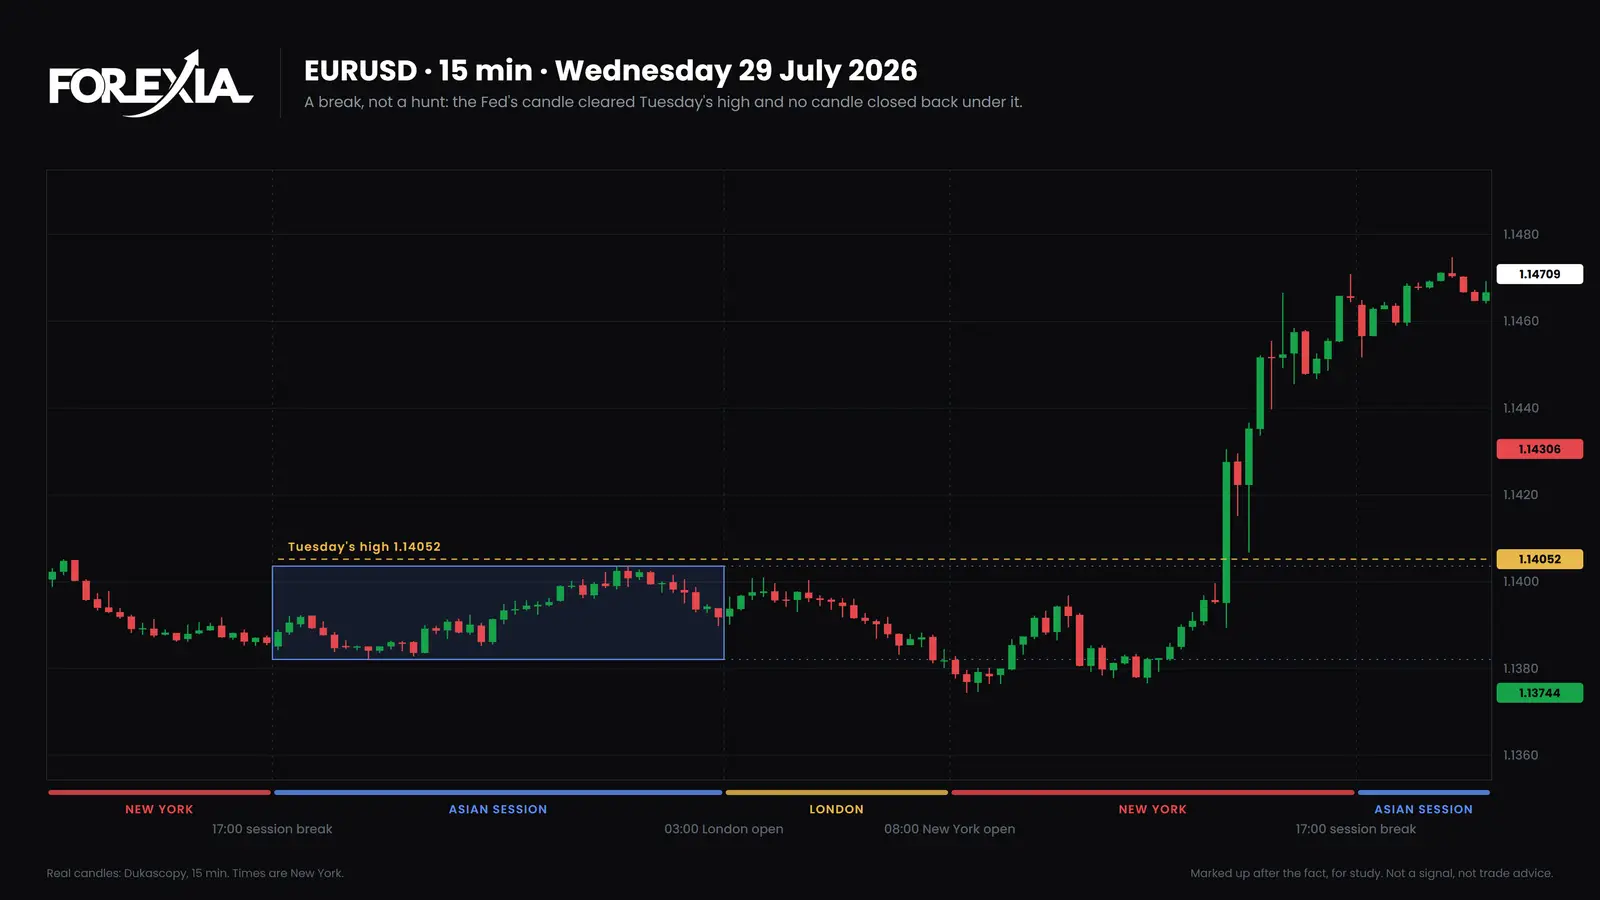
Size did not separate these days. The pound's inflation candle was 38 pips from top to bottom, and the euro's Fed candle was 41. One closed back and the other did not. More days are in our forex chart markups, every week.
How often does a stop hunt happen, and how far does it run?
Roughly every second break of the Asian range turns out to be a stop hunt, about three a week on each market, and the median one runs about a fifth of that market's average daily range past the range. You only know which break it was afterwards.
These counts cover seven dollar majors and gold, on Dukascopy candles from 4 January 2021 to 1 October 2026 (1,488 trading days). A hunt here means the day's high or low printed in London or New York beyond the Asian range, then price reversed at least 0.4 of the average daily range, back inside the range. That definition needs the day to be over. A break that stayed is one that did not reverse like that. Pips are past the Asian range, and on gold $1 counts as 1 pip. This is not the 82% of box edges that close back the same day: that count takes any edge traded past by 3% of the daily range and any close back by 17:00, over six months of 2026, whether or not the day then turned, while a hunt here has to print the day's extreme and reverse 0.4 of the daily range.
| Market | Breaks that became a hunt | Hunts a week | Median hunt, pips | Share of the daily range | Median break that stayed, pips | Hunts in the 08:00 New York hour | Hunts on a high-impact release |
|---|---|---|---|---|---|---|---|
| EUR/USD | 49% | 3.2 | 16 | 23% | 39 | 18% | 20% |
| GBP/USD | 50% | 3.3 | 21 | 23% | 49 | 16% | 15% |
| USD/JPY | 41% | 2.3 | 21 | 21% | 43 | 22% | 18% |
| USD/CHF | 50% | 3.4 | 14 | 22% | 33 | 18% | 15% |
| AUD/USD | 44% | 2.5 | 13 | 22% | 26 | 20% | 17% |
| USD/CAD | 51% | 3.4 | 18 | 23% | 39 | 18% | 16% |
| NZD/USD | 46% | 2.6 | 13 | 20% | 25 | 20% | 18% |
| Gold | 47% | 2.9 | 7 | 23% | 16 | 22% | 16% |
The 08:00 New York hour was the busiest on all eight. "On a high-impact release" means within 15 minutes of one for that market's currencies. Four things a table cannot show:
- The deep end. One hunt in ten ran past 49% to 55% of the daily range, depending on the market.
- Breaks that stayed were rarely on a release. Only 3% to 8% of them printed within 15 minutes of a high-impact one.
- No depth marks the end. Once price is past the range, the chance it stops within another 5% of the daily range is 8% to 18%, whether it is 5% past or 75% past. The further it goes, the less likely the day ends as a hunt: on EUR/USD, 48% at 5% of the daily range, 39% at 20%, 19% at 50%.
- In real time. When a program flagged a hunt as it happened, the extreme behind it held 37% to 43% of the time.
We have no count for crypto or stocks, where the same idea is used.
Stop hunt, fakeout, false breakout: one event, three names
They are one event named from different seats, and one test separates them all from a real break: whether a candle closes back inside the level.
- Stop hunt names it from the market maker's seat: the move went to the stops.
- Liquidity sweep or liquidity grab names what it took: the resting orders. The comparison of stop hunt vs liquidity sweep goes through it, and some writers split sweep, grab and run by whether price reverses.
- Fakeout and false breakout name it from the breakout trader's seat: the break they bought failed. Our page on stop hunt vs fakeout shows days of each.
- Bull trap and bear trap name who got caught. We show one each way in the bull trap and its mirror.
All of these names are given afterwards. In the moment there is only a candle going through a level, and with no close back it is a breakout, whatever anyone called it at the time.
Is forex rigged? Broker execution versus market-wide behaviour
Forex has been manipulated in documented cases, but no chart can prove that your stop was hunted. "Rigged" is really two questions: what your broker does with your order, and what large players do to the market's price.
Your broker. Your stop fires on your broker's price, and that price can differ from the market's. Your chart usually draws the bid, while a short position's stop is a buy that fills at the ask. So a stop can fire at a price your chart never printed, when the spread widens around a release or at the 17:00 New York rollover. Our own data feed shows that rollover spike on its bid candles. Some retail brokers also take the other side of client trades (a dealing desk, or B-book), which is a real conflict of interest, and dealing desk, ECN and market maker are not the same thing for your stop. A broker that makes a market for you is also not the market maker of the second seat. US rules for retail forex dealers say slippage settings must apply uniformly whichever way the market moved.
You can check this yourself. Compare the candle that took your stop with a second feed at the same minute, and ask for your fill record. If only your broker printed that price, it is an execution question for them. Our page on whether brokers hunt stops shows how to check yours.
The market. Regulators have put some of this in writing. In November 2014 the UK's Financial Conduct Authority fined five banks £1.1 billion for failings in their G10 spot FX trading, and said traders "attempted to manipulate fix rates and trigger client 'stop loss' orders". The same day the CFTC ordered five banks to pay over $1.4 billion for attempted manipulation of FX benchmark rates. So traders going after stops is not a forum legend. It is also a finding about particular traders in particular years, not a description of today's candle.
What can be shown:
- Traders at banks attempted to trigger client stop-loss orders, on a regulator's own account of that period.
- Price regularly runs past obvious levels and comes back. The count above measures it.
- Your broker's price at the moment your stop fired, which you can compare with another feed.
What cannot be shown:
- That any one candle was a hunt. The chart shows what happened, not who or why.
- That hunts happen more often than chance would produce. Prices that wander also cross levels and come back, and we have not separated the two. Our test found no lean after the average hunt, which is what chance would look like too.
- That anyone targeted you. Your stop is one of a crowd, and a move through a level does not need to know it is there.
We hold our read and accept that a chart cannot prove it. Our page on whether forex is rigged takes this further.
Stop too tight, or hunted? A check you can run
Three questions on your last losing trade sort out most of it.
- Did another feed print that price? If not, it is the spread or your broker's execution, and not a hunt.
- Did the candle close back past the level? If not, price simply went there. The read was wrong, or it was a real break, and the stop did its job.
- Where did the stop sit? Just behind an obvious level, it was in the pool, and we would call that hunted. With no level near and closer than the day's normal swing, it was too tight. For scale, a median hunt runs about a fifth of the daily range past the Asian range.
The full check for your last loss takes each question in turn. If this keeps happening, start with why your stop loss always gets hit.
Can you avoid a stop hunt?
You cannot stop price going to a level, but you can stop sitting exactly where the pattern puts everyone. That is the useful part of the usual advice: less obvious levels, and a position sized so that a stop further away risks the same money.
The rest of the advice needs a caveat. The standard advice is a wider stop, often sized with average true range. In our test, widening the stop about eightfold took the loss from -0.16R a trade to -0.08R, but only because costs shrink relative to the risk, and it still lost. Smaller stops made every version worse. A mental stop keeps your order off your broker's books, which only matters if your broker is the worry, and it leaves you to act inside the fastest candle of the day. A stop-limit order can leave you unfilled in that same candle.
Our page on how to avoid getting stop hunted covers placement as a read.
What our own test says: the rule did not make money
We ran the setup as a fixed rule, with no judgment, and it lost money after costs. A program flagged each hunt as it happened, using only the candles printed so far, and traded against it the same way each time.
The sample. Seven dollar majors and gold, on 5-minute Dukascopy candles with real bid and ask, about 430,000 per market, from 3 January 2021 to 2 October 2026, with 6,282 high-impact releases from FXStreet's calendar. Costs were the real spread on every bar plus 0.7 to 0.8 pips a round trip for commission and slippage ($0.15 on gold).
The result. Every year from 2021 to 2026 lost, between -0.10R and -0.23R a trade on about 2,200 trades a year. R is the amount risked on one trade, so -0.25R means losing a quarter of your risk on average. On the six months opened only once, at the end (5 April to 2 October 2026), it took 1,981 trades at -0.25R a trade. A period held back for checking, 2015 to 2020, agrees.
Why. The hunt alone has no lean. After 18,884 flagged hunts from February 2021 to December 2024, price had moved -0.2% of the daily range the trade's way after one hour and -0.5% by 17:00. That is zero. With no costs at all the rule made -0.03R a trade, the spread took it to -0.10R and commission to -0.16R. Every slice lost after costs: M or W against a plain hunt, London against New York, each weekday, each market, news or none.
Why charts flatter it. We only mark up a day after price has reversed: the extreme held and price came back at least 0.4 of the daily range. So marked-up days look far better than the days never marked up, which lost heavily: -0.57R a trade on 1,634 trades in those same six months. Nobody can tell which day they are in at the time. Every day on this page was picked after the fact, and so is every example on every other page.
Where the stops went. In one fixed version, on 8,931 trades from 2021 to 2024, only one stop-out in three was the kind everybody remembers, where price turned later without you, and nearly half were real breakouts.
What it does not prove.
- It does not say a person reading the chart loses, or wins. It only sets the bar: to break even, picking trades by reading the chart would need to find nearly twice as many good trades as the rule did. Nothing we tested in the candles or the calendar closed that gap. If a trader can, a log of every setup taken or skipped will show it.
- It does not say hunts are real or imaginary. The program reads candles and the calendar and cannot see order flow.
- It uses one data source, and another broker's spreads will differ. Fills during a release have the real spread but no extra slippage, so real fills in those minutes are worse.
- It is past prices, and it is one rule we wrote.
One input from outside the candles, the COT report's positioning, did show an effect with the same sign in every period we tested. That is promising and not proven.
Course 3 of ForexiaPRO, Reverse Price Action, teaches this read step by step, from lesson 3.2.1, The Stop Hunt, to lesson 3.3.4, the hunt that keeps going.
How it works
- Stop Hunt vs Liquidity Sweep: Are They the Same Thing?
Stop hunt vs liquidity sweep: the same candle, two different claims. A test of both words on two real days, and what the FX code of conduct says about it.
- Why Does Price Hit Your Stop Loss and Then Reverse? The Stop Hunt on Two Real Days
Why does price hit your stop loss and then reverse? The market maker's seat on two real days, USD/CAD and GBP/USD, and what the evidence cannot show.
Questions
- Is Forex Rigged Against Retail Traders? Proof, Not Opinion
Is forex rigged? Regulators' findings at source, what a broker can do against what the market does, a check on your own fills, and three real dated days.
- Why Your Stop Loss Always Gets Hit: Placement, Timing, Size or a Hunt
Why does your stop loss always get hit? Check your last five losses for placement, timing, size or a hunt, with three real days on our own charts.
The words
- The Close Back: How a Liquidity Sweep Is Confirmed, Candle by Candle
The Close Back is the spike that closes back inside the level. Liquidity sweep confirmation on USD/CAD, 12 August 2026, and a count of 1,601 levels.
- The Reversal Candle: One Huge Candle Through the Stops, Not a Signal
The Reversal Candle is one huge candle through the stops, just after the crowd gets in. Not a signal: gold on US CPI, 11 September 2026, $70 in one candle.
- The Stop Hunt: What It Means, and How It Relates to a Liquidity Sweep
The Stop Hunt is price driven into clustered stops, commonly called a liquidity sweep. One real day, USD/JPY on 14 July 2026, with every price.
- The Third Tap: Why a Double Top's Third Touch Is Where the Trap Is Set
The Third Tap is the perfect third touch of a level, where the trap is set. Double top and double bottom stops, read on EUR/USD, 28 August 2026.
- The Trap: Why the Crowd's Averages Cross Late, and the Best Indicator for Scalping
The Trap is the indicator trap: the averages cross late and pull the crowd in. USD/CHF on 30 July 2026, and a count of 1,132 crosses on eight markets.
Frequently asked questions
What is a stop hunt in forex?
A stop hunt is price driven into a cluster of stop-loss orders past an obvious high or low, so that those stops fill the other side of someone's trade. It is commonly called a liquidity sweep. The usual sign is a fast run through the level followed by a candle that closes back inside it.
Why does my stop loss always get hit and then price reverses?
Usually because the stop sits where the textbook puts it, behind an obvious high or low, along with everyone else's. Price runs there, the stops fire, and the run ends. It is not always a reversal you missed, though. In our test ledger of 8,931 trades, one stop-out in three was followed by that later turn, and nearly half were real breakouts.
Is forex rigged against retail traders?
Parts of it have been shown and most of it cannot be. A UK regulator fined five banks in 2014 and said traders attempted to manipulate fix rates and trigger client stop-loss orders. A broker's price can also differ from the market's. But no chart can prove that a given candle was a hunt, or that anyone targeted you.
Do forex brokers hunt stop losses?
A retail broker cannot move the whole market, but your stop fires on its price, and that price can differ through the spread, the rollover or its own feed. Some brokers also take the other side of client trades, which is a real conflict of interest. To check, compare the candle that took you with a second feed and ask for your fill record.
How do you avoid being stop hunted?
You cannot stop price going to a level, but you can avoid sitting exactly where a pattern puts everyone's stop. Know where the obvious levels are, and size the trade so that a stop further away risks the same money. A wider stop alone is no cure: in our test it lost less only because costs shrank relative to the risk.
Is a stop hunt the same as a liquidity sweep?
In practice, yes. It is one move named from two sides: stop hunt says where price went, liquidity sweep says what it took. Some writers keep sweep for a move that reverses and run for one that continues. Either way, the test is whether a candle closes back inside the level.
How do I know if my stop was too tight or hunted?
Ask three things. Did a second feed print that price? If not, it is an execution question. Did the candle close back past the level? If not, price simply went there and the stop did its job. Did the stop sit just behind an obvious level? Then it was in the pool. If no level was near and it sat inside the day's normal swing, it was too tight.
Is stop hunting illegal?
It depends on who did what, and this is not legal advice. A large order that runs through a level because it needs liquidity is ordinary trading. Moving a price on purpose to trigger clients' stops is treated as misconduct when a regulator can show it: the UK's 2014 fines were for failing to control practices that included attempts to do that. A chart alone cannot show intent.
Who does stop hunting?
Nobody outside can say for a given candle. The usual answers are banks, large funds, market makers and high-frequency firms. Our read is that market makers build the chart, and it is a read. A sweep can also happen with no hunter: a large order with nothing to do with the level, a thin market around a release, or a chain of stops feeding itself.
How do you spot a stop hunt?
With confidence, only afterwards. Mark the obvious level, watch for a fast run through it, and see whether a candle closes back inside it. In our count 41% to 51% of breaks of the Asian range, depending on the market, turned out to be hunts, so a spike alone tells you little, and a close back can still fail.
Is there an indicator that shows stop hunts?
Indicators can mark likely stop areas and flag spikes, but none can see the stops themselves. Our own scanner caught 230 of 245 textbook setups as they happened, and it also fired on about five times as many days that never became one. As an alert for a person to judge it is useful. As an order, it lost money.
Can you make money trading stop hunts?
Our own fixed rule did not. On seven dollar majors and gold from 2021 to 2026, every year lost after costs, between -0.10R and -0.23R a trade. That does not prove a trader reading the chart cannot do better, or that one can. It does mean that spotting the setup is not enough on its own.
The latest chart markups
- Forex Chart Markups: Weekly Stop Hunt & Reversal Archive
Forex chart markups, week by week: stop hunts, M and W formations and midweek reversals on the majors and gold, drawn on real candles.
- Reverse Price Action: How to Read a Forex Chart Markup
Reverse price action reads a chart from the side of the crowd: where retail orders and stop losses sit, and how price collects them. A visual guide.
- EURUSD Stop Hunt: Forex Chart Markups, 28 September 2026
An EURUSD stop hunt through Tuesday's high on US PCE data completed an M formation and fell 165 pips. Chart markups, 28 September 2026.