Is a Double Top a Stop Hunt? What the Second High Actually Took
Dylan Forexia8 min read
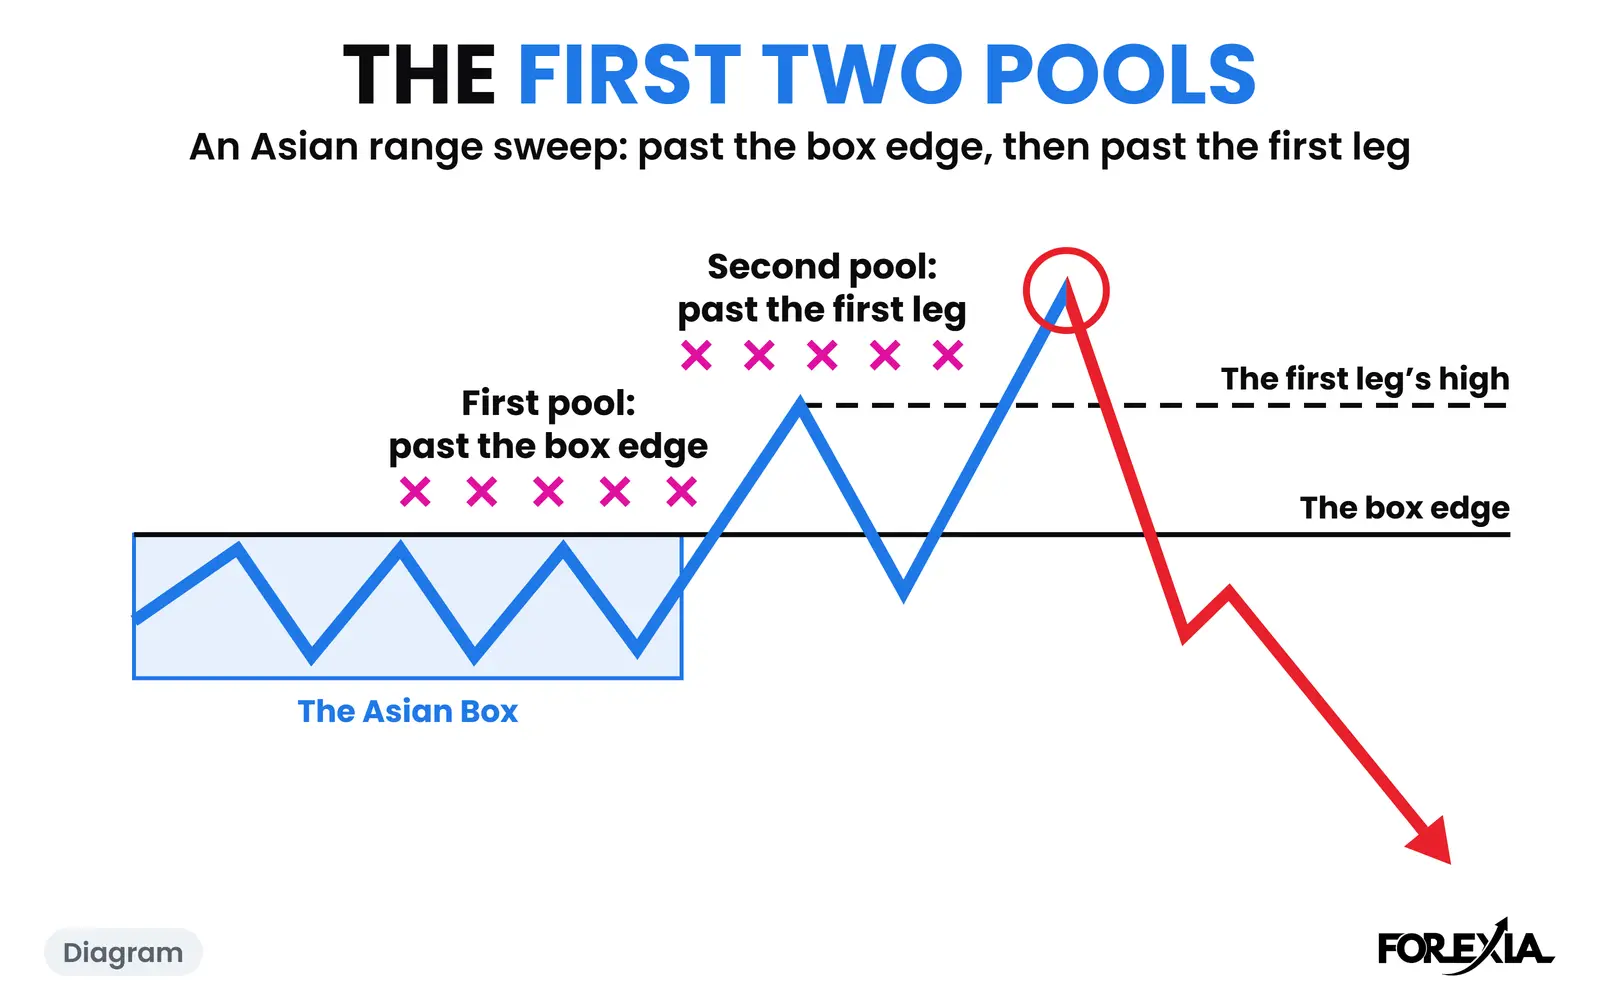
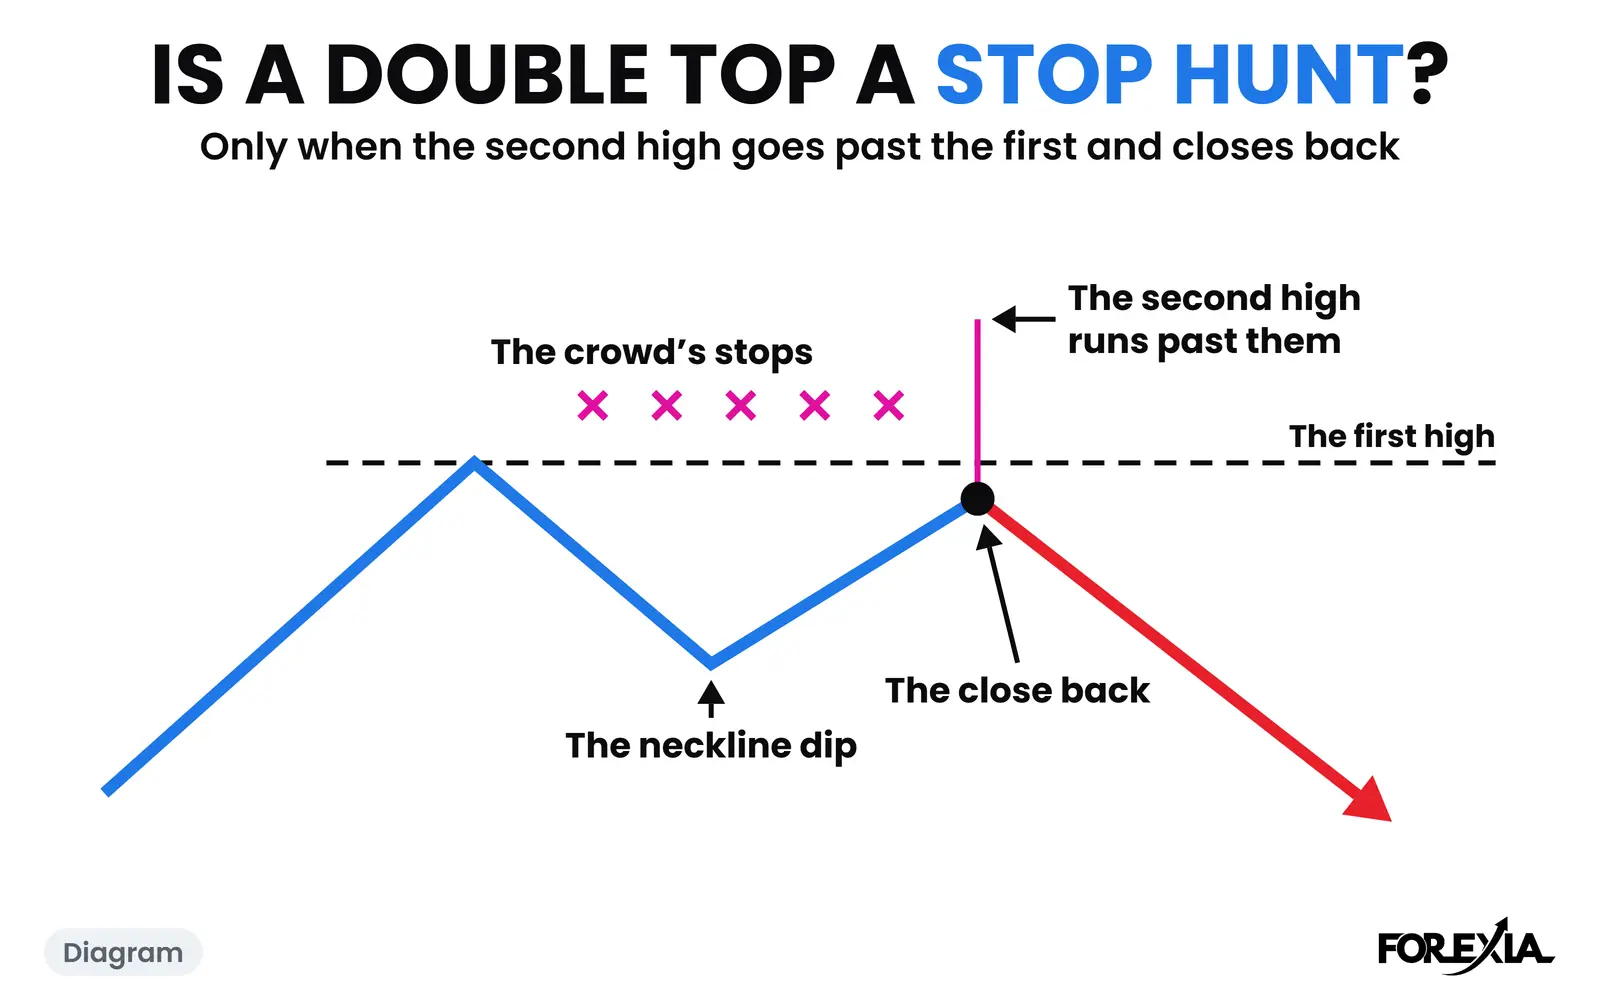
A double top is a stop hunt only when the second high runs past the first and closes back under it. We read that as a hunt of the stops over the first high. It is not true of every double top: in our count, in about half of those that gave the book's signal the second high stopped short of the first.
This page is about the second high. Why the pattern so often fails is on why double tops and double bottoms fail. The wider subject is on our price action page. Times are New York, candles are 15-minute Dukascopy and named by when they open, and your broker's chart may differ by a pip or so.
What is a double top?
A double top is two highs at about the same price with a dip between them, and the low of that dip is the neckline. The book says sell on a close under the neckline, put the stop above the peaks, and aim for the pattern's height under the neckline. A double bottom is the mirror.
Our own word is the M, one half of M & W Reversals. It asks for more than the shape. On NZD/USD's day below, the first high came out of the Asian range as London opened and the second on New York's data. The book's double top can form anywhere.
Is a double top a stop hunt of the first high?
Sometimes, and it depends on what the second high does. The first high leaves two kinds of buy order just above it. Anyone who sold it was told to put a stop there, and a stop on a sell is a buy. Breakout traders also leave orders to buy a new high. A New York Fed study of one bank's order book found stop-loss buy orders clustered just above round numbers. That data is from 1999 and 2000, and it covers round numbers rather than this pattern.
Anyone who needs to sell in size needs buyers. So a run just past the first high finds them, and we read that as the stop hunt, which most traders call a liquidity sweep. That is the double top's liquidity: the shape tells everyone where the orders are. Who sends price there, and whether anyone does, cannot be seen from a chart.
Now the count. On seven dollar majors and gold, from 6 April to 1 October 2026, we took every shape with two peaks 2 to 12 hours apart in one trading day, within a tenth of the average daily range of each other, with a dip of at least a quarter of that range between them. That gave 983 shapes, double bottoms included, mirrored. Of those, 303 closed through the neckline by 17:00 New York that day, before trading past the higher peak.
- In 147 of the 303, the second peak went past the first, by any amount.
- In 156 of the 303, it stopped short.
"Past" here has one meaning: the second peak's 15-minute high was above the first peak's, by any amount, whether or not that candle closed back. The count does not separate the ones that closed back, so the 147 is not a count of hunts. In about half of these shapes, then, the second high took nothing past the first. Calling every double top a stop hunt gets those wrong. Here are three days, one of each kind.
What does a hunt of the first high look like?
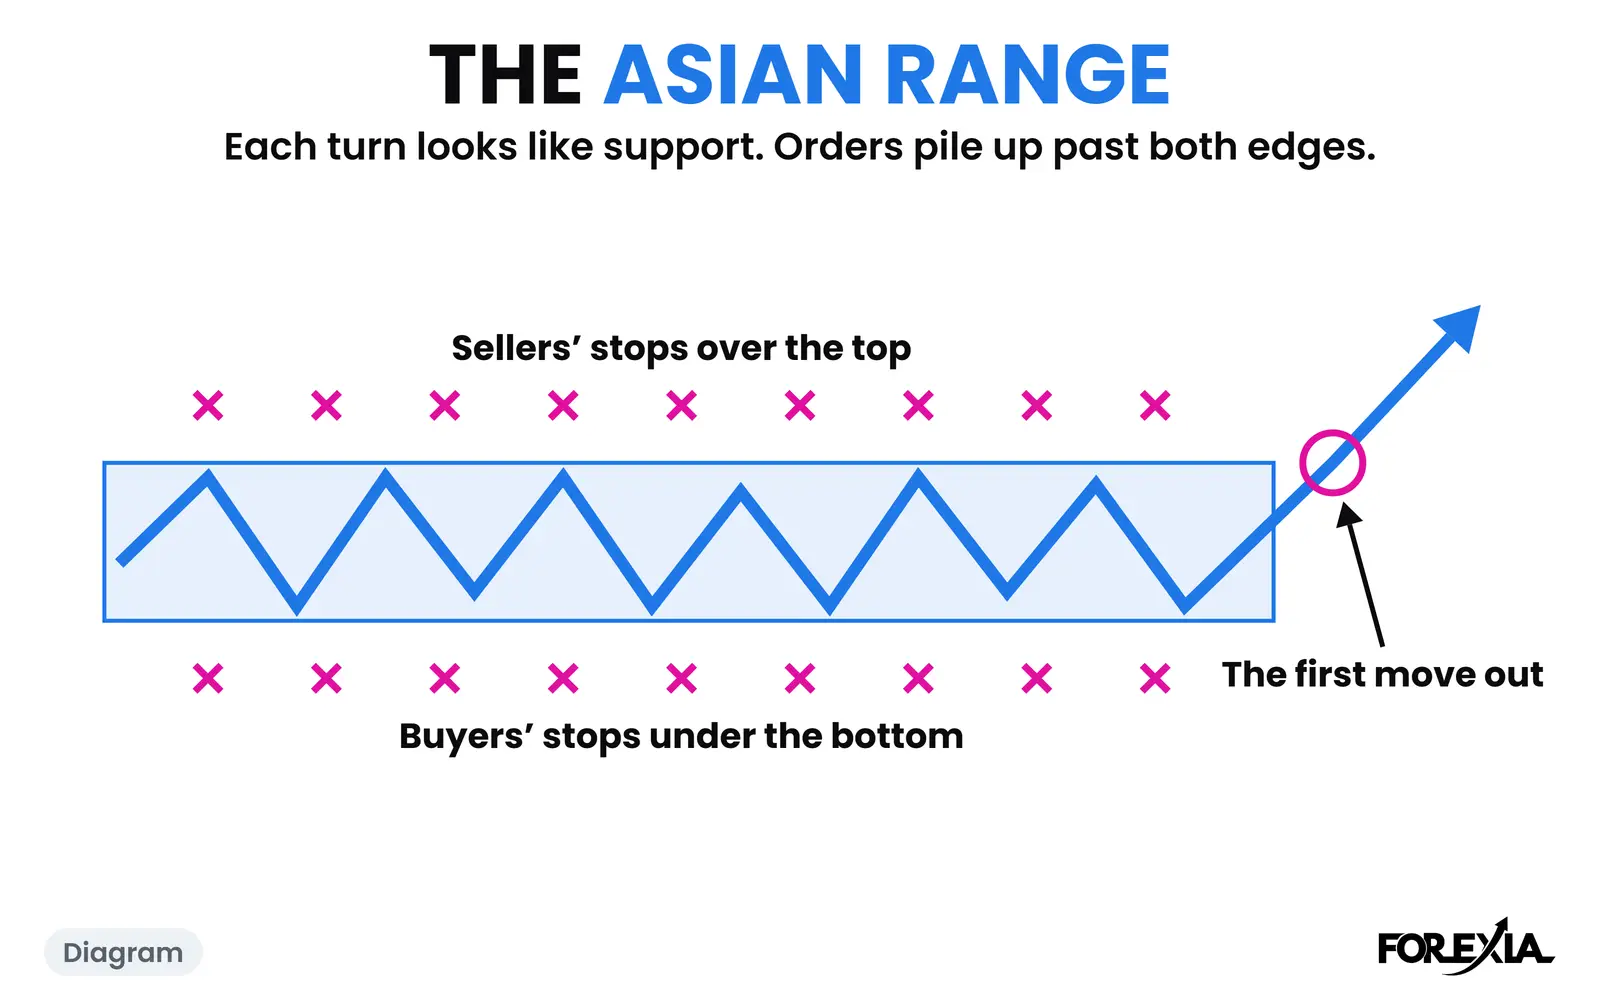
NZD/USD on Wednesday 30 September 2026 shows it on a release. Asia ran 30 pips, 0.56306 to 0.56605. The 03:15 candle reached 0.56615, a pip over the range. That is the first high. Price drifted down through the morning to a neckline at 0.56414, printed by the 08:15 candle as the ADP figure came out.
US inflation and growth data came at 08:30. That candle opened at 0.56467, traded to 0.56640 and closed at 0.56585. It went 2.5 pips past the first high and closed 3 pips back under it. Any stops resting over 0.56615 went inside that one candle.
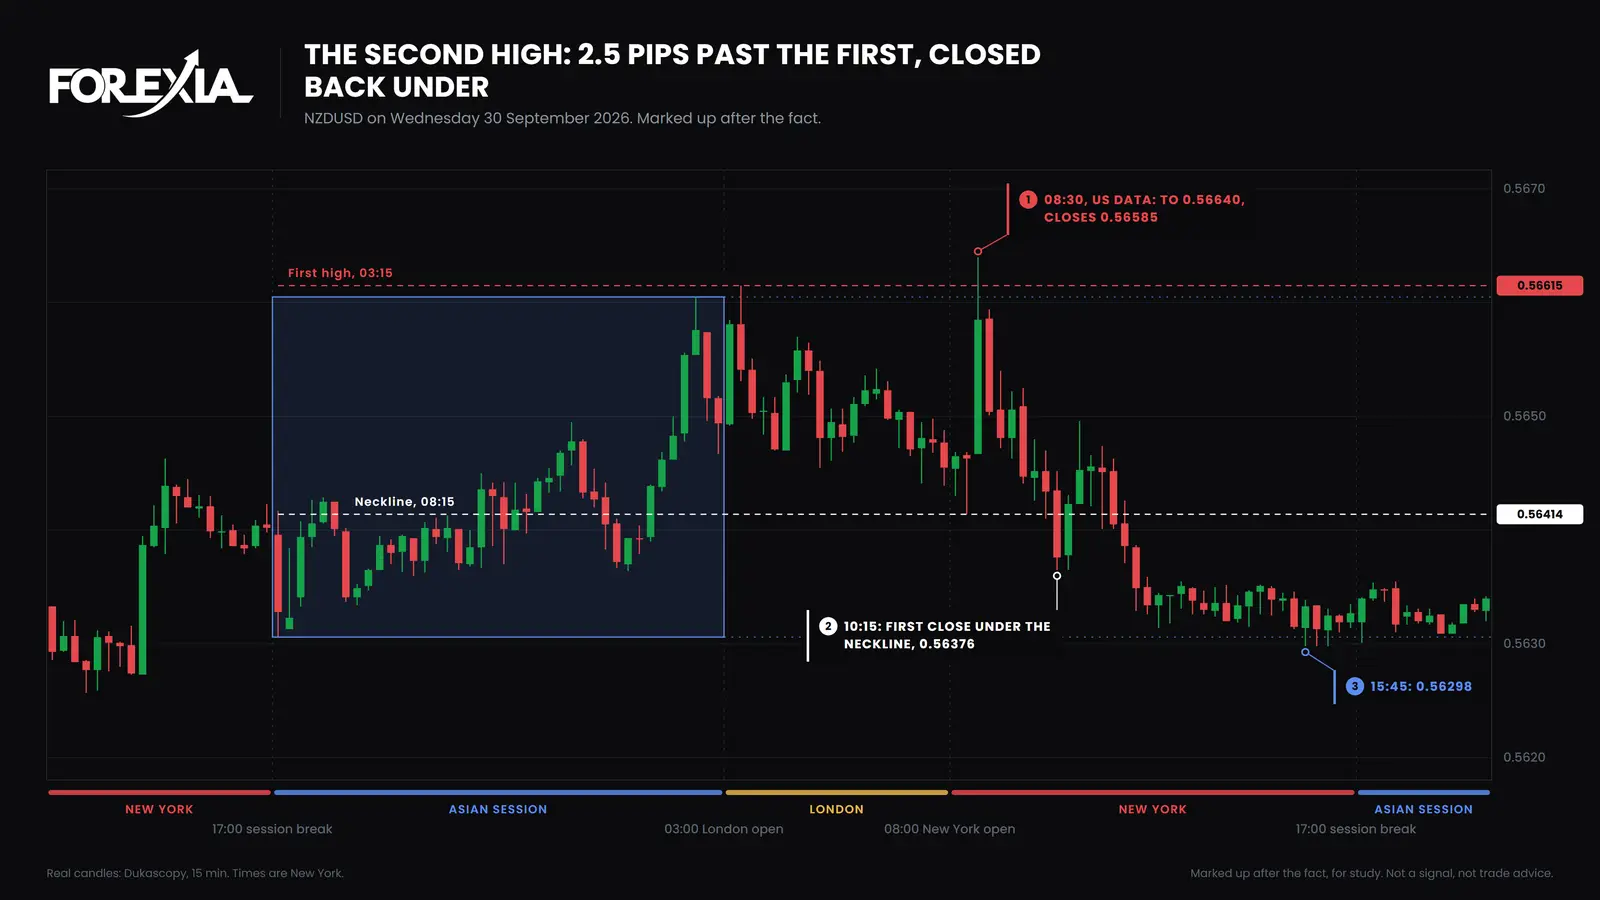
The first close under the neckline came at 10:15, at 0.56376, and by 15:45 price was at 0.56298, 34 pips under the second high and through the whole Asian range. The day ended at 0.56327.
Two and a half pips is all it took, and the release was the reason on the screen. The chart shows where the candle went. It does not show whether anyone aimed it there.
What does a double top with no hunt look like?
AUD/USD on Tuesday 23 June 2026 is one, and the book's picture played out without any run past the first high. The pair had fallen through the night. The 03:15 candle reached 0.69622, the first high, and price dipped to a neckline at 0.69418 at 04:45.
The second high came at 06:00, at 0.69596, about 3 pips short. Nothing past 0.69622 was taken. A seller's stop over the first high was never touched that day.
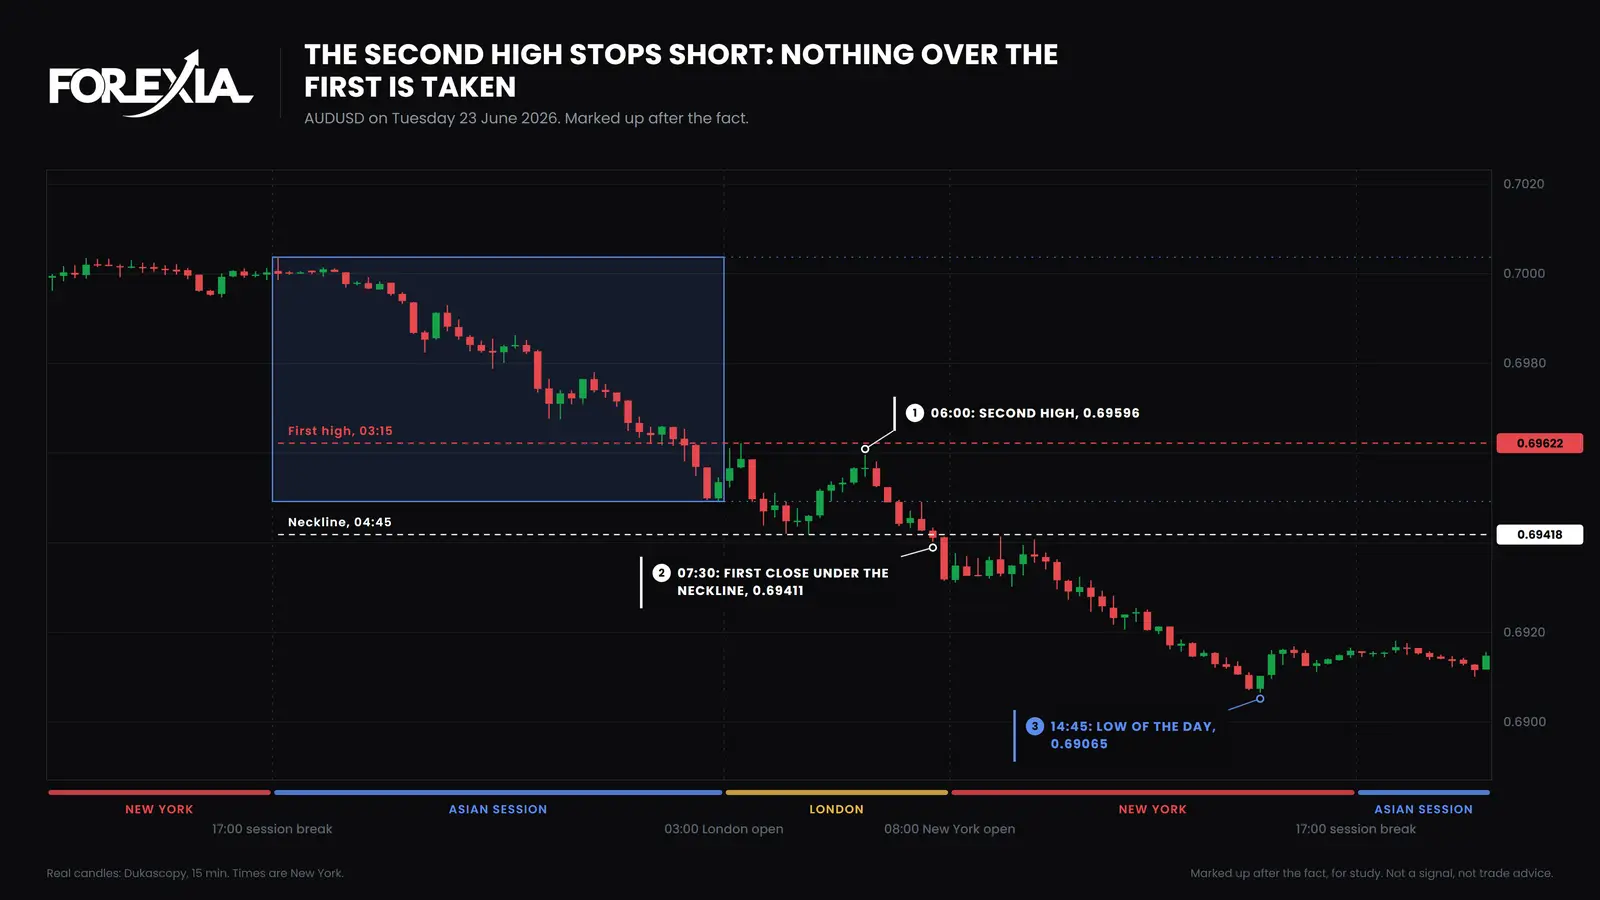
The 07:30 candle closed under the neckline at 0.69411. By 14:45 price was at 0.69065, 56 pips under the first high, and the day ended at 0.69159. Whatever stops went that day went on the way down, under the neckline and not over the highs. So a double top can simply be two lower highs in a falling market. There is no reason to invent a hunt for it.
Can a second high close back and still be a real break?
Yes, and this is the day to keep in mind before trusting the reading. EUR/USD on Wednesday 24 June 2026 printed a first high of 1.13489 at 07:45 and a neckline of 1.13245 at 09:00. The 10:00 candle, with US new home sales due, traded to 1.13520 and closed at 1.13468. That is 3 pips past the first high and 2 pips back under it, the same picture as the kiwi's.
The next three candles closed lower, at 1.13446, 1.13420 and 1.13416. Anyone reading a hunt felt right for most of an hour. Then the 11:00 candle closed at 1.13509, over the first high. The 11:15 candle reached 1.13615, past the second high, and by 12:30 price was at 1.13679, 16 pips over it. The neckline was never closed under, so this day is one of the 983 shapes and none of the 303.
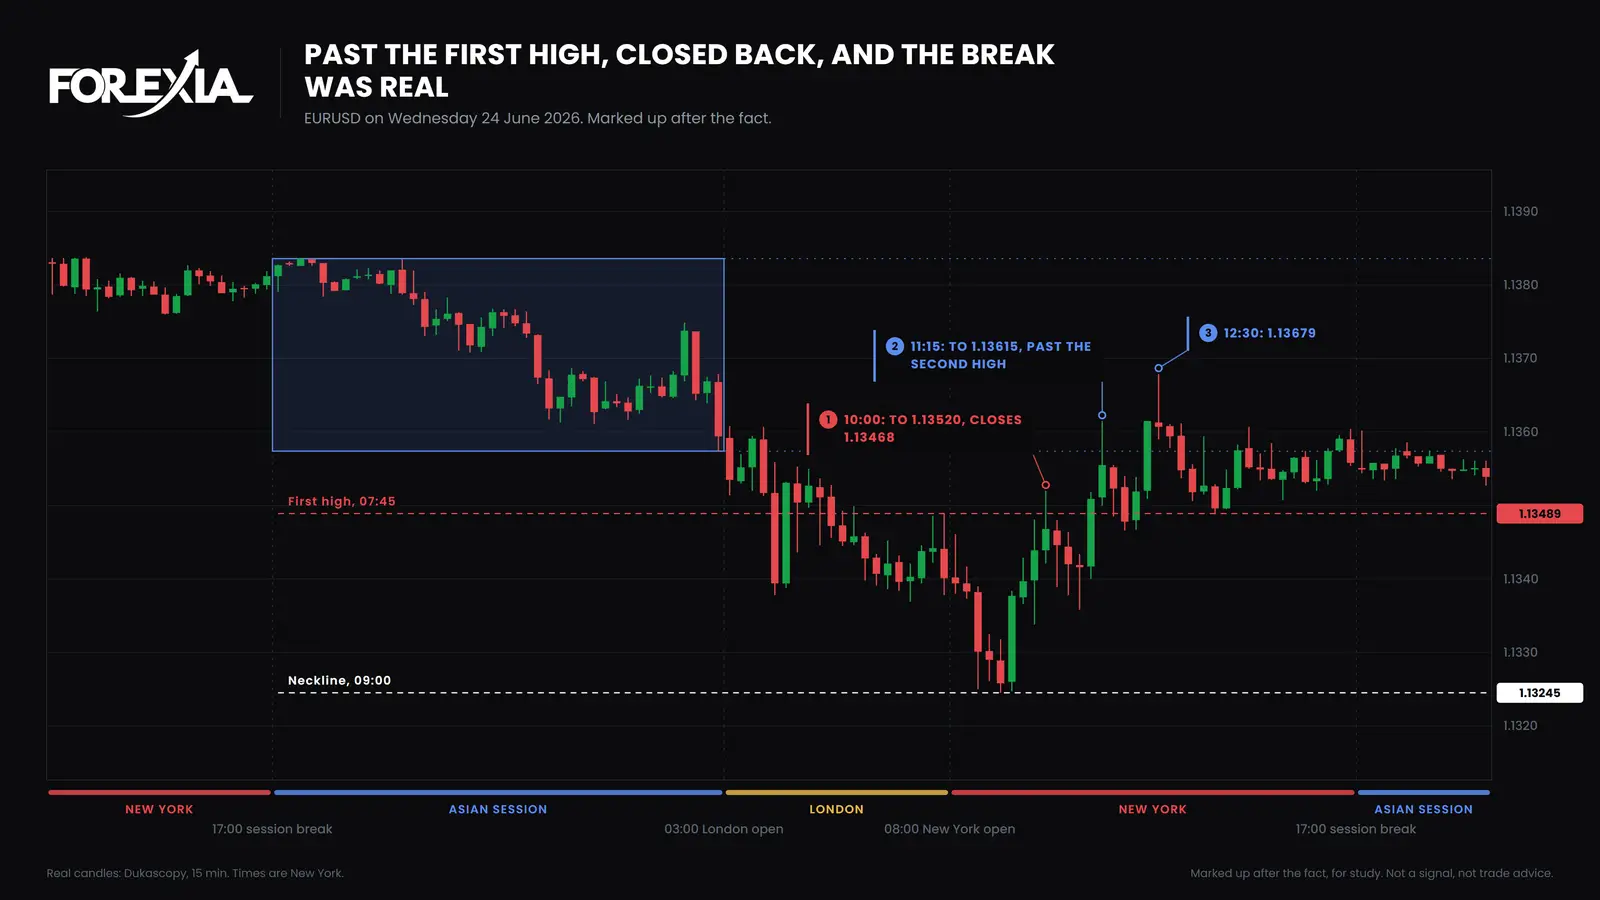
Our markup of that day files it as something else: a W, with 1.13245 as the low, 12 pips past London's first low. So the book's neckline was our low. One chart can hold both shapes, and only the afternoon sorted them.
| Day | Second high against the first | That candle's close | Close under the neckline | What came next |
|---|---|---|---|---|
| NZD/USD, 30 September | 2.5 pips past | Back under | 10:15 | Fell 34 pips from the high |
| AUD/USD, 23 June | About 3 pips short | Under | 07:30 | Fell 56 pips from the first high |
| EUR/USD, 24 June | 3 pips past | Back under | None | Rose 16 pips past the second high |
Does a run past the first high change what comes next?
Not on our count. Of the 303 shapes that closed through the neckline, those whose second high went past the first traded back past the peak within a day, before reaching the book's target, in 49 of 147 cases. Those that stopped short did so in 55 of 156. That gap is too small to read anything into, and neither figure is the result of a trade.
These are shapes on candles, with no spread, cost or judgement, over 25 weeks and four days.
What does each seat read at the second high?
The same candle splits three ways across the three seats.
- Retail sees one of two things: a new high to buy, or a second top to sell with a stop just over it. Both are orders.
- The market maker, as we read it, sees those orders in one place, and a reason to go and get them if there is size to fill.
- The observer sees a line, a run past it, and a close. The observer waits, because the euro's close back looked like the kiwi's until 11:00.
The Third Tap asks the same question of a third touch, and the same read carries over to a wedge's last push, on which way a rising wedge breaks and rising wedge vs falling wedge.
What can this reading not tell you?
It cannot tell you in advance, and it cannot show who did it. You only know the second high is a hunt once it has closed back and price has left, and the euro shows that even then you can be early. The release on the kiwi's candle could explain that move with no hunter at all.
All three days were picked afterwards, and a reversal seen afterwards is not a setup. Run as a mechanical rule, our own test of the setup did not make money. A reading can explain where a stop went without giving you the next trade.
Course 3 of ForexiaPRO, Reverse Price Action, teaches this read step by step in lesson 3.2.3, M and W Reversals: the Double Top and the Double Bottom.
Frequently asked questions
Is a second high that goes past the first still a double top?
It can be, if the two highs are about level. Our count allows up to a tenth of the average daily range between them, and of 303 shapes that closed through the neckline, 147 had a second high past the first. Whether it stays a double top depends on what comes next: closes that hold above the highs make it a break.
Why would stops sit above the first high of a double top?
Because anyone who sold that high was told to put a stop just over it, and a stop on a sell is a buy order. Breakout traders also place buy orders there. Nobody can see those orders from outside, so this is a reading of where the book sends people, not order-book data.
Does a close back prove the second high was a stop hunt?
No. EUR/USD on 24 June 2026 ran 3 pips past its first high, closed 2 pips back under it, and went on 16 pips above the second high within two and a half hours. A close back says what that candle did. It does not settle what comes after.
Does a second high past the first change what a double top does next?
Not on our count. Of the shapes that closed through the neckline, those with a second high past the first went back past the peak before the book's target in 49 of 147 cases. Those that stopped short did so in 55 of 156. That gap is too small to sort them, and these are counts of where price went first, not results of a trade.