Why Double Tops and Double Bottoms Fail: The Third Tap and the Crowd It Fills
Dylan Forexia8 min read
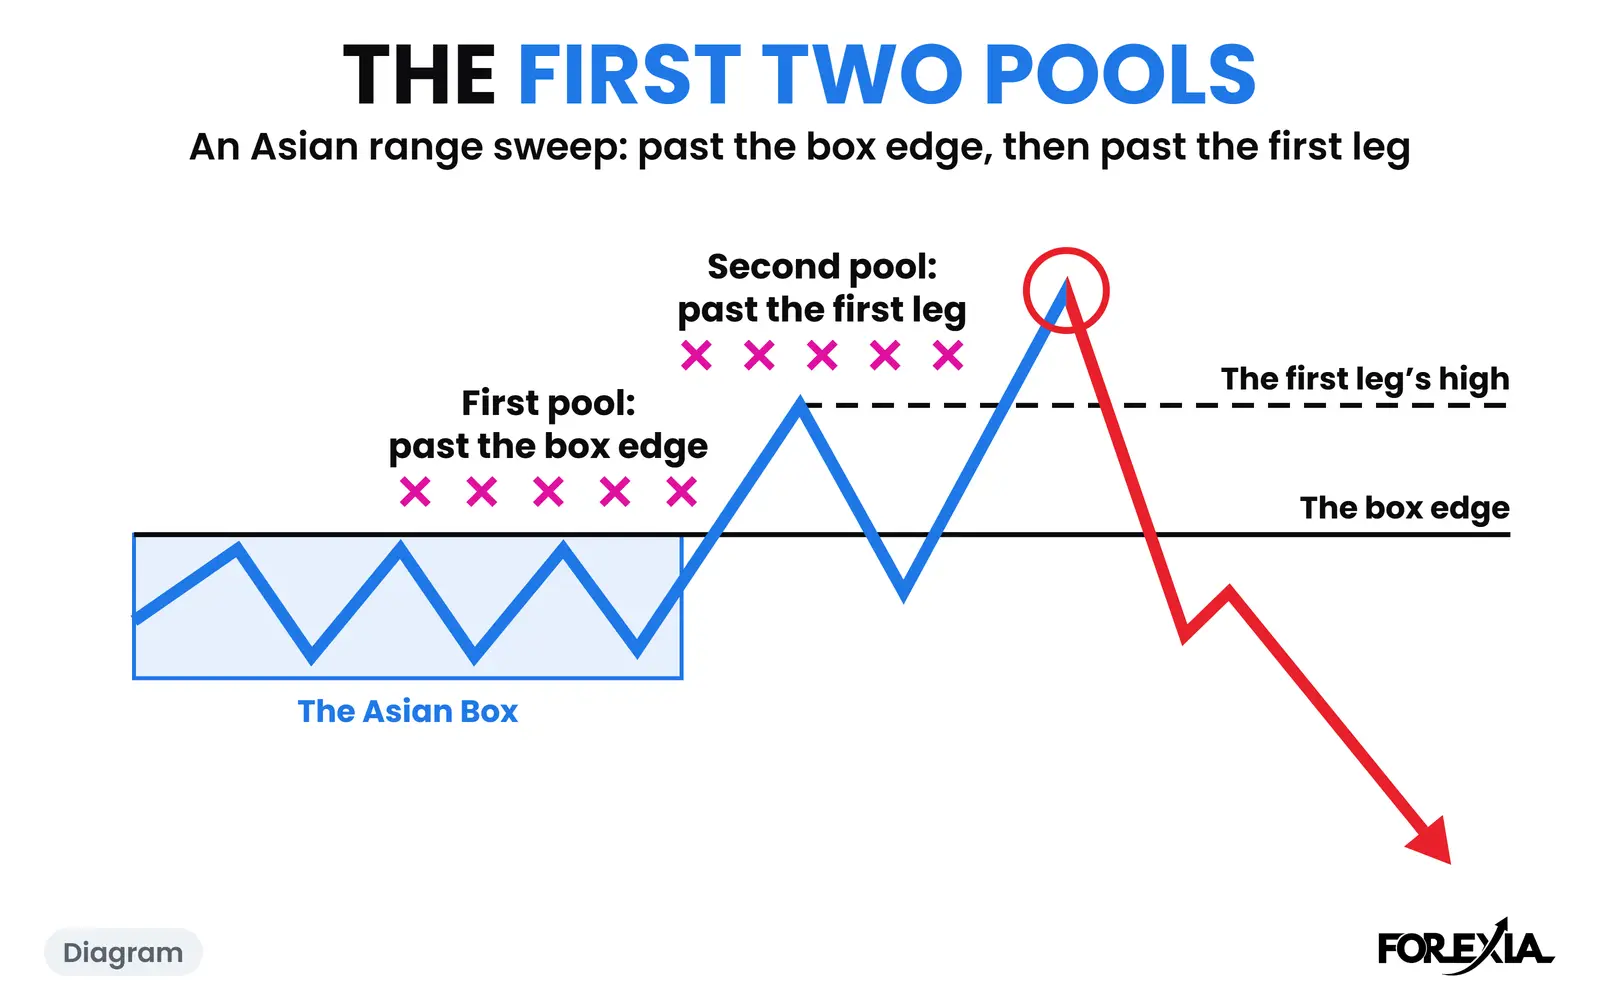
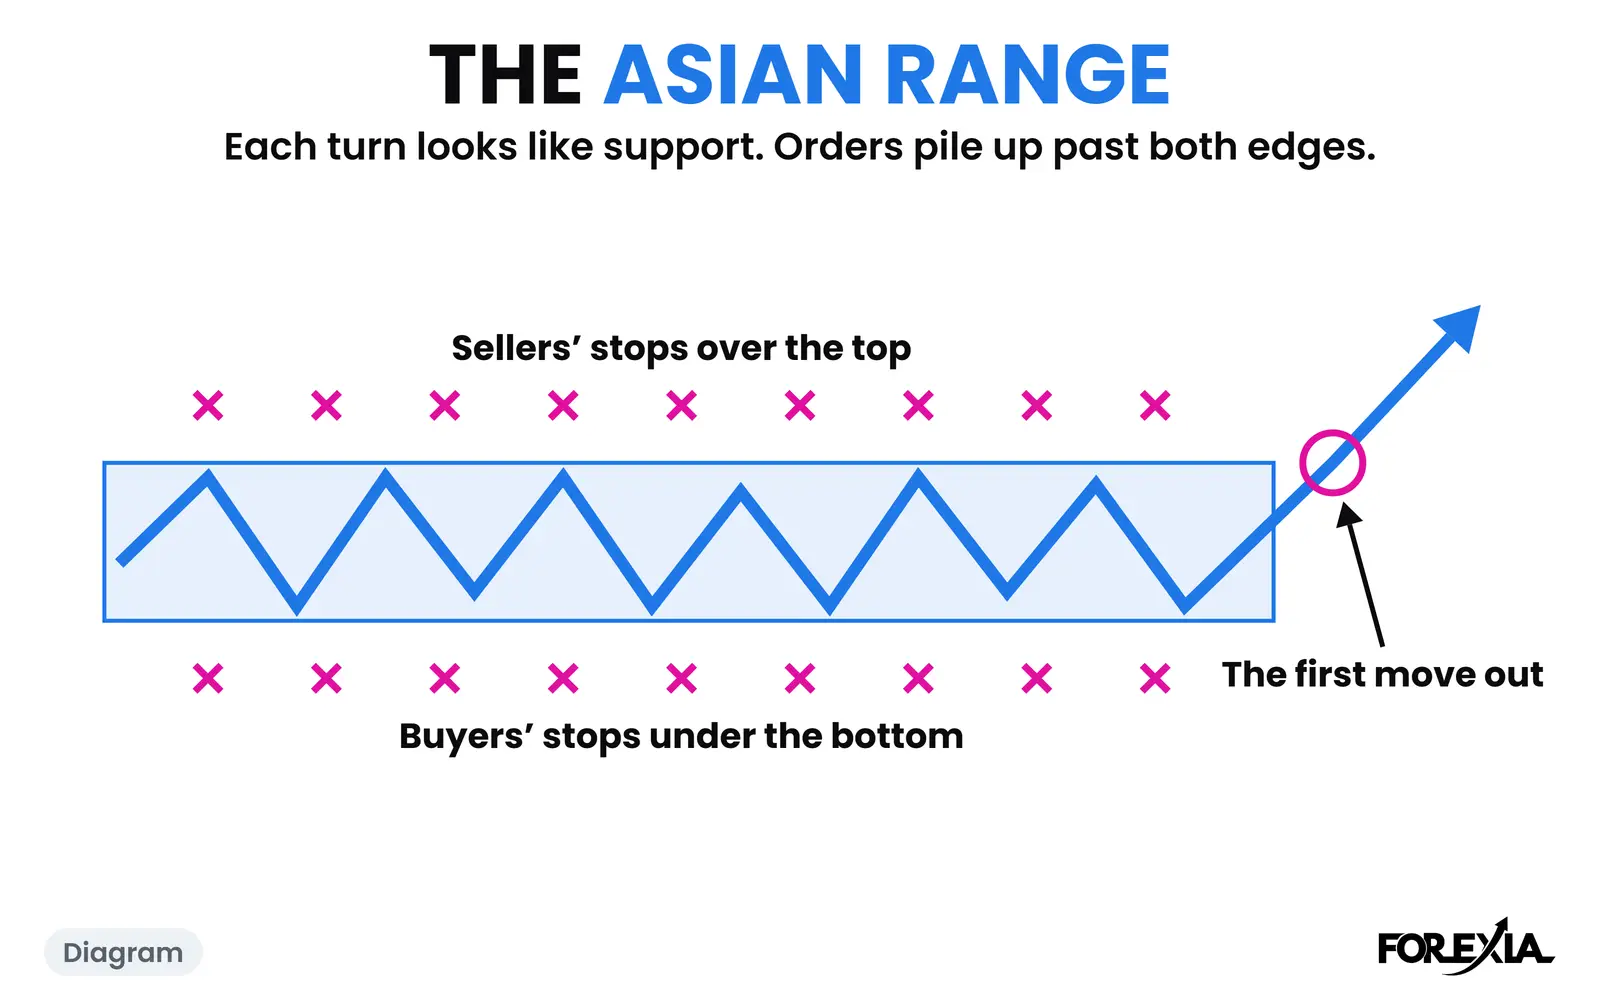
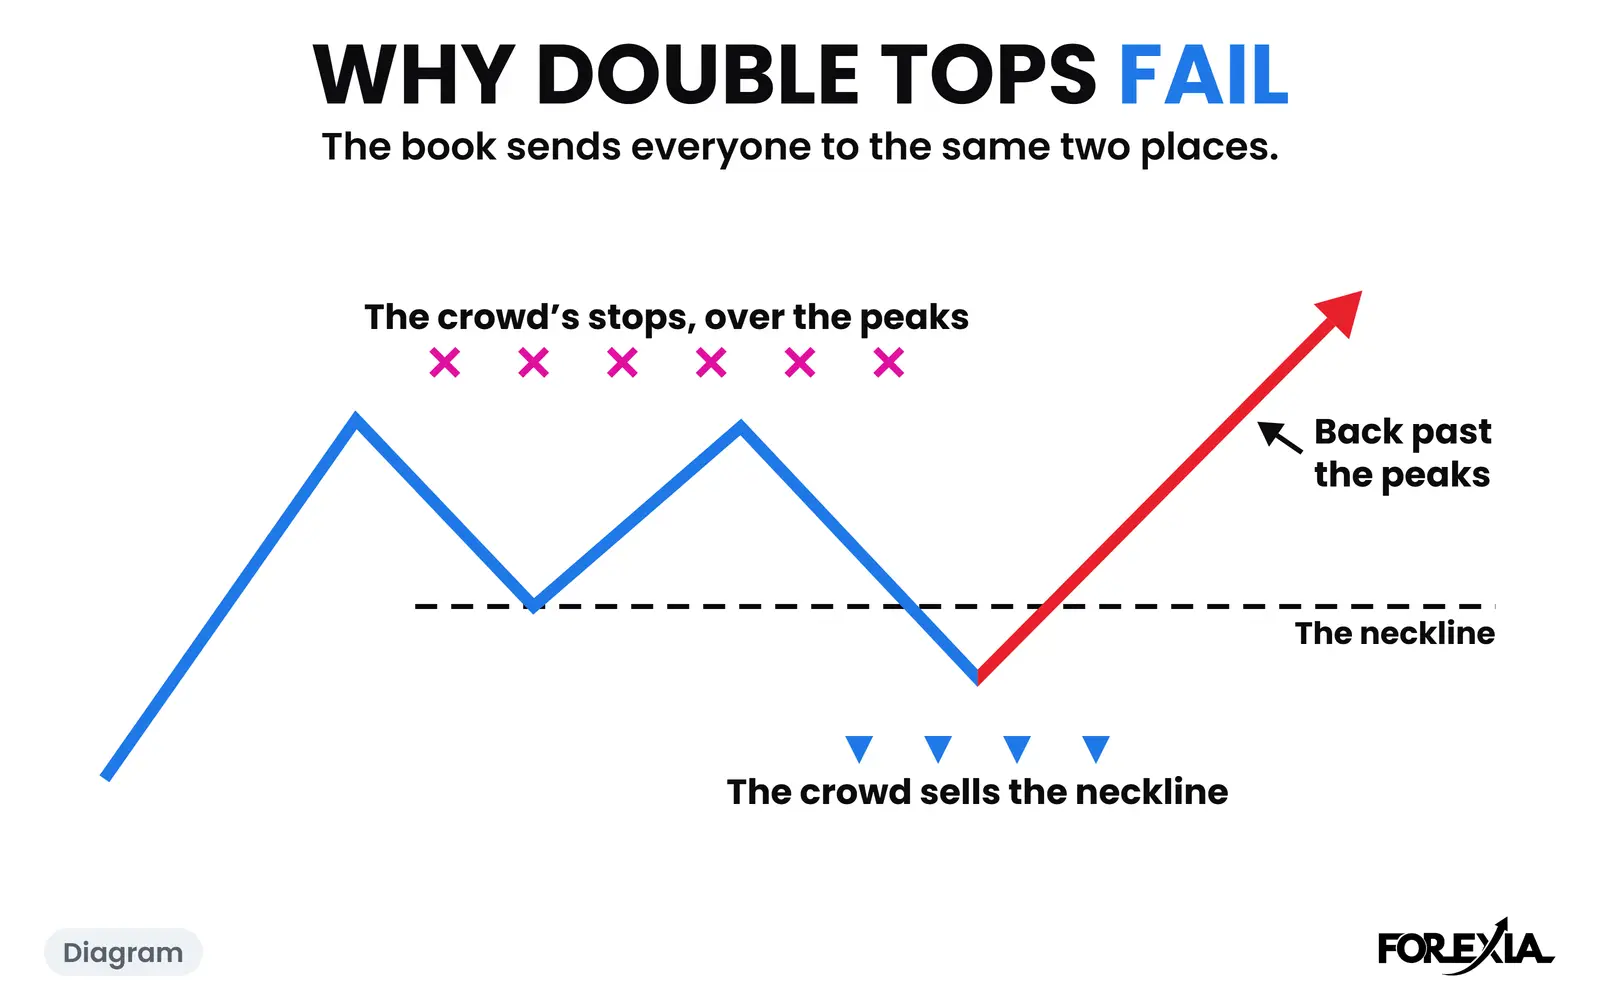
Double tops and double bottoms fail for two plain reasons: most are shapes in places where nothing was going to happen, and the book sends every reader to the same two spots, a sell at the neckline and a stop just past the peaks. Those spots are pools of orders. In our count, most shapes never gave the signal, and many that did went back past the peak first.
The shapes themselves are on our guide to the double top and double bottom. This page is about the failure: what the count says, why we read it that way, and what it looked like on two real days in August 2026.
Why do double tops and double bottoms fail so often?
The usual lists name real causes. A pattern is called before it has finished. A strong trend runs straight through what looked like a top. A release arrives. The shape forms in a thin hour, or on a chart too small to mean anything. All of those happen, and we have no count that separates them.
Our own count asks something simpler: what did these shapes do next? We used Dukascopy's 15-minute candles from Monday 6 April to Thursday 1 October 2026, 1,030 market-days on seven dollar majors and gold. A shape is two peaks 2 to 12 hours apart in one trading day, about level with each other, with a real dip between them. That rule found 983 shapes, 505 tops and 478 bottoms.
- 680 went nowhere. They never closed through the neckline that day, or they went past the peak first.
- 303 closed through the neckline, which is the book's signal.
- 104 of those 303 traded back past the peak before reaching the book's target.
The market-by-market range runs from 9 of 37 on USD/JPY to 24 of 53 on AUD/USD, and those samples are too small to rank anything. These are shapes on candles, not trades: no spread, no cost, no judgement. They are a measure of how often the story in the diagram did not happen, and they say nothing about what a trade would have made.
Now the reason the 104 matter. Everyone reading the same book gets the same instruction, and a stop is an order waiting for a trigger. So the pattern announces where the crowd's exits are before the crowd has entered. A New York Fed staff report found stop-loss orders clustered near round numbers in one bank's order book, with rates moving unusually fast after reaching them. That data is from 1999 and 2000. The report reads its results as stop-loss orders feeding such moves, says its statistics cannot prove that link is causal, and mentions triggering the orders on purpose only as market lore. That those orders get used on purpose is our reading, and we say so.
What happens when the level is touched a third time?
The book says a third touch makes a level stronger. We read it the other way round. The Third Tap is the perfect third touch of a level, where the trap is set, and the question it asks is why the market would give you such a perfect entry. Each touch makes one price more obvious, and more stops collect just past it. We have not counted how often a third touch holds, so we claim no rate.
GBP/USD on Friday 21 August 2026 shows it under a low. From 22:00 to 02:15 the same level kept catching price, with lows of 1.36402, 1.36393 and 1.36405, a pip apart. The third came straight after UK retail sales at 02:00. That is a triple bottom, and the book's trade is to buy it with a stop a few pips under.
London's first hour went for those stops. The 03:45 candle dipped to 1.36374 and closed just back over. The 04:00 candle went to 1.36352 and closed at 1.36405. That is 4 pips past the level, 1 pip back over it at the close, and it also went past a lower dip from earlier in Asia, 1.36364 at 21:00. We read that as the stop hunt, a liquidity sweep of the buyers' stops.
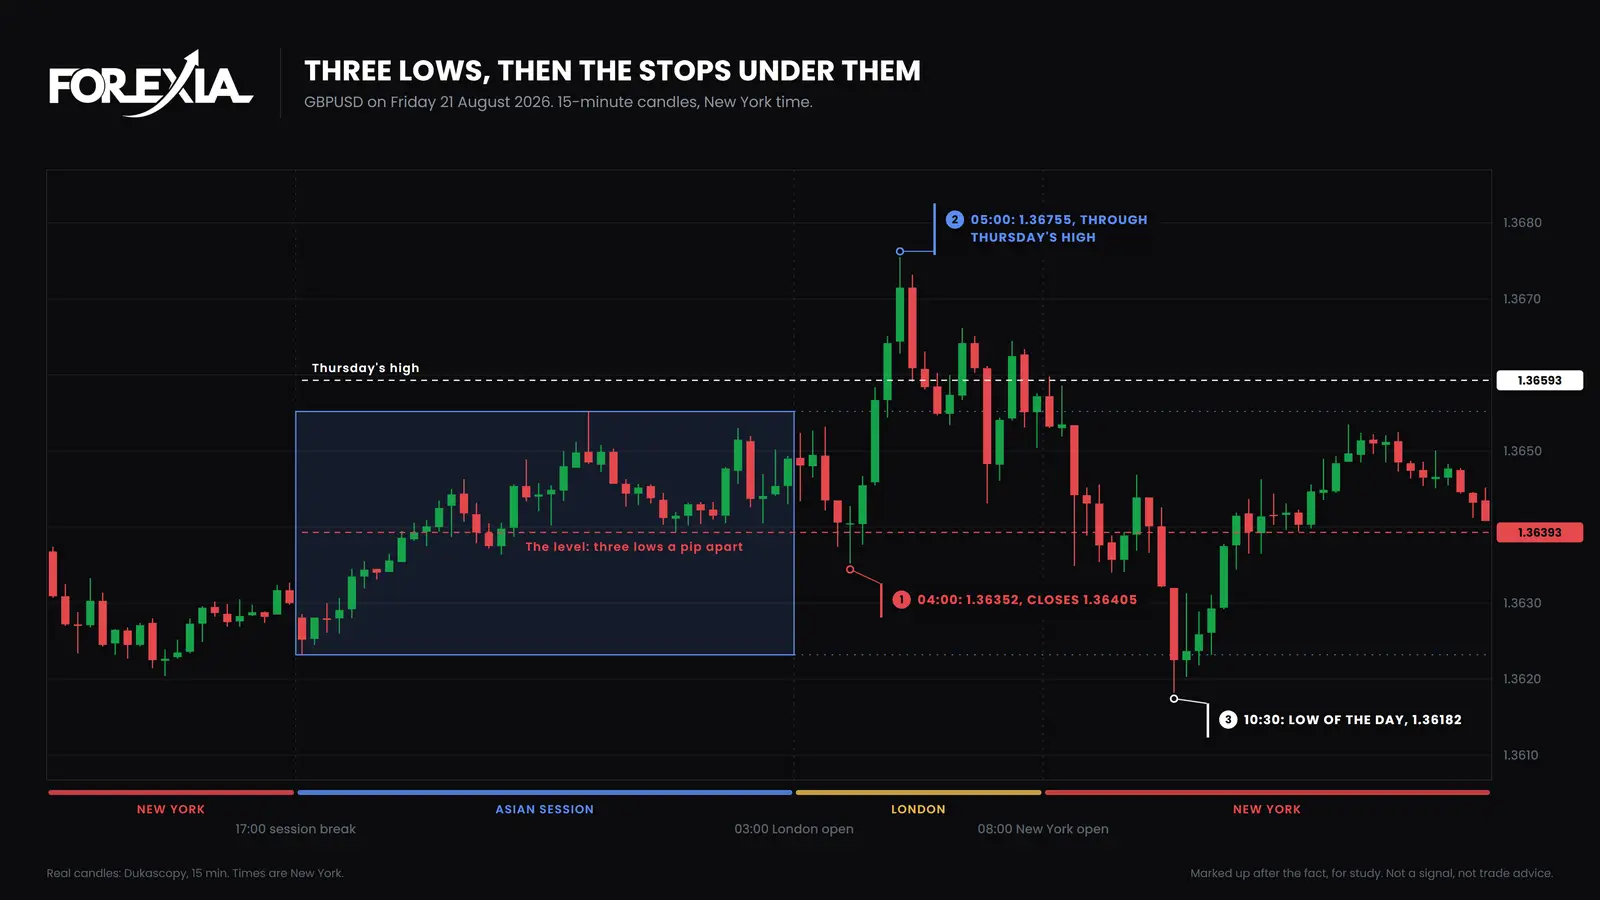
Then price went the way those buyers had said. UK PMIs came at 04:30, and by 05:00 price was at 1.36755, 40 pips up in an hour and through Thursday's high at 1.36593. The buyers were right about direction and out of the trade.
The day did not stay tidy. The 08:30 candle broke the level again, down to 1.36349, and the low of the day was 1.36182 at 10:30. Both sides of the market got hunted.
What does a neckline seller's stop go through?
EUR/USD on Friday 28 August 2026 is the same thing over a high, and the Third Tap's page follows its third-tap sellers. Look instead at the trader who did everything the book says and waited for the neckline.
Three highs at 1.16491, 1.16486 and 1.16494 sat under a pip apart from 02:45 to 07:00. Between them, price dipped to 1.16392 at 06:00, and that is the neckline. It held again at 08:30, to the pip. The 08:45 candle poked to 1.16503, a pip over the highs, and closed back under them. The textbook seller waits. At 09:45 the wait ends: that candle goes to 1.16371 and closes at 1.16377, under the neckline. That is the signal, and the stop goes just over the peaks.
The next candle opens at 1.16392 and, in its first minute on Dukascopy's 1-minute candles, runs to 1.16589. That is 21 pips over the signal's close and 10 pips past the three highs, 9 past that poke. The Fed chair's speech and the payrolls benchmark revision were both due at 10:00, with Chicago PMI 15 minutes before. Then the same candle falls to 1.16102 and closes at 1.16116, 38 pips under the peaks, well past the book's target of one pattern's height under the neckline.
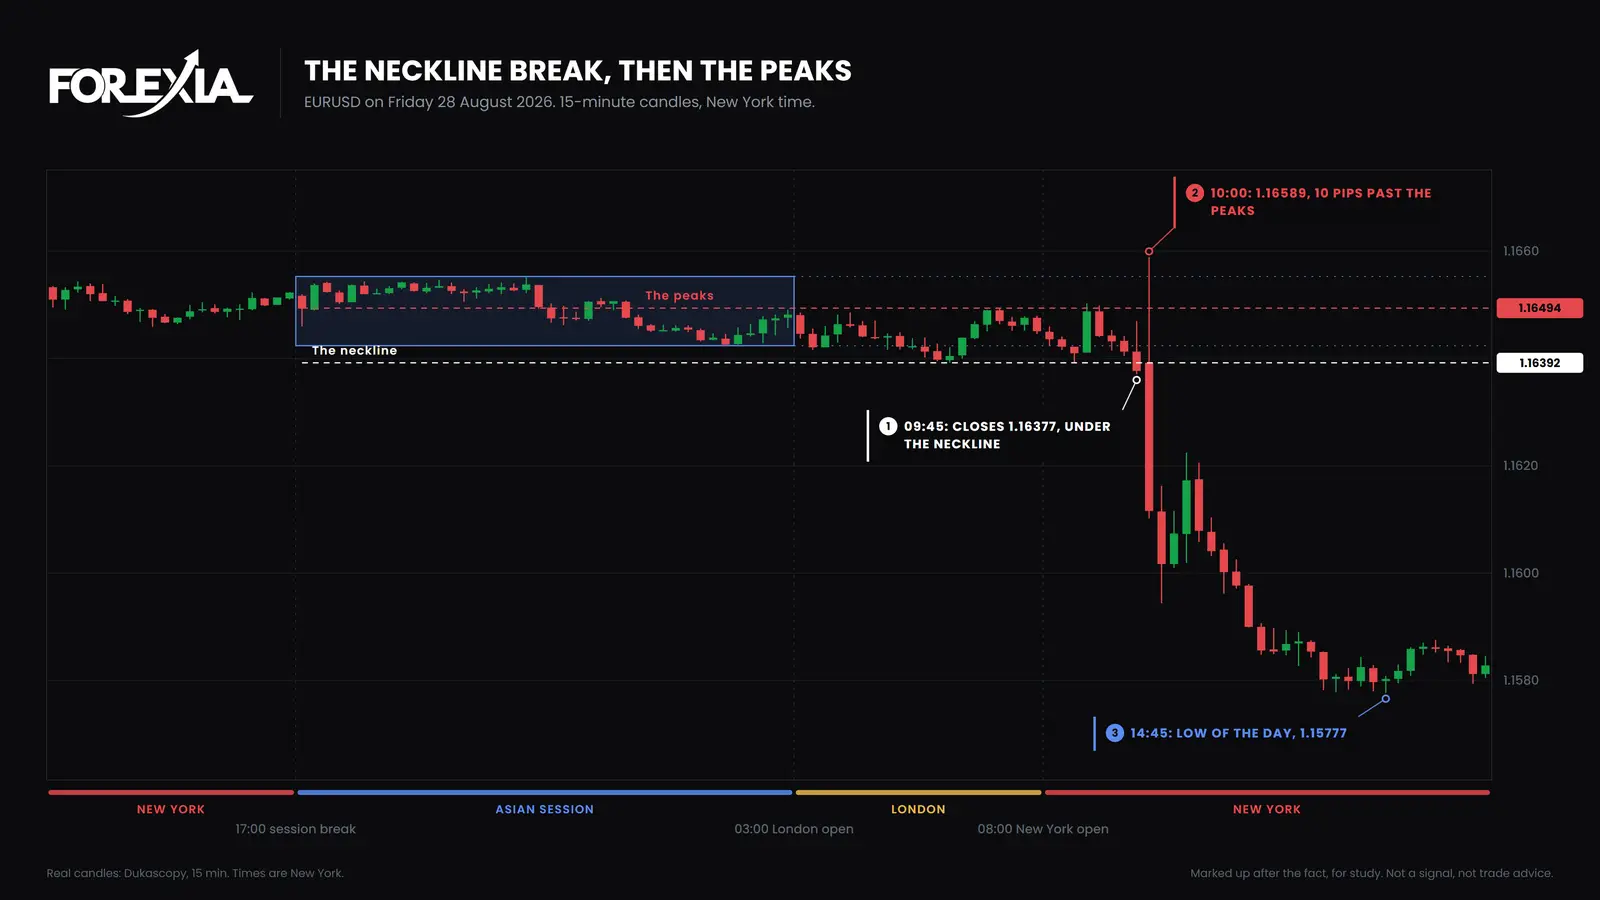
The pattern was right about direction: the low of the day, at 14:45, was 1.15777. A seller with a stop inside those 10 pips never saw it. This one candle is the failure the diagrams leave out, and it can happen on a shape that then does exactly what the book predicted. Nothing here shows anyone aimed that candle at those stops. The release moved every dollar pair, and the chart shows only where it went.
What does each seat see in a failed double top?
The same two days split three ways across the three seats:
- Retail sees a trade. Two or three touches, a clear line, a stop that feels safe because it is past every peak.
- The market maker, as we read it, sees a queue. Everyone in that trade has the same exit, and it is an order pointing the other way.
- The observer sees the sequence. Peaks, a neckline, a run past the peaks, a close. The observer knows what happened and in what order, and not who did it.
Does a second peak past the first tell you anything?
No, on our count. The tempting idea is that a second peak running past the first, a stop hunt, sorts the good shapes from the bad. Of the 303 shapes that closed through the neckline, those whose second peak went past the first went back past the peak before the target in 49 of 147 cases. Those whose second peak stopped short did so in 55 of 156. That gap is too small to read anything into.
That is the honest limit on all of this. Reading a shape from its stops explains why a loss happened, and we have no evidence that it picks the next winner. Run as a mechanical rule, our own test of the setup did not make money. The two days on this page reversed, which is why they are here, and a reversal seen afterwards is not a setup. Whether a double top is a stop hunt of its first high takes that reading further, the false breakout in forex applies it to other patterns, and the M pattern in forex gives our own word for the shape.
Common mistakes
All five come from taking the book's picture for the market.
- Trusting the name. "It's a double top" describes what has already happened. Most of ours never gave a signal.
- Thinking the neckline protects you. On the euro the neckline seller waited for the signal, and the stop still went within 15 minutes.
- Reading the failure as direction. On the euro the shape was right about direction, and that did not save the stop.
- Assuming a level is finished with. On the pound the same lows gave way again at 08:30, and the day's low came two hours later.
- Curing it with a few extra pips. The distance is not fixed: 4 pips on the pound, 10 on the euro.
Course 3 of ForexiaPRO, Reverse Price Action, teaches this read step by step in lesson 3.1.3, The Third Tap: the Perfect Entry Is the Trap.
Frequently asked questions
Why do double tops fail?
Mostly because they are drawn in places where nothing was going to happen, or because the place the book sends the stop is the first place price goes. In our count of 983 shapes on 15-minute candles, 680 did not close through the neckline that day before going past the peak, and 104 of the 303 that did traded back past the peak before reaching the book's target.
Do double bottoms fail for the same reason as double tops?
The reading is the same in a mirror: the stops rest under the lows rather than over the highs. Our count takes tops and bottoms together, 505 and 478 of them. The day on this page that shows it is GBP/USD on 21 August 2026.
Does a third touch make a double top stronger?
That is the textbook view, and we have not counted it. What three touches do show the crowd is one obvious price and one obvious place for a stop. On EUR/USD on 28 August 2026 the three highs sat under a pip apart, and the candle that broke the pattern went 10 pips past them first.
How can you tell a double top will fail before it does?
You cannot, on our evidence. Where the second peak went past the first, 49 of 147 shapes went back past the peak before the target. Where it stopped short, 55 of 156 did. That gap is too small to sort them. You can mark where the stops sit, and that is a different thing from knowing which way price goes.