
Trading Psychology: Why Most Traders Lose, and the Seat That Changes the Read
What is trading psychology? The short answer
Trading psychology is how emotion, habit and belief change what a trader does: what they enter, hold, close and repeat. Fear, greed and discipline are part of it. So is where you were taught to stand on a chart, and how many others stand there with you. It can make a sound plan worse. It cannot make a plan sound.
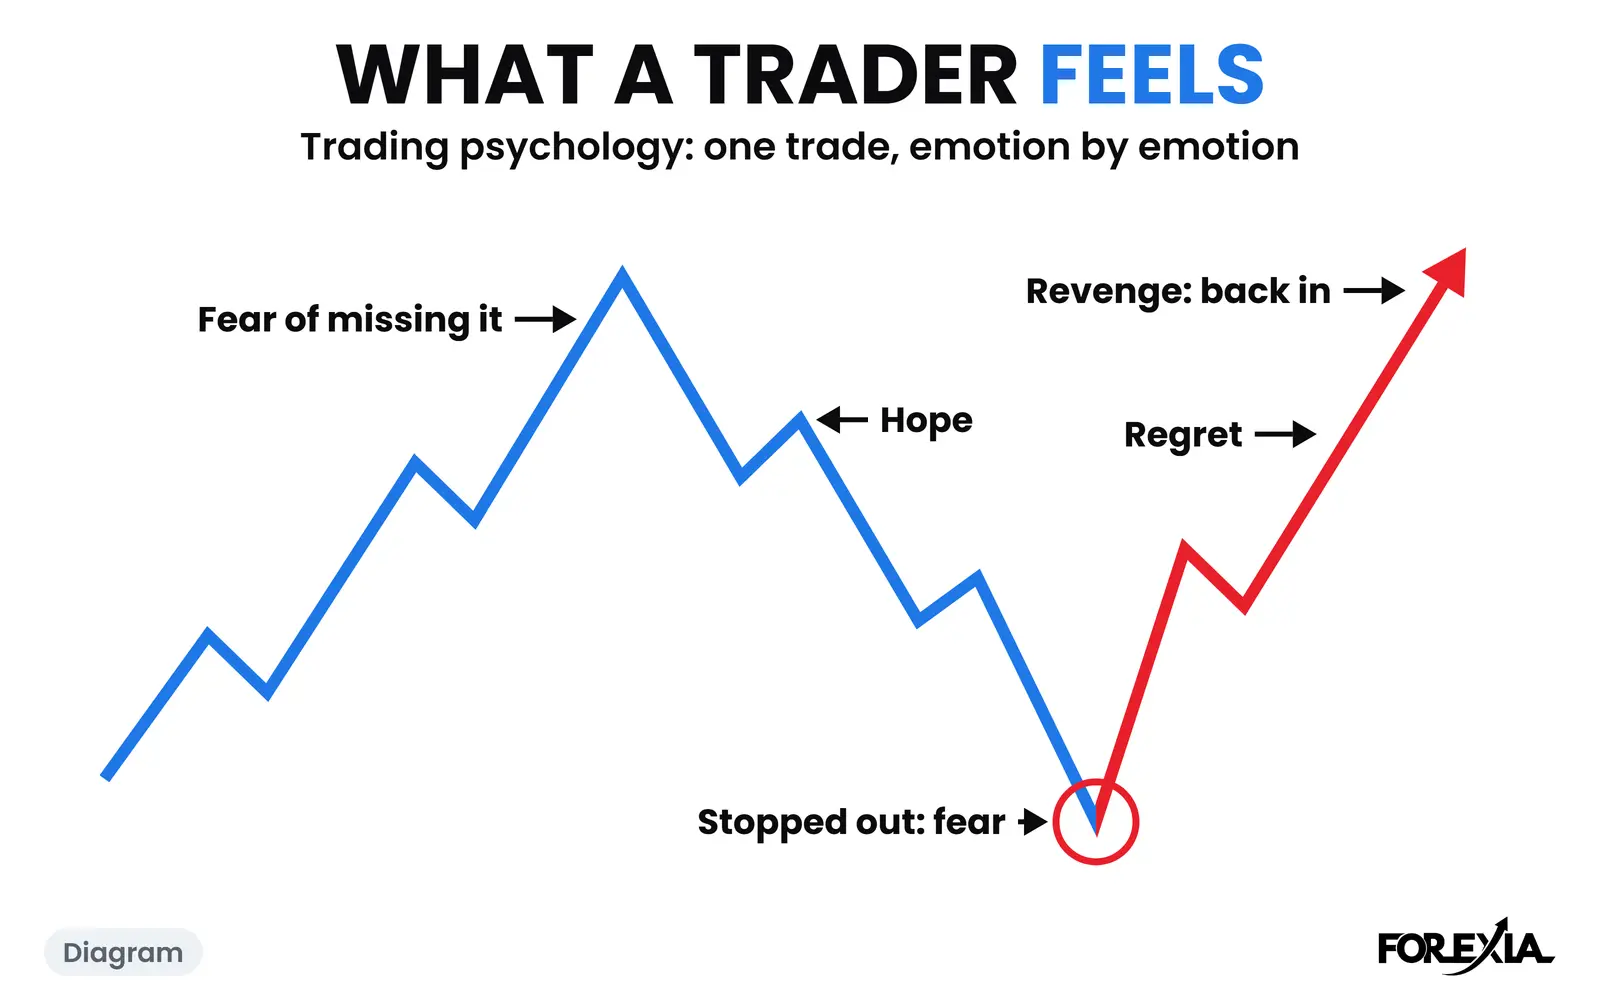
That last line is why this page reads differently from most on the subject. We ran our own setup as a fixed rule, a program with no fear and no greed, and it lost money after costs. A trader following that rule with perfect discipline would have had the same result. So anyone who tells you that psychology is the whole answer has skipped a step: first the rule has to work. That test says nothing about a person reading the chart, either way.
This page shows the subject on four dated days on our own charts, reads them from three seats, sets out what research has measured on real traders, and says what nobody knows. Nothing here promises better results. What is trading psychology goes deeper on the definition.
Most lists of biases treat them as equally proven. They are not, so here they are sorted by how they were measured.
| What it is called | What it does to a trade | How it was measured |
|---|---|---|
| Loss aversion | A loss hurts more than the same gain pleases | Choices between gambles (Kahneman and Tversky, 1979). On real traders, see revenge trading below |
| Holding losers (the disposition effect) | You bank gains fast and let losses run | 10,000 accounts at a US discount broker (Odean, 1998) |
| Overconfidence | You trade more than your results justify | Inferred from overtrading: 66,465 US households (Barber and Odean, 2000) |
| Herding | You act as those around you act | Retail forex traders on a social network (Heimer, 2016) |
| Fear of missing out | You chase what just moved | Nearest evidence: people buy what grabs their attention (Barber and Odean, 2008) |
| Confirmation, anchoring, gambler's fallacy | You see what you expect, or feel "due" a win | General psychology. We read no field study of these on retail forex traders |
| Hindsight | The chart looks obvious afterwards | Look at any chart on this page: each was picked after the day was over |
The three seats: retail, market maker, observer
The Three Seats are three places to read one chart from, and the feeling you have usually tells you which one you are in. Reading from all three on purpose is what we call Perceptual Positioning. The name is borrowed from an exercise in neuro-linguistic programming, and we found no study that tests it on traders, so it is a way of reading and not a proven edge. What is perceptual positioning takes it further.
USD/JPY on Tuesday 29 September 2026 had no medium or high-impact release on our calendar before 10:00 New York, so nothing there explains the morning. The Asian Box ran from 157.203 to 157.583. At 05:45 New York a candle opened at 157.417 and closed at 157.701, 12 pips over the top of the box, and the next one printed 157.714. By 08:00 price was at 156.979, 73 pips lower.
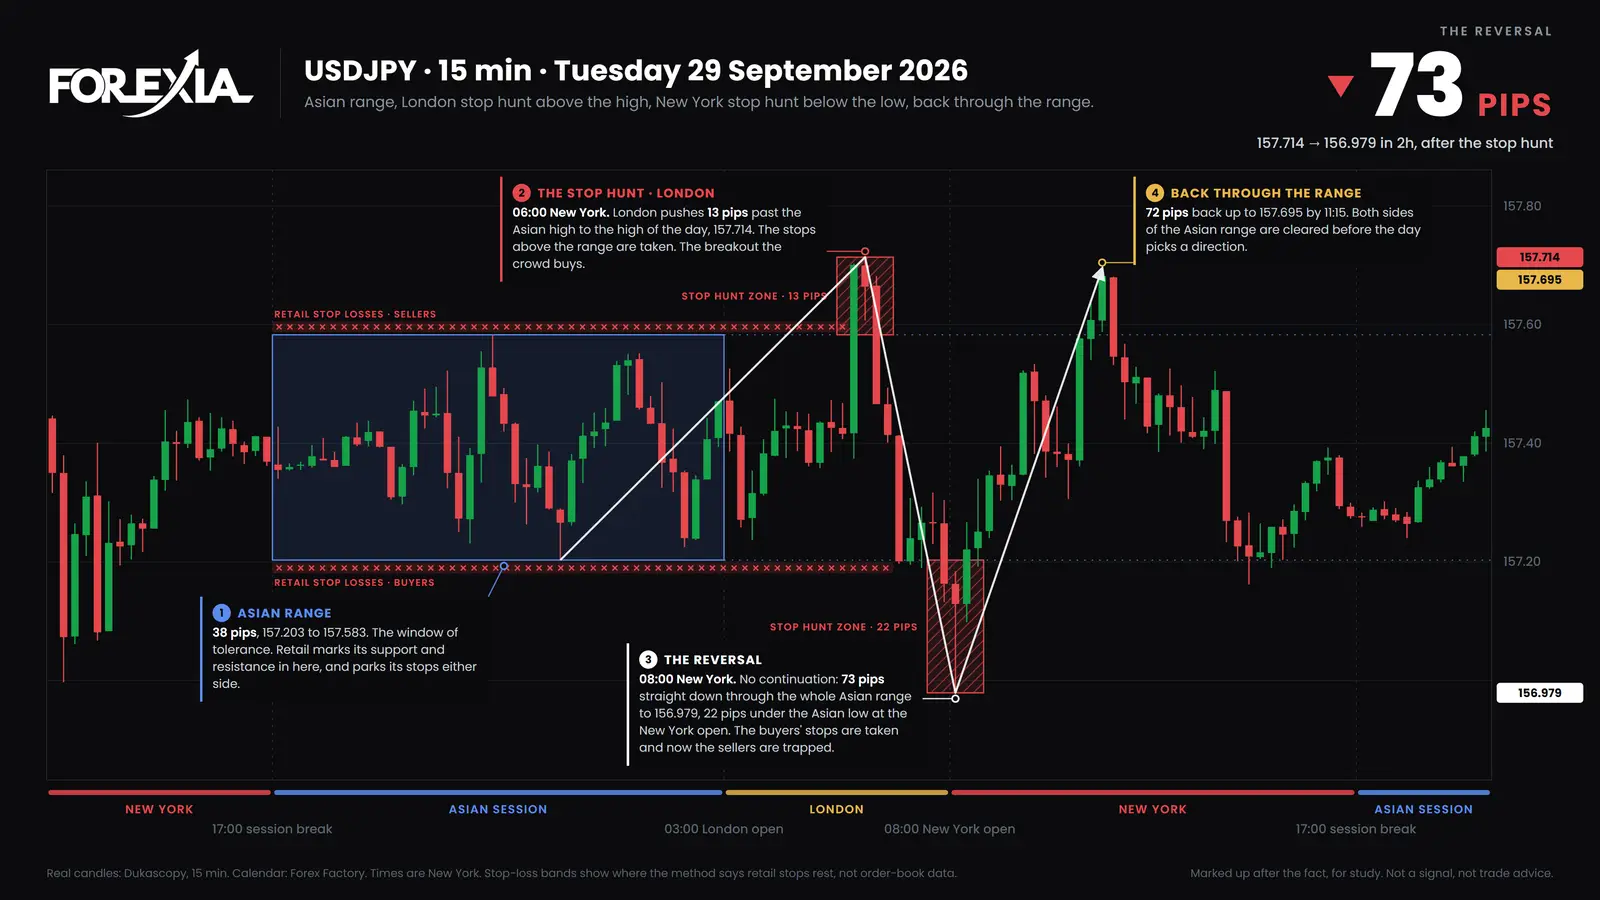
Here is the 05:45 candle from each seat. On this page a candle is named by the New York time it opens.
| Seat | What it reads | What it feels | What it wants |
|---|---|---|---|
| Retail | A breakout with momentum | Urgency, and fear of missing it | To be in before it goes |
| The market maker | Buy orders: breakout buyers, and sellers' stops over the box | Nothing we can know. We infer this seat, and nobody outside can see those orders | Its size filled where the orders rest |
| The observer | Both of those, and a candle not yet proven | Curiosity. The only fear is acting too early | To see a close back, or see it fail to come |
The 06:15 candle closed back inside the box at 157.466. We read the first push as the crowd's buying being filled. Then the day shows why the observer is not a forecaster. Anyone who sold late and felt clever at 08:00 watched price climb 72 pips back to 157.695 by 11:15, through US consumer confidence and job openings at 10:00. The close back said what had happened. It said nothing about the afternoon.
The question after a loss changes with the seat. "I was not disciplined" becomes "I was standing where everyone stands." Both can be true. The wider comparison, retail traders vs institutional traders, has its own page.
Why most traders lose, and the NPC
Most retail accounts do lose money, on the figures regulators have published, but nobody has measured how much of that loss is psychology. The usual answer in this industry is a saying: ninety percent of traders lose ninety percent of their money within ninety days. That is the 90-90-90 Rule, and we repeat it as a saying only. Regulators' figures sit under its first number, and nothing we found supports the other two.
| Source | What it found | Its limit |
|---|---|---|
| ESMA, March 2018 | 74-89% of retail accounts typically lose money on CFDs, with average losses per client of €1,600 to €29,000 | One product, in the EU, before its leverage limits. It counts accounts, not people |
| FCA, December 2016 | 82% of clients lost money, in a representative sample of accounts at CFD firms | UK only, one sample |
| Barber, Lee, Liu, Odean and Zhang, Learning Fast or Slow (we read the draft of December 2018) | Day traders in Taiwan, 1992 to 2006: each day 97% could expect to lose money. Over 75% quit within two years | Stocks, not forex. A different measure: it sorts traders by past results |
| Barber and Odean, Journal of Finance, 2000 | 66,465 US households, 1991 to 1996: those who traded most earned 11.4% a year when the market made 17.9% | US stocks at one discount broker, a long time ago |
Broker pages ranking for this search carry a banner giving the share of their own retail accounts that lose money on CFDs. ESMA's measures required that kind of warning. It is a disclosure, and it does not say why.
The Taiwan study has the line we find hardest to read. Day traders with 50 or more days behind them and a record of losses had a 95.3% chance of day trading again within twelve months. Those with a record of profits had a 96.4% chance. Among the experienced, losing barely changed whether people came back.
The usual reasons are leverage, no plan, costs and holding losers, and why most traders lose goes through them. Ours is an addition: the NPC, what trading education turns you into, a predictable bot who follows the trend and asks no questions. Dumb Money is that same herd seen from outside. Discipline asks whether you followed your rules. The NPC asks who else has the same rules.
The research gives that some support and no proof. Heimer's 2016 paper, read in its working-paper form and published in the Review of Financial Studies, is the one forex study here: giving retail forex traders access to a social trading network nearly doubled their tendency to bank gains and hold losses. People do catch trading behaviour from each other. Nobody has counted who was in a given candle, so the NPC stays our reading. If you have a good strategy and still lose, why you lose in forex with a good strategy looks for the leak.
Revenge trading: what to do right after a loss
Revenge trading is taking a new position to win back a loss, and the answer is a rule you set before the session: after a loss, a fixed time with no new order and no larger size. Professionals do this too. Coval and Shumway (2005) studied Chicago Board of Trade proprietary traders and found them "regularly assuming above-average afternoon risk to recover from morning losses". We could read the abstract, not the paper, so the sample comes from the CFA Institute's digest: 1,082 bond futures traders in 1998, taking above-average risk 31.2% of the time after a morning loss and 27% after a morning gain. Prices they set reversed faster than others, and the authors read that as the market telling their trades apart from informed ones. That is futures, in 1998, but it is the best field evidence we found that the urge is real.
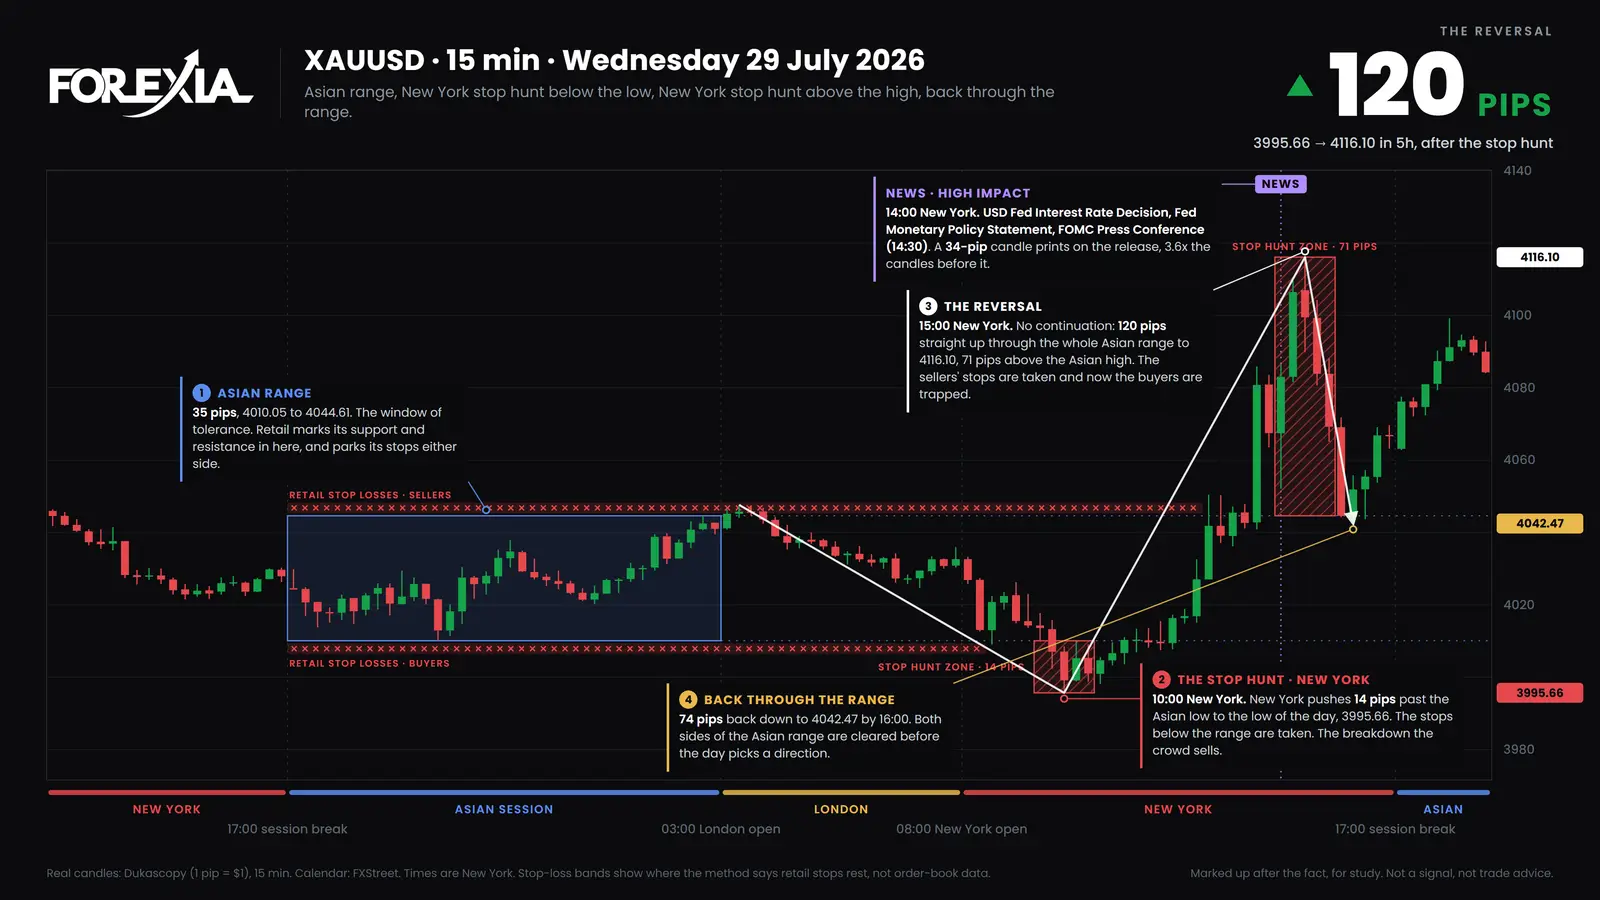
Gold on Wednesday 29 July 2026 shows what the sequence can look like, with one honest qualification: nothing shows that any one person traded it this way. On gold we count $1 as 1 pip. The box ran from 4010.05 to 4044.61.
The first loss. The 10:00 New York candle fell to 3995.66, 14 pips under the box, and closed at 3999.11. It looks like the breakdown to sell. A seller there with a stop just over the box low was out by the 11:15 candle, which reached 4011.07 and closed at 4010.28. About 11 pips.
The revenge. Now the same trader watches price climb without them. The Fed's decision comes at 14:00 and that candle closes at 4080.78, up 38 pips. The press conference starts at 14:30. The 14:45 candle closes at 4106.44. This is the moment it feels unbearable: you were on the wrong side all day, and now the other direction is running away. A buyer on that close with a stop under the candle's low at 4081.59 is risking 25 pips, more than twice the first loss on the same lot size.
The second loss. The 15:00 candle printed 4116.10, 120 pips off the low. The 15:15 candle fell through 4081.59. By 16:00 price was at 4042.47, 74 pips off the high.
Days this two-sided are not the norm. By our definition, a day with a stop hunt of each side of the Asian range came on 8% of gold's days, and 4% to 12% on the seven dollar majors, from January 2021 to 1 October 2026 (1,488 trading days). A hunt there means the day's extreme printed beyond the range, then price reversed at least 0.4 of the average daily range back inside it. So this is a bad day picked to show the sequence, not a normal one.
What to do, in order:
- Leave the order screen for a fixed time you chose before the session. Close the ticket, not just the position.
- Do not raise your size. A bigger next trade is the plainest sign this has started.
- Write one line. What was the trade, did you follow your plan, and what do you want to do right now?
- Sort the loss. A loss inside your rule is a cost of the rule. A loss from breaking it is a different problem. Stop too tight or hunted helps with the first kind.
You will read that the right pause is 5, 15 or 30 minutes. Those are conventions. We found no controlled study of any of them on retail traders, and we do not claim the routine improves results. How to stop revenge trading walks through the first 15 minutes.
Why you take trades you know you should not
You take them because knowing a rule and following it under pressure are different skills, and research points to three pulls working against the rule. None was measured on forex, so treat them as the nearest evidence we have.
- Attention. Barber and Odean (2008) found individual investors tend to buy what has just grabbed their attention: stocks in the news, with unusual volume or extreme moves. A long candle does that on a chart.
- Entertainment. Dorn and Sengmueller (2009) studied 1,000 German brokerage clients. Those who said they enjoyed investing or gambling turned over their portfolios at twice the rate of their peers.
- Overconfidence. The heaviest traders in the 66,465 households above did worst, and the authors read that as overconfidence. It is an inference from the trading, because nobody measured confidence directly.
GBP/USD on Friday 31 July 2026 shows how they can feel together. The box ran from 1.34402 to 1.34710. From 07:00 New York the pound slid, and by 08:30 it had printed 1.34140, 26 pips under the box. You missed it. You tell yourself you will not chase.
At 09:15 a candle dips to 1.34093, jumps back to 1.34330 and closes at 1.34306. Relief: maybe you were right to wait. Then the 09:30 candle opens at 1.34307 and falls to 1.34000, 40 pips under the box and 14 pips past the 08:30 low. It is the move you missed, offered a second time. Every pull is there at once: a long candle, a morning of watching, and the belief that you have read it now.
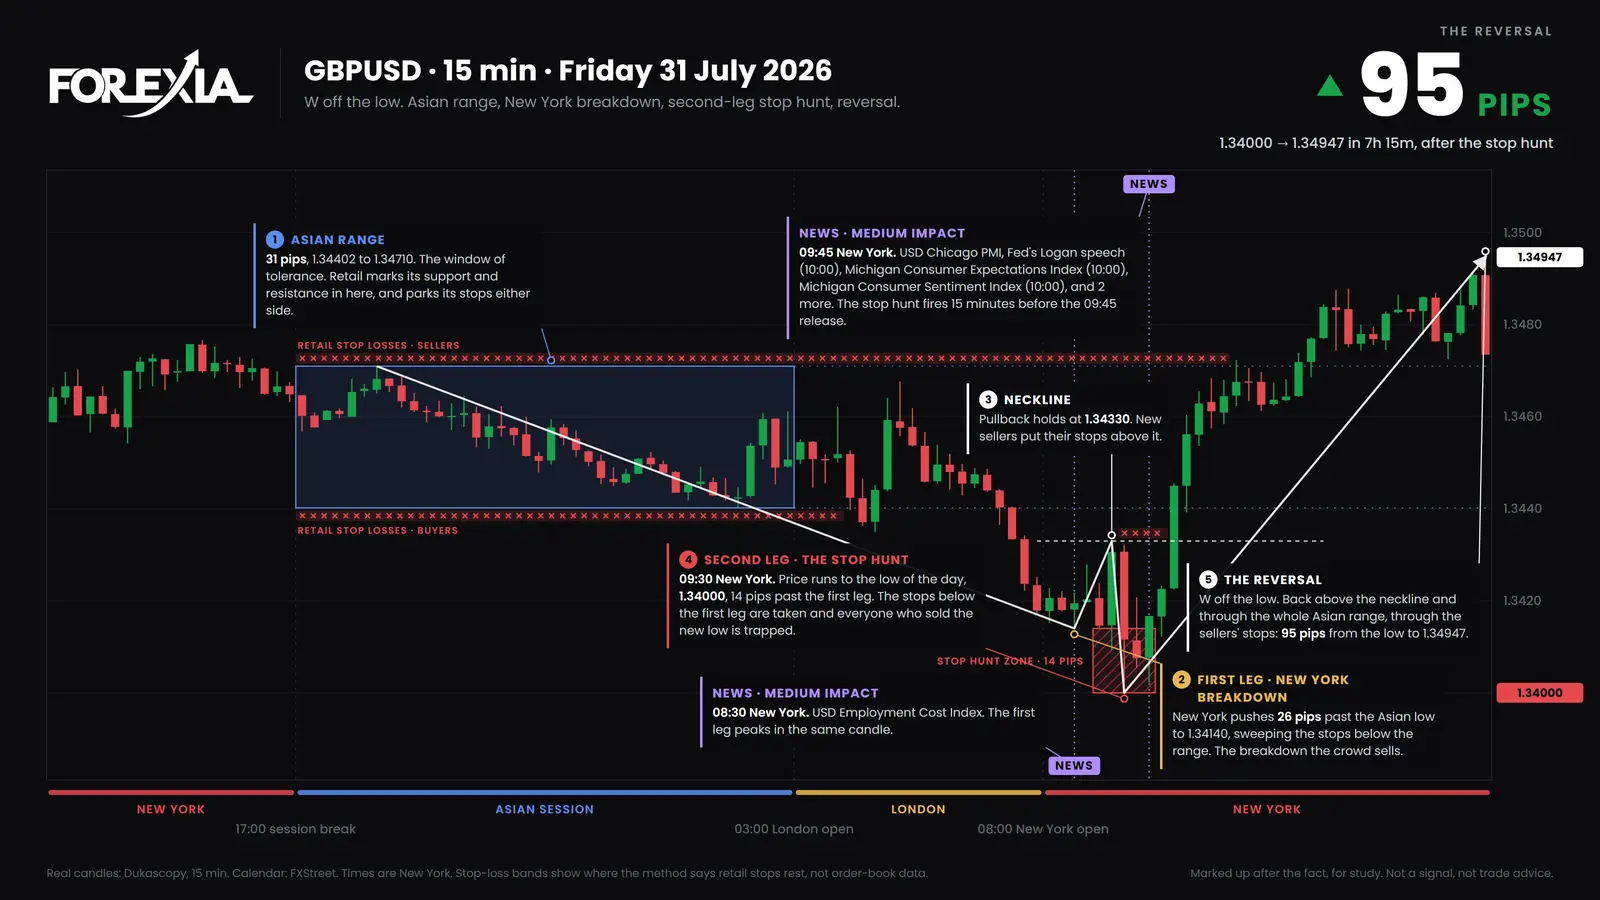
The 10:30 candle went through 1.34330 and closed at 1.34450, back inside the box, so a stop over the last pullback was gone. By 16:45 price was at 1.34947, 95 pips off the low. On this chart the shape is half of M & W Reversals, with the Second Leg Climax as its low. Some chases do run, as USD/CHF shows further down, and this one is here because it failed. The point is the state you were in, not the outcome.
One practical test: write your reason before the click. If the sentence names a candle that just moved, a price you missed or a loss you want back, you can see what is driving the trade while you can still act on it. Why you take trades you know you shouldn't goes through more of them.
Is forex gambling? A plain answer
Forex is a real market, but a trade can still be a gamble. Currencies change hands for real reasons all day, and forex as a market is a different question from what is sold around it. What makes a trade a gamble is why you took it, and whether you have any reason to expect a gain after costs.
The research supports the comparison. Gao and Lin (2015) found that when Taiwan's lottery jackpots passed 500 million Taiwan dollars, trading volume fell between 5.2% and 9.1% in the stocks individuals favour. When the lottery got more exciting, some of the trading went away. That is stocks, and it does not show that any one trader is gambling.
Asking this of your own last ten trades will tell you more:
- Could you say, before entry, why you expected a gain and what would prove you wrong? If not, it was closer to a bet.
- Do you know your result after spread and commission? If you keep no record, you do not know which you are doing.
- Did your size go up after losses? That is chasing.
- Would you still take the trade if it were boring?
Good answers do not make you profitable. A careful, repeatable rule can still lose: ours did. They only tell you that you are running a test and not a slot machine. Forex trading vs gambling draws the line in more detail.
There is a clinical side too, and we are not clinicians. A 2025 systematic review of 23 papers called problematic trading a "new potential clinical disorder" that still needs defining, and found psychologists tend to fold it into gambling. It is not a recognised diagnosis of its own. Chasing losses is one of the signs the American Psychiatric Association lists for gambling disorder, though. If you are hiding losses, borrowing to trade or cannot stop, talk to a doctor or a gambling support service. That matters more than anything on this page.
Mindset from the observer's seat
A trading mindset, as we use the phrase, is a habit of separating what you know from what you are guessing. It is not confidence, and it is not calm. A calm trader in the first seat is still in the first seat.
That habit has to survive a day when your read is wrong. USD/CHF on Tuesday 14 July 2026 is that day. The box ran from 0.81320 to 0.81513. The 04:00 New York candle closed under it, at 0.81301. Anyone who has learned about stop hunts wants to call that a hunt and buy it, or to hold the buy they already had. "The close back is coming."
It never came. US inflation at 08:30 printed a 50-pip candle. By 10:00 price was at 0.80604, 72 pips under the box. No candle closed back over 0.81320 for the rest of the day, and the sellers of the break were right.
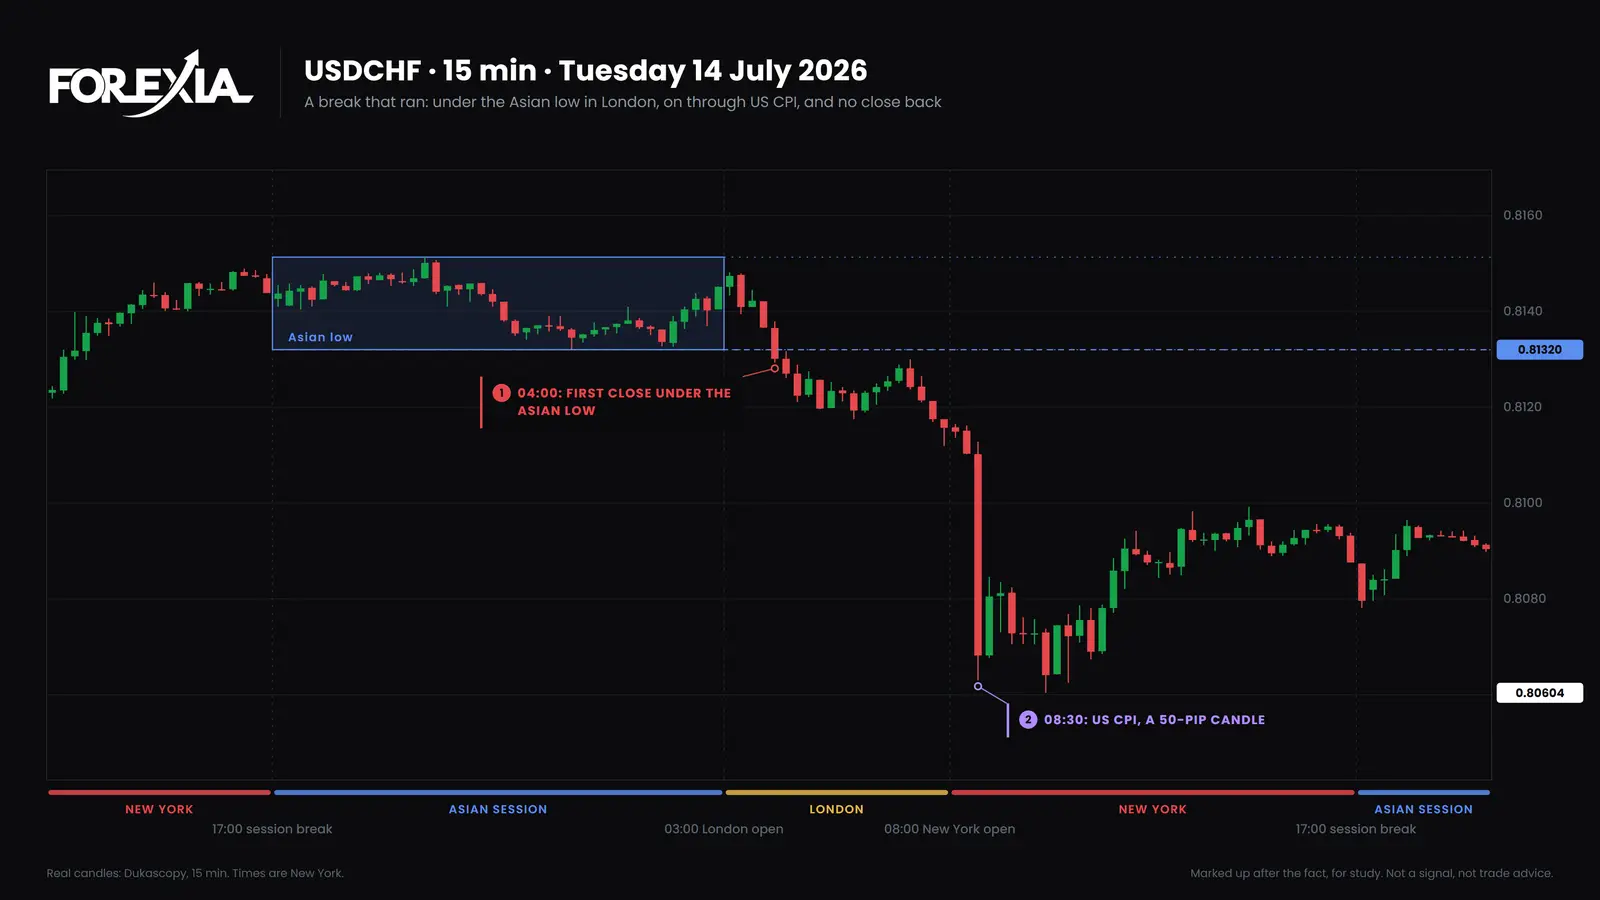
The count says this is not rare. Across seven dollar majors and gold, from 6 April to 1 October 2026, we counted every edge of the box and previous-day level traded through after the London open by at least 3% of the average daily range: 1,601 of them. On 291 no candle had closed back by 17:00 New York, and those ran a median of 65% of the average day past the level. The ones that did close back had run a median of 9%. And a close back is not the end either: on 825 of the 1,310 that closed back, a later candle that day went past the furthest price anyway.
So the observer's habit is modest. On USD/CHF that morning it meant saying what the 04:00 close showed and what it did not. A close can be overturned, and it names no direction for the afternoon.
The research on the person is thin and encouraging in one respect. Lo, Repin and Steenbarger (2005) followed 80 day traders for five weeks. Those whose emotional reaction to gains and losses was more intense did significantly worse, and personality tests showed no single "trader personality profile". That was a small group, and it shows a link and not a cause. Fenton-O'Creevy and colleagues (2011), in a qualitative study in four London investment banks, found an advantage for traders who managed emotion before it arose over those who handled it afterwards. That points toward preparing, and those are professionals. Coates and Herbert (2008), on 17 traders on a London floor, found cortisol rising with the swings in a trader's results and with market volatility. Your body is in the trade, whatever you decide. Whether forex is hard has a good deal to do with sitting through that.
Common mistakes, and a one-page routine
The common mistakes are mostly about taking a psychological answer to a question that is not psychological.
- Treating every loss as a discipline problem. Some rules lose. Test the rule first.
- Calling every stop-out a hunt. Sometimes price just went there, and why your stop loss always gets hit separates the cases. Blaming the market is comforting, and no chart can show that a candle was aimed at you.
- Turning the book upside down. Doing the opposite of every pattern is one more fixed instruction. USD/CHF on 14 July would have punished it.
- Trusting a chart you saw afterwards. This page included. We only mark up days after the fact.
- Buying a calmer mind as a strategy. A calm person can run a losing rule for years.
- Paying for the ten percent. Any pitch offering to put you among the winners is using the saying as a sales line.
Here is a routine that fits on one page. It is for seeing what you do. It is not an edge, and we have no evidence that it raises anyone's results.
Before the session
- Mark the obvious levels, where the book tells everyone to act. That is Liquidity Mapping.
- Write your largest size and your largest loss for the day.
- Write how long you stop for after a loss.
- Note the releases due, and how you tend to act around them.
Before each order
- One sentence: why this, and what proves it wrong.
After a loss
- The steps from the revenge trading section, in order.
At the end of the day
- Log every trade taken, and every one you wanted and did not take.
- For each: followed the plan or not, and what you felt.
- Once a month, compare the result of the trades that followed the plan with those that did not, after costs.
What is known about trading psychology, and what is not
Plenty has been measured about what traders do, and very little about what would change their results. This is where the evidence stood when we searched in October 2026, and a gap here means we did not find it, not that it cannot exist.
Reasonably well shown
- Most retail CFD accounts lost money in the samples regulators have published.
- People tend to bank gains and hold losses, trade more than pays, and buy what catches their eye.
- Traders, professionals among them, have been found adding risk after losses.
Not known
- How much of retail losses comes from psychology, as against costs, leverage or having no edge. We found no study that splits them. The claim that trading is "90% psychology" has none behind it that we could find.
- Whether a journal, a cool-down or a routine improves a retail trader's results. We found no controlled study.
- Whether reading from three seats does. Nobody has tested it, and our own test of the setup as a fixed rule, which is on the stop hunt page with its costs and limits, did not make money. That test does not measure a person reading a chart.
- Who was on any candle on this page. The middle seat is our inference.
- Almost all of this research is on stocks or futures, so applying it to retail forex is a reasonable step and still a step.
More real days are in our forex chart markups, every week, and they carry the same warning: each one is picked after the fact.
Course 1 of ForexiaPRO, Reading the Map, teaches this read step by step, from lesson 1.1.1, The Chart You Were Taught to Read, to lesson 1.1.3, Dumb Money and the NPC.
Start here
- What Is Trading Psychology? It Starts With Which Seat You Read the Chart From
What is trading psychology? Emotion, habit and the seat you read from. Two real 2026 days, AUD/USD and USD/CHF, show the textbook read and what came next.
Questions
- How to Stop Revenge Trading: What to Do in the 15 Minutes After a Loss
How to stop revenge trading: our untested routine for the 15 minutes after a loss, a check on your history, two real days, and what research does not show.
- What Is Perceptual Positioning in Trading Psychology?
What is perceptual positioning in trading psychology? Where the idea comes from, what it asks of each seat, and a real day the read changed three times.
- Why Most Traders Lose: What Regulators Counted, and the Predictable Trader Education Builds
Why most traders lose: regulators' figures at source with dates and limits, what nobody has measured, and two real days where the trader did nothing wrong.
The words
- Dumb Money: What It Means, and Where Dumb Money vs Smart Money Goes Wrong
Dumb Money is the predictable retail herd the chart is built to trap. EUR/USD on 30 September 2026, what the phrase means, and how many breaks run.
- Perceptual Positioning: The Trading Psychology of Reading One Chart From Three Seats
Perceptual Positioning is reading one chart from three seats. Trading psychology on a real candle, gold on 30 September 2026, with where the idea stops.
- The 90-90-90 Rule: The Saying About Why Most Traders Lose Money, and What Is Actually Known
The 90-90-90 Rule is a saying, not a statistic. What a regulator's figures show, what nobody has measured, and how to lose on AUD/USD while being right.
- The NPC: What Trading Education Turns You Into, and One Reason Most Traders Lose
The NPC is the predictable bot trading education builds. How it behaved on USD/CAD on 1 October 2026, and one part of why most traders lose.
- The Three Seats: Retail Trader vs Market Maker, and the Observer Who Reads Both
The Three Seats are retail, market maker and observer. One candle read from each, GBP/USD on 24 September 2026, and what retail vs market maker misses.
Frequently asked questions
What is trading psychology?
Trading psychology is how emotion, habit and belief change what a trader does: what they enter, hold, close and repeat. Fear, greed and discipline are part of it. So is where you were taught to stand on a chart, and how many other traders stand there with you. It does not turn a losing rule into a winning one.
Why is trading psychology important?
Because the same rule can be run in very different ways. Studies of real traders have found people holding losers, adding risk after a morning's loss and trading more than their results justify. Psychology can make a sound plan worse. It cannot make a plan sound, and our own program, which has no emotions, still lost money on a fixed rule.
Why do most traders lose money?
Nobody has measured the full answer. EU regulators reported in 2018 that 74-89% of retail accounts typically lose money on CFDs. Costs, leverage, having no edge and behaviour all play a part, and we found no study that splits the loss between them. Our own addition is that a crowd taught the same patterns is predictable, which is a reading and not a measurement.
What is revenge trading and how do I stop?
Revenge trading is taking a new position to win back a loss, usually bigger and with less reason than the last. The practical answer is a rule set before the session: after a loss, a fixed time with no new order and no larger size. It is common advice and sensible, but we found no controlled study showing that it improves results.
What should I do right after a losing trade?
Leave the order screen for a fixed time you chose in advance. Write down what the trade was, whether you followed your plan, and how you feel. Do not raise your size. Then ask whether the loss came from your rule or from a break in your rule, because those need different fixes.
Why do I take trades I know I should not?
Knowing a rule and following it under pressure are different skills. Research points to three pulls: attention, since people buy what has just grabbed their eye; entertainment, since traders who enjoy it trade far more; and overconfidence. A long candle after a quiet morning brings all three together. Writing your reason before the click is one way to see it happen.
Is forex gambling?
Forex is a real market, but a trade can still be a gamble. It works as one when you cannot say why you expect a gain after costs, or when you are trading for the thrill or to win back a loss. Careful habits do not prove the opposite: a disciplined rule can still lose, and only a record of your own results after costs can show which you are doing.
Is trading 90% psychology?
We found no study behind that number. It is a saying, like the 80% version. Behaviour clearly matters, but a program that traded a fixed rule with no fear or greed still lost money in our test. That loss came from the rule and its costs, and no amount of calm would have changed it.
How do you build a trading mindset?
Treat it as a habit of separating what you know from what you are guessing: what has printed so far, against what you expect next. Keep a record of what you did and felt. One study of 80 day traders found no single trader personality, which raises the possibility that this can be practised. Practice does not promise a result.
What is the best book on trading psychology?
No book has been tested against results that we know of. Thinking, Fast and Slow by Daniel Kahneman is the research behind loss aversion. The Hour Between Dog and Wolf by John Coates covers the body under risk. Trading in the Zone by Mark Douglas and Brett Steenbarger's books are practitioners' views, widely read and useful as that.
The latest chart markups
- Reverse Price Action: How to Read a Forex Chart Markup
Reverse price action reads a chart from the side of the crowd: where retail orders and stop losses sit, and how price collects them. A visual guide.
- Forex Chart Markups: Weekly Stop Hunt & Reversal Archive
Forex chart markups, week by week: stop hunts, M and W formations and midweek reversals on the majors and gold, drawn on real candles.
- EURUSD Stop Hunt: Forex Chart Markups, 28 September 2026
An EURUSD stop hunt through Tuesday's high on US PCE data completed an M formation and fell 165 pips. Chart markups, 28 September 2026.