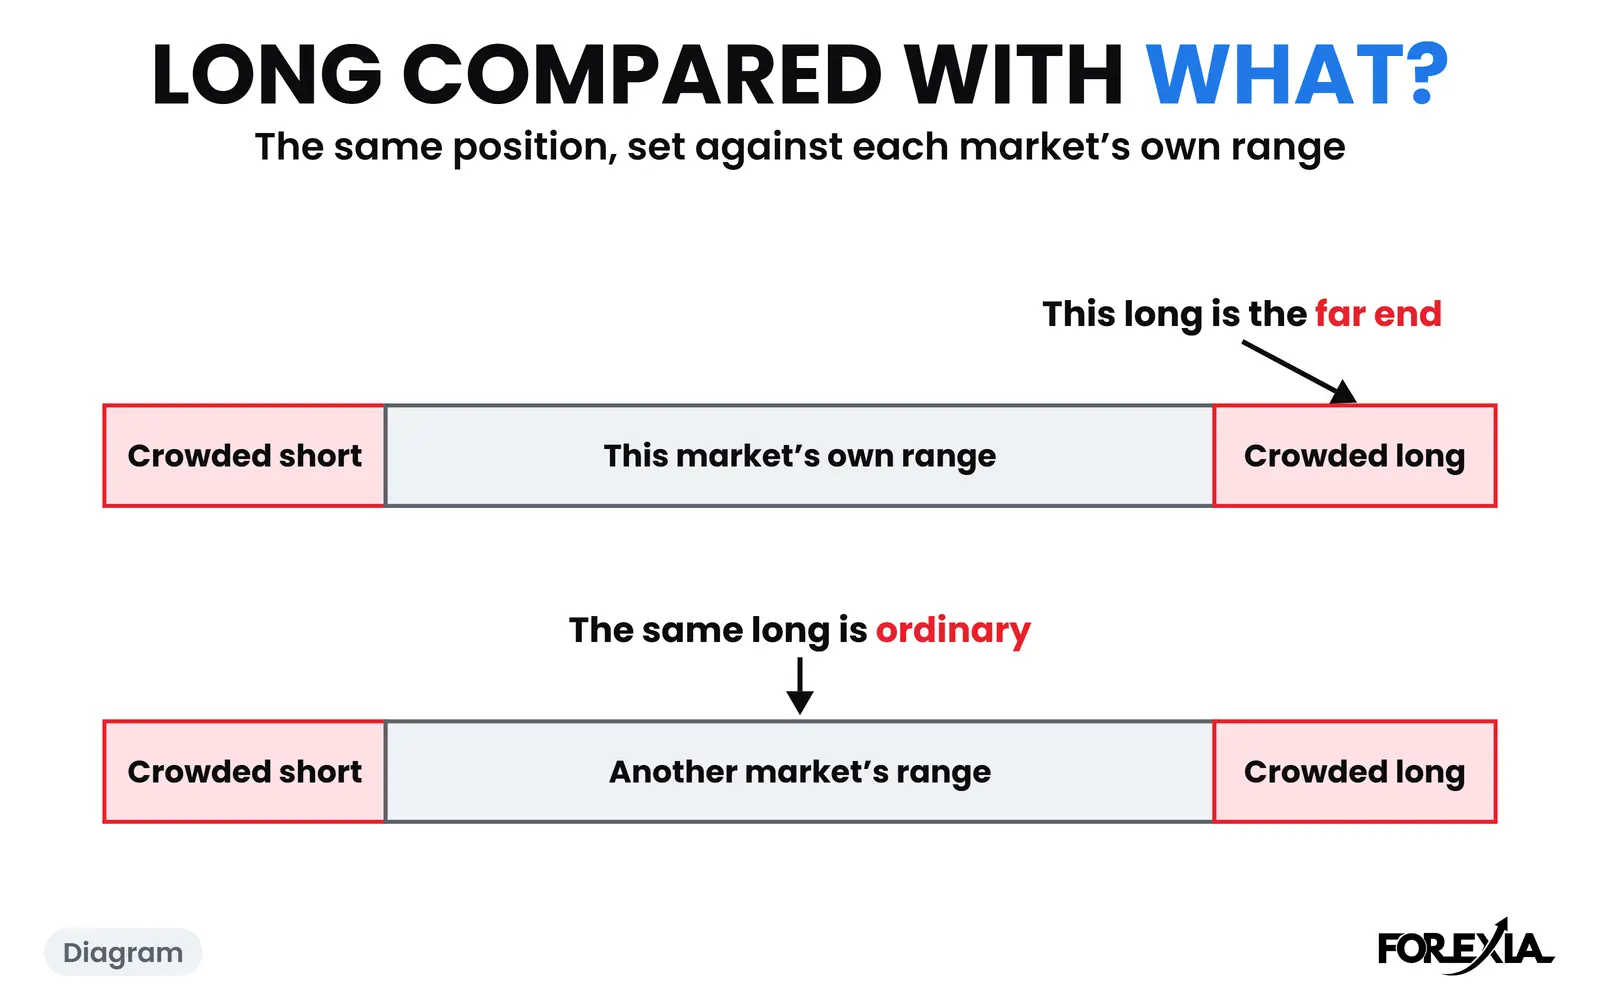
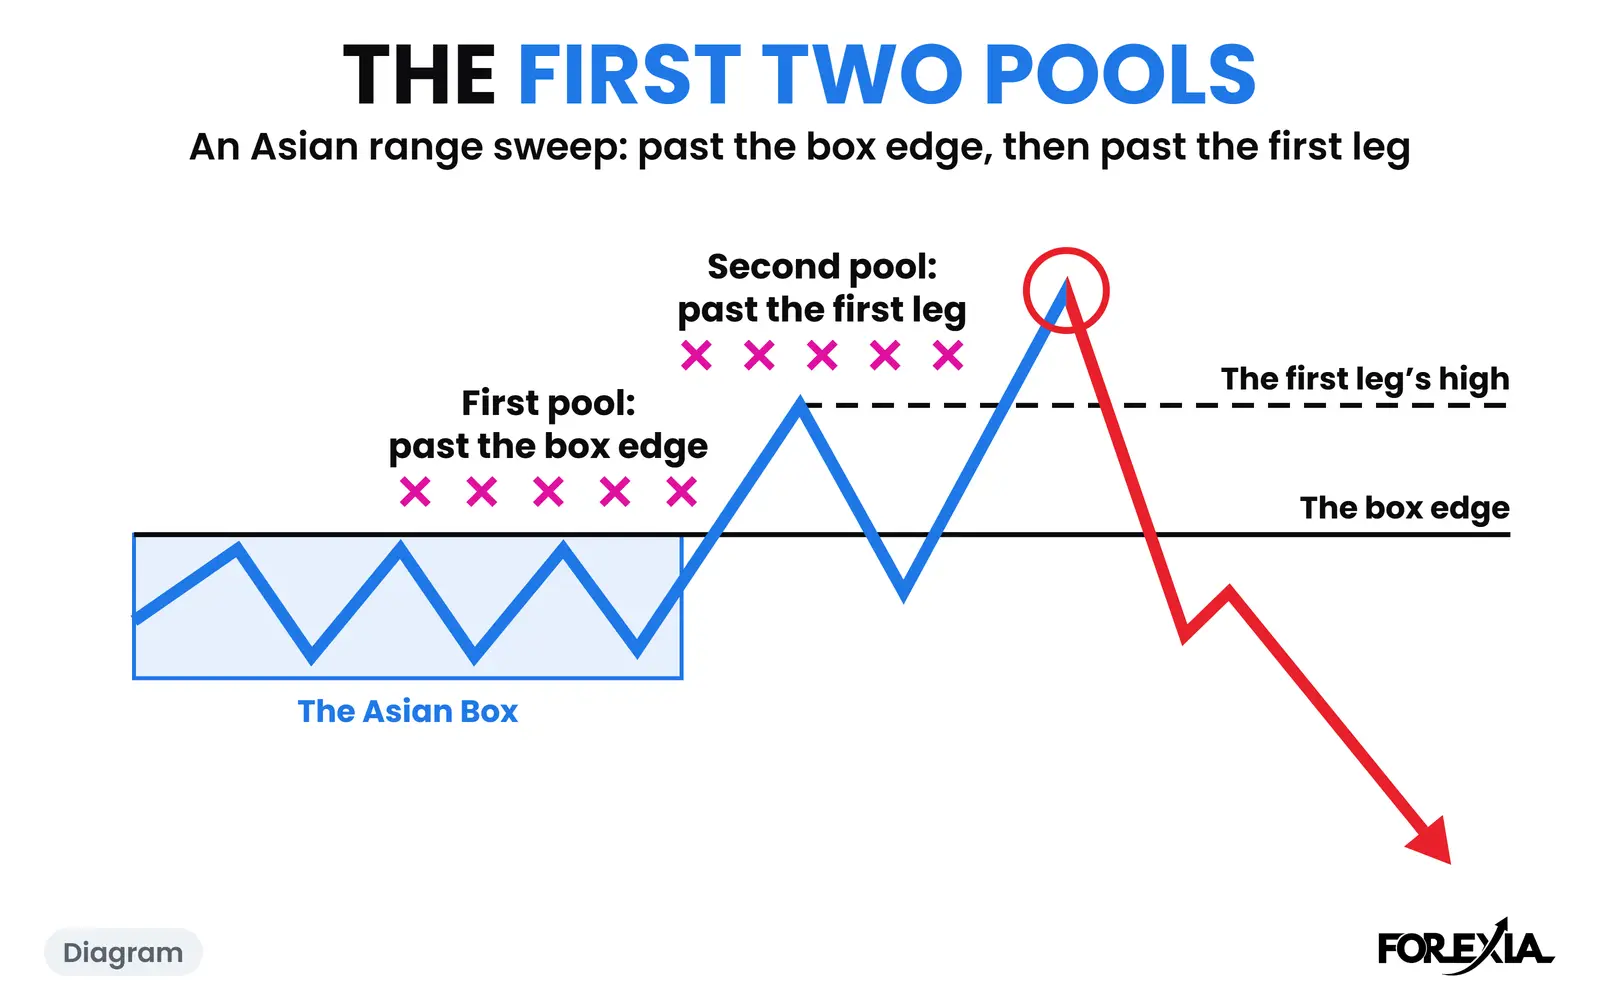
Why Most Traders Lose: What Regulators Counted, and the Predictable Trader Education Builds
Dylan Forexia9 min read
Why most traders lose has no measured answer. Regulators have counted that most retail clients lose in their samples, at rates from 63% to 89% in the forex and CFD figures we read, depending on the product, country and period. Leverage, costs, having no edge and behaviour all play a part, and we found no study that splits them. Our own addition, that education builds a predictable crowd, is a reading.
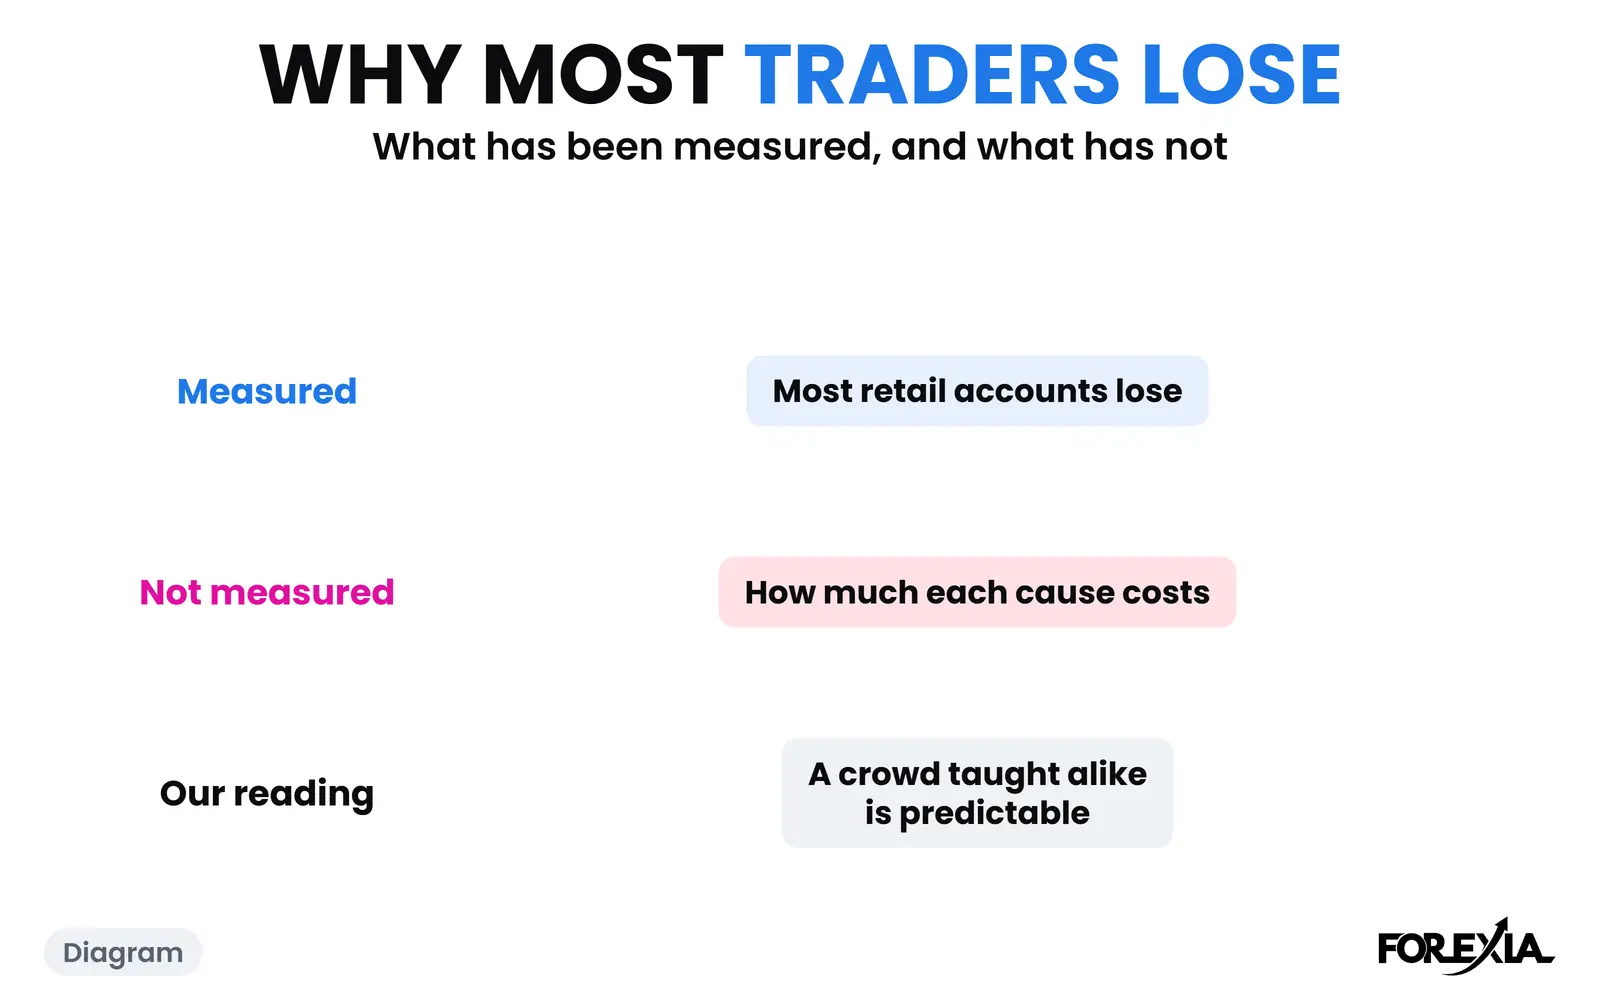
We sell a trading course, so read this page with that in mind. It does not say that reading a chart our way fixes the problem. We have no evidence that it does.
What have regulators measured about why most traders lose?
They have measured that most lose, and they do not say why in numbers. These are their published figures, at source.
| Regulator and date | What it covered | What it found | Its limit |
|---|---|---|---|
| AMF, France, October 2014 | 14,799 active retail clients at regulated firms, 2009 to 2012: rolling spot forex, CFDs and binary options | More than 89% lost over the four years. Average loss nearly €10,900, median €1,843 | France only, products lumped together, some firms and not all |
| FCA, UK, December 2016 | A sample of client accounts at eight CFD firms, from its 2015 review, over a year. Here CFDs include spread bets and rolling spot FX | 82% of clients lost money. Average result a loss of £2,200 | UK only, one sample. The paper itself says "over 80%" |
| ESMA, EU, 27 March 2018 | National regulators' findings on retail CFD accounts | 74-89% of retail accounts typically lose money. Average losses per client of €1,600 to €29,000 | CFDs, before its leverage limits. It counts accounts, not people |
| ASIC, Australia, August 2019 | Its 2017 review of retail OTC derivatives | 63% of clients trading margin FX lost money, and 72% of those trading CFDs | Australian issuers' clients, most of them offshore. The nearest figure to forex alone that we found |
Further from forex, India's SEBI headed its release of 23 September 2024 with 93% of individual traders making losses in equity futures and options between FY22 and FY24. That is a different market, included as a recent figure from a regulator.
Three things about those numbers get lost when they are quoted.
Average and median tell different stories. The AMF's average loss was nearly €10,900, and its median was €1,843. So half of those clients either lost less than €1,843 or made money, and a smaller group lost far more. In total, 13,224 clients lost nearly €175 million, and the other 1,575 made €13.8 million between them. "The average trader loses eleven thousand euros" would be a false picture of that table.
They are old, and products change. Most of the data is from before Europe's 2018 leverage limits. ESMA's measures also made each CFD provider publish the share of its own retail accounts that lose, so your broker's current figure may be on its own risk warning. It describes that one firm.
They count accounts or clients at sampled firms. One person can hold several accounts. Nothing here measures every trader. We also found no document behind the US figure of 70% to 80% that gets repeated online, so we do not use it. The saying that ninety percent lose ninety percent in ninety days is the 90-90-90 Rule, and it has no study behind it at all.
Why do most forex traders lose money? The usual reasons, and what backs each
Each usual reason has some evidence, none has a share of the blame, and they overlap. This is how far each goes.
- Leverage. ASIC says high leverage ratios "amplify losses and costs". The FCA says the same of profits, losses and the costs of trading. That explains how fast an account can go. It does not explain why the direction was wrong.
- Costs and trading too much. The AMF found that those placing at least 250 orders over the four years, 52% of its sample, lost €18,741 on average. Those placing 1,000 or more, 23% of the sample, lost €31,349. More orders went with bigger losses. Part of that is simply larger or longer activity, and the AMF's figures do not separate them.
- Having no edge. This is the one traders least like. We ran our own setup as a fixed rule, with no emotion in it, and it lost money after costs. That loss had nothing to do with discipline.
- Behaviour. Holding losers, chasing and adding risk after a loss have all been found in real traders. The trading psychology hub sets out those studies with their limits. Nobody has shown what share of retail losses they account for.
- No plan. This is on every list and it is sensible. We found no study that measures it on retail forex traders.
If you are asking why you lose money trading, in particular, those five are a checklist and not a diagnosis. Only your own record after costs can sort them.
Does experience or a course fix it?
The evidence we found says not by itself. The AMF followed the traders active in all four years, nearly 2,000 of them. In 2009 more than 82% of them lost money, at €4,989 on average. Over two years it was more than 85%, at €10,183. Over all four it was nearly 88%, at €26,745. The AMF's own heading for this was "no learning over time". A loss that adds up over four years is partly just time passing, but there is no sign of improvement in it.
Hayley and Marsh, writing in the Journal of International Money and Finance in 2016, studied retail FX traders on one platform and reported "no evidence that retail FX traders learn to trade better". They did find that traders learn about their own ability, and trade less after a losing day. We read that paper in its abstract.
On courses, we searched for a controlled trial showing that a trading course raises a retail trader's returns, and found none with published results. That is one search and not proof. It covers our own course as well as everyone else's.
What does the NPC add to the answer?
It adds what a crowd does together, as a reading and not a measurement. The NPC is what trading education turns you into: a predictable bot who follows the trend and asks no questions. Dumb Money is our word for the crowd those traders make. The argument is that teaching the same patterns and stops to everyone makes the entries and the exits easy to find.
USD/CAD on Thursday 1 October 2026 shows what that can look like. London reached 1.42582 at 06:00 New York, and price pulled back to 1.42316 by 09:45. At 11:30 a candle opened at 1.42498, made a new high of the day at 1.42623, 4 pips past London's high, and closed at 1.42517, back under it. No release for either currency lined up with that candle. By 16:45 price was at 1.42196, 43 pips lower and under the pullback where a buyer's stop would sit.
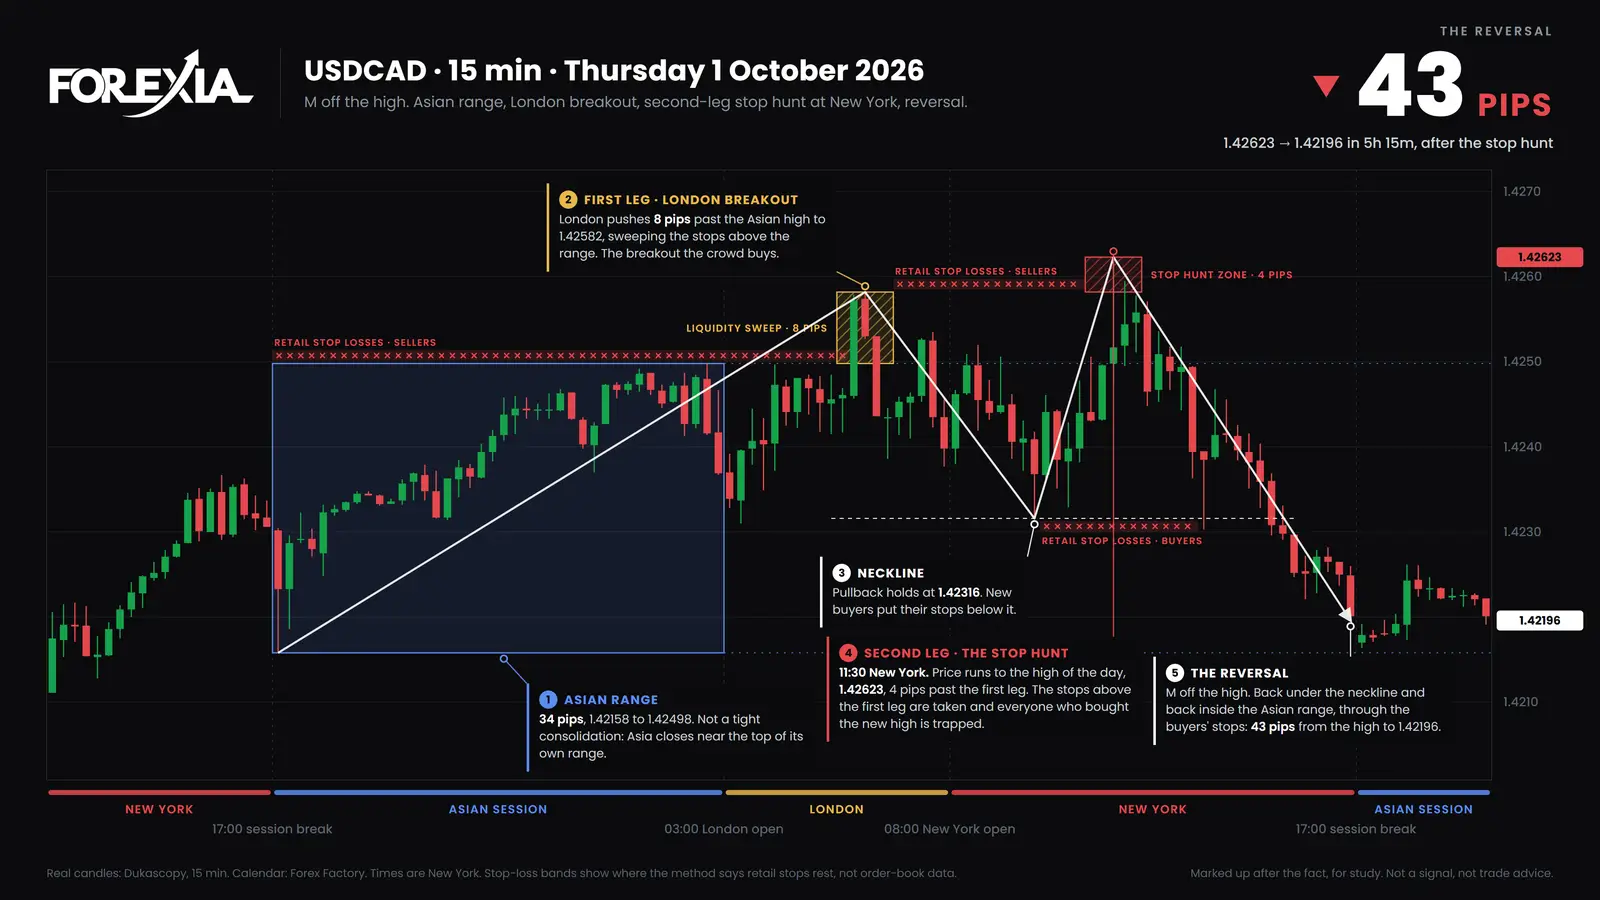
A regulator's table cannot see that buyer. Nobody can count who was in that candle, and one day proves nothing about how often this happens. Many new highs keep going. How one trader ends up there has its own page.
Can a trader do everything right and still lose?
Yes, and that is why "be more disciplined" is an incomplete answer. USD/CAD on Friday 21 August 2026 is an example.
The box ran from 1.37583 to 1.37871. The 04:00 New York candle closed at 1.37541, the first close under it. Take the seller the book describes: in on that close, with a stop back at the bottom of the box, 1.37583, a risk of about 4 pips. That is a plan, a small stop and a clear reason. By 08:00 price was at 1.37318, that seller 22 pips ahead. No rule said to leave, so the trade stayed on.
Canadian retail sales, medium impact, came at 08:30. US PMIs came at 09:45. The 10:00 candle touched 1.37583, and the 10:15 candle went through it, so the stop went. By 10:45 price was at 1.37772, 45 pips off the low.
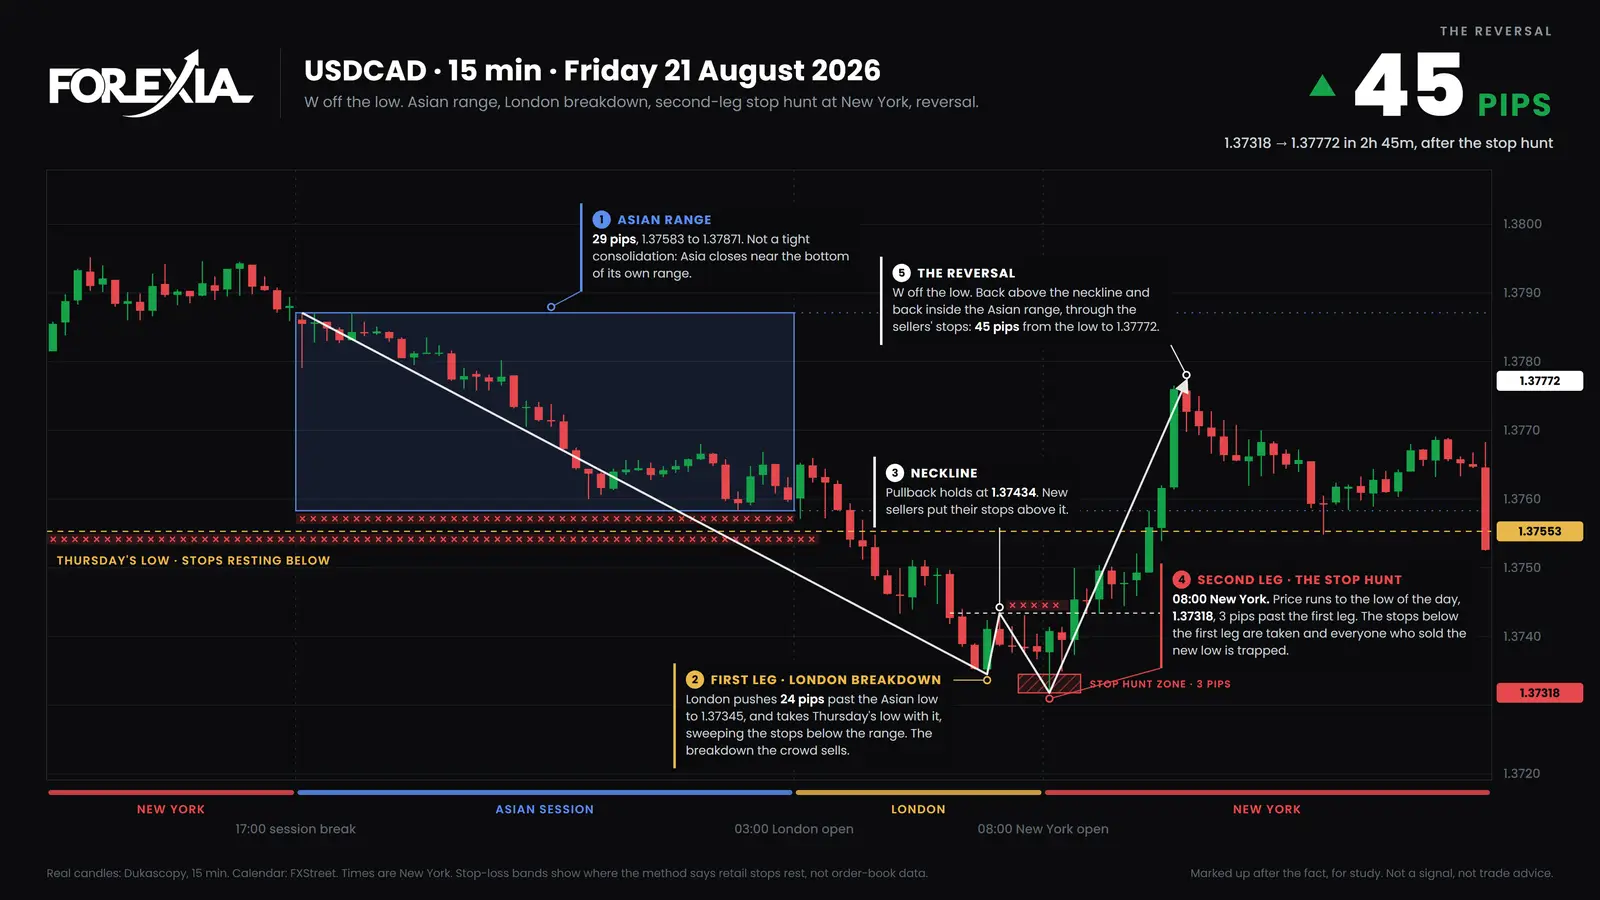
The last candle of the day closed at 1.37526, under that seller's entry. So the direction came, the discipline held, and the trade lost. We are not saying a trader should have done something else that morning. A reversal seen afterwards is not a setup, and plenty of days the same stop would have held.
Does reading the chart fix it?
We do not know, and we will not tell you it does. Here is what we can say.
It can change what you see on a chart. It does not touch leverage or costs. Our own test of this setup as a mechanical rule did not make money, and it does not measure a person reading a chart in either direction. We hold no figure showing that people taught this read lose less than people who were not. Anyone who offers to put you among the few who win, using the percentages above as the setup, is using a regulator's warning as a sales line. What is trading psychology goes through the part that can be practised.
The most useful thing you can do costs nothing. Keep a record of every trade after spread and commission, for long enough to matter. It is the only number on this page that is about you.
Common mistakes
These are mistakes in reading the figures, not in trading.
- Quoting one number as "the" figure. 63% and 89% measure different products, countries and years.
- Assuming the rest made money. A client outside a losing count may have broken even or barely gained. In the AMF's table the 1,575 who gained made far less in total than the others lost.
- Taking a cause from a percentage. No regulator's table above says why anyone lost. Any page that gives you one reason has added it.
Course 1 of ForexiaPRO, Reading the Map, covers the NPC and Dumb Money in lesson 1.1.3, Dumb Money and the NPC.
Frequently asked questions
What percentage of forex traders lose money?
There is no single figure. The nearest to forex alone is Australia's regulator, whose 2017 review, published in 2019, found 63% of clients trading margin FX lost money. France's AMF found more than 89% over 2009 to 2012, across forex, CFDs and binary options. Each covers one country, some products and one period, and most count accounts or clients at sampled firms.
Is it true that 90% of traders lose 90% of their money in 90 days?
We found no study behind that. It is a saying, and the 90-90-90 Rule page takes it apart. Regulators' figures show that most retail accounts lose in their samples, and none of the ones we read says anything about ninety percent of the money or about ninety days.
Why do traders still lose after a trading course?
Nobody we can find has measured it. We found no controlled trial with published results showing that a course raises a retail trader's returns, and that includes our own. One reason may be that a course teaches the same patterns and stops to everyone, which is our reading and not a finding.
Will learning to read the chart stop me losing?
We cannot promise that, and nobody honest can. We ran our own setup as a fixed rule and it lost money after costs, and we hold no figure showing that people taught this read do better. It can change what you see. Whether it changes your results is something only your own record, after costs, can show.