
Institutional Trading in Forex: Who Really Trades, and What You Cannot See
Institutional trading is buying and selling by organisations rather than individuals: banks, funds, insurers, companies and central banks. In forex, most of it passes through dealers, who quote prices and take the other side. "Smart money" is a nickname for these players, not a category any regulator or survey uses.
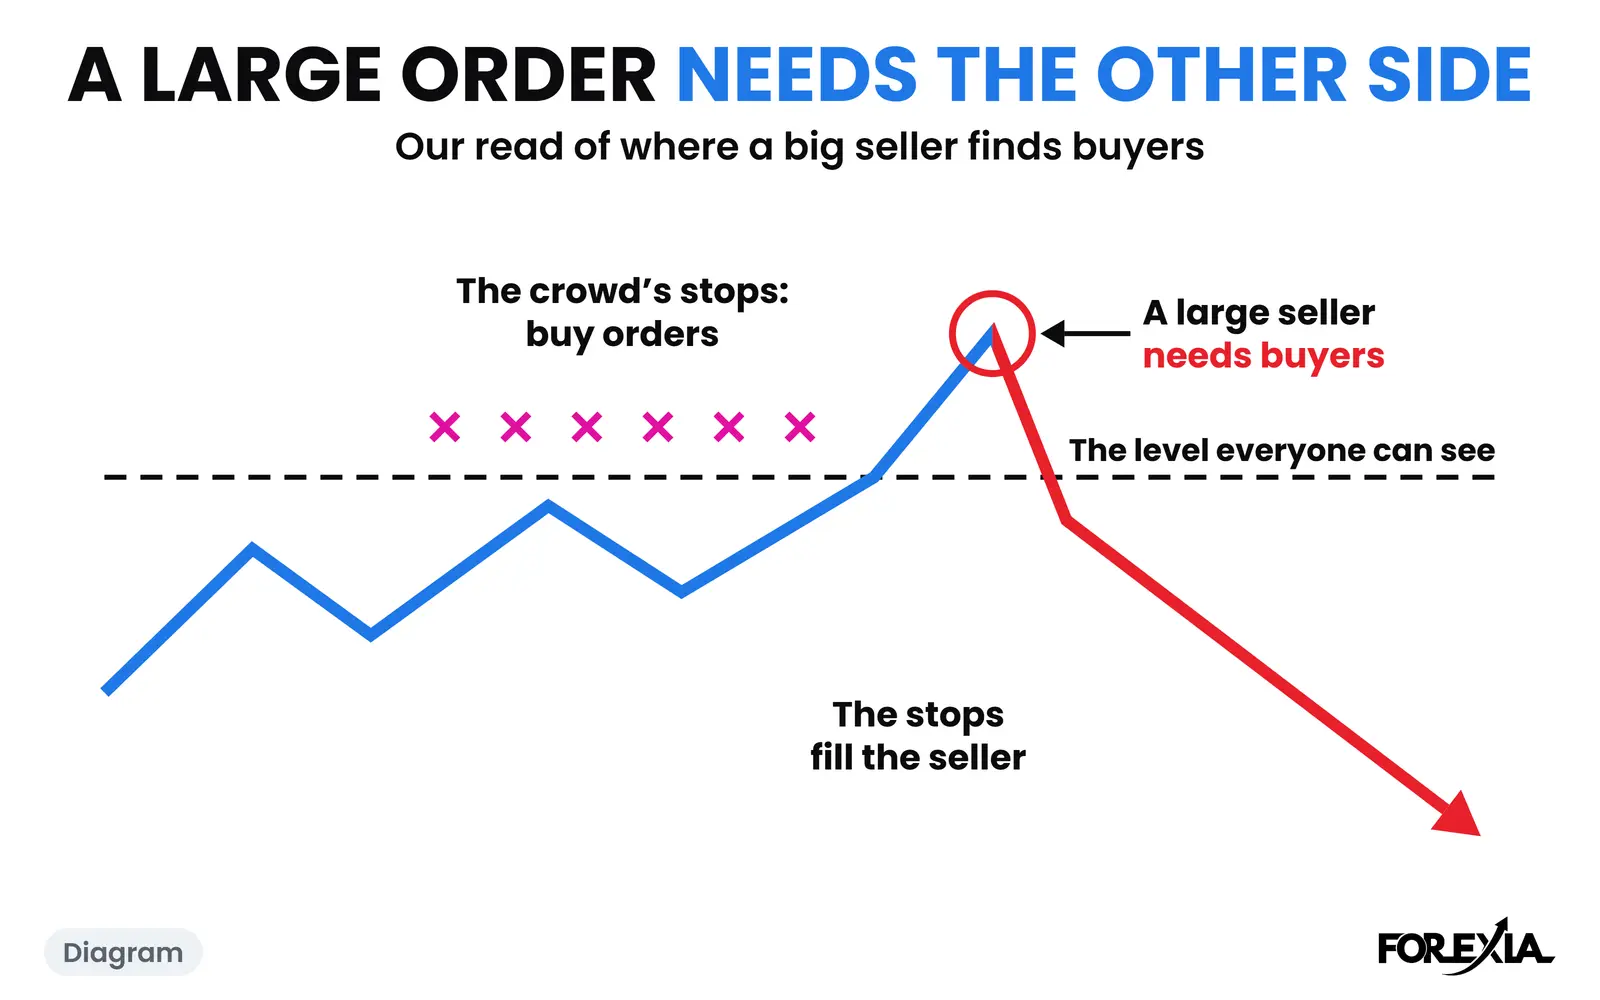
This page keeps three things apart. What is known comes from the Bank for International Settlements, central banks and the rules brokers work under. Our read is that market makers build the chart, and we label it as a read each time. What nobody outside can know is said plainly, on three real dated days. On one of them a government may have made most of the move, and our chart could not tell.
What is institutional trading in forex?
It is most of the market, and most of it is not trying to beat you. Every three years the BIS, with central banks and other authorities in 52 jurisdictions, asks more than 1,100 banks and other dealers what they traded. The survey for April 2025 put foreign exchange at $9.6 trillion a day, counted so that a trade between two dealers is not counted twice.
| Who the dealers traded with | Share of turnover | A day |
|---|---|---|
| Other dealers | 46% | $4.4 trillion |
| Other financial institutions | 50% | $4.8 trillion |
| of which smaller banks | 24% | $2.4 trillion |
| of which institutional investors | 13% | $1.3 trillion |
| of which hedge funds and proprietary trading firms | 8% | $0.8 trillion |
| Non-financial customers, mainly companies | 5% | $0.4 trillion |
Shares are rounded, and the survey only sees what dealers report. The figures are from the BIS's final tables of June 2026, which put the official sector, central banks among it, inside "other financial institutions" at $138 billion a day. Retail is not a row in this table. The final tables carry it as a memo line, "retail-driven": $242 billion a day, 2.5% of the total, and $109 billion of spot, 3.7%. In the 2013 survey it was 3.5% and 3.8%. The survey sees only retail trades that reached a dealer, so a more precise retail share with no source is a guess.
The headline number also flatters the part you trade:
- Spot, the price on your chart, is $3 trillion, 31% of the total. FX swaps are the largest instrument at $4 trillion, 42%, and they are widely used for funding and hedging: one currency lent against another for a period. Forwards are $1.8 trillion.
- About $1.25 trillion, 13%, is what the BIS calls non-market-facing: back-to-back deals between a dealer's own desks and compression trades that tidy a book.
- The desks are in a few cities. The UK has about 38% of trading and the US about 19%, and with Singapore and Hong Kong they have 75%. That is one reason the forex sessions feel so different. In our count of seven dollar majors and gold, from 6 April to 1 October 2026, a London candle closed outside the Asian range, which we draw as the Asian Box, on 745 of 1,030 market-days. That fits desks opening. It does not prove it.
So a company paying for imports, a pension fund hedging its dollars and a bank rolling its funding are all institutional trading. None of them knows you exist. In stocks the phrase usually means block trades and dark pools, and the same size problem applies, but stocks have exchanges and reported trades. Spot forex has no public tape.
How do orders reach the dealers?
Orders reach a dealer directly or through a platform, and most then stay inside that dealer. The market was long split into two tiers, dealers with each other and dealers with customers, and the BIS says that split has blurred.
- Direct: a phone call, a chat, or a bank's own single-dealer platform.
- Indirect: a multi-dealer platform, of which customers can in theory use more than 15, or an inter-dealer electronic broker with an anonymous order book. Customers can also reach more than a dozen non-bank liquidity providers.
- Prime brokerage: a top dealer lets a client trade in the bank's name with the bank's counterparties.
- Retail: the BIS's 2019 review describes the access of retail clients, individuals among them, as "one-step removed from wholesale FX markets".
About 59% of activity was electronic in April 2025, and voice stays important for larger trades. The figure that matters most is this one. In the major hubs, dealers match more than 80% of customer trades within their own internal liquidity pools. The BIS calls this internalisation. A customer's buy meets another customer's sell on the dealer's own book, and no outside venue ever shows it.
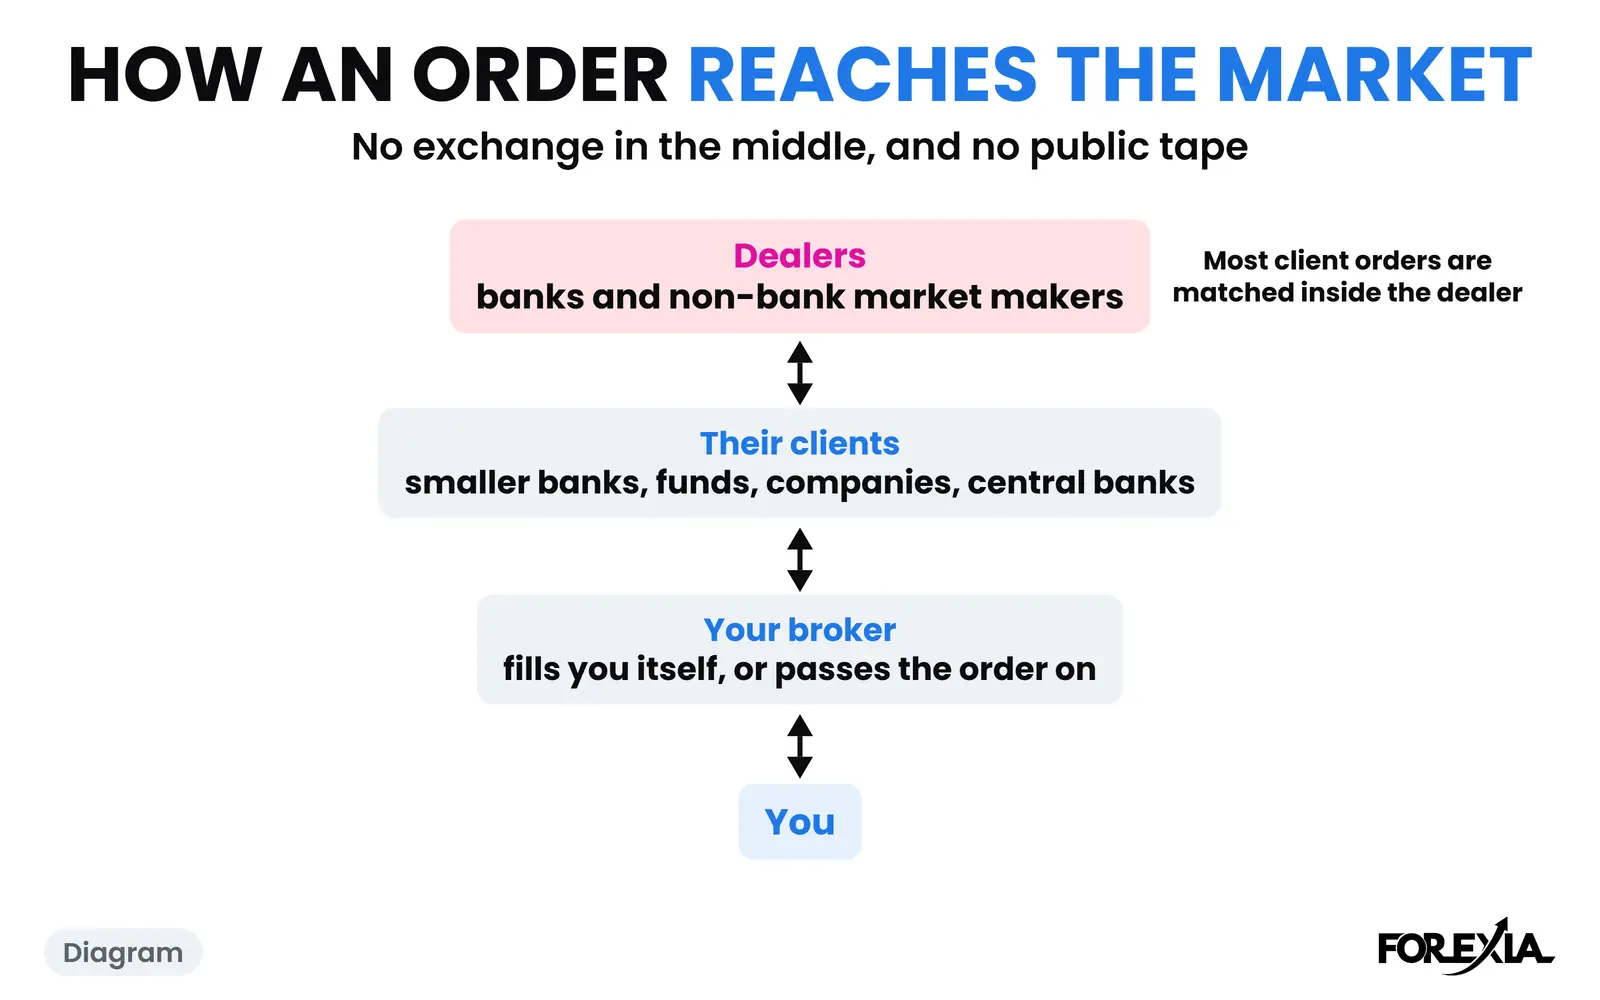
We go through bank desks in how banks trade forex, and through what a chart can show of all this in forex order flow explained.
Smart money, market makers and banks: who is who
These words overlap, and most confusion on this subject starts there. Here is what each one means on this page.
| Word | What it means | Is it an official term? |
|---|---|---|
| Institution | Any organisation trading rather than a private person | Loose, but in common use |
| Dealer | A bank or other firm that trades with clients and with other dealers, the firms the BIS survey collects from | Yes |
| Market maker | A firm that quotes both a buying and a selling price and takes whichever side you want, paid by the spread and the flow | Yes, as a role |
| Non-bank market maker | An electronic trading firm doing the same job, which the BIS says can "substitute speed for balance sheet" | Yes, as a role |
| Central bank | A public institution that deals for reserves or policy, not for a trading profit | Yes |
| Your broker | The firm that gives you access, and may itself be your counterparty | Yes |
| Smart money | A nickname for size | No |
The role is simple. A market maker quotes two prices, takes on whatever comes in, and tries to get rid of the risk cheaply. What do market makers do in forex takes that step by step. Note what it does not say: nothing in the role requires a view on where price is going next.
Much of what ranks for smart money teaches a set vocabulary of chart shapes, each said to mark where a bank placed its orders. We do not use it. We have seen no published dealer data that ties a shape on a chart to a bank's order, and the figure above suggests why that would be hard: most of those orders never reach a venue at all.
Retail trader vs market maker: one candle, three seats
The retail trader wants the direction to be right, and the market maker wants the order flow. We read one chart from the three seats: retail, market maker and observer. Doing it on purpose is what we call Perceptual Positioning.
Here is one day, on 15-minute Dukascopy candles in New York time, each named by when it opens. Your broker's chart may differ by a pip or so. EUR/USD on Wednesday 15 July 2026 held a 28-pip Asian range, 1.14156 to 1.14437. London broke the low and reached 1.14105 at 06:30 New York, then pulled back to 1.14193. A candle first dipped under that low at 07:45, and the 08:00 New York candle went furthest, to 1.14059, 10 pips under the Asian low.
- Retail sees support broken and a new low. It sells the breakdown, or has its buy stopped out.
- The market maker, on our read, sees orders: a buyer of size needs sellers, and those stops and breakdown orders are sellers.
- The observer waits for the close back. The 08:00 candle closed at 1.14090, still under the London low, so nothing was settled. The 08:15 candle closed back above it, at 1.14139.
US producer prices came at 08:30, and that candle closed at 1.14251. By 14:30 price was at 1.14825, 77 pips off the low, with the Fed chair's testimony at 10:00 in between.
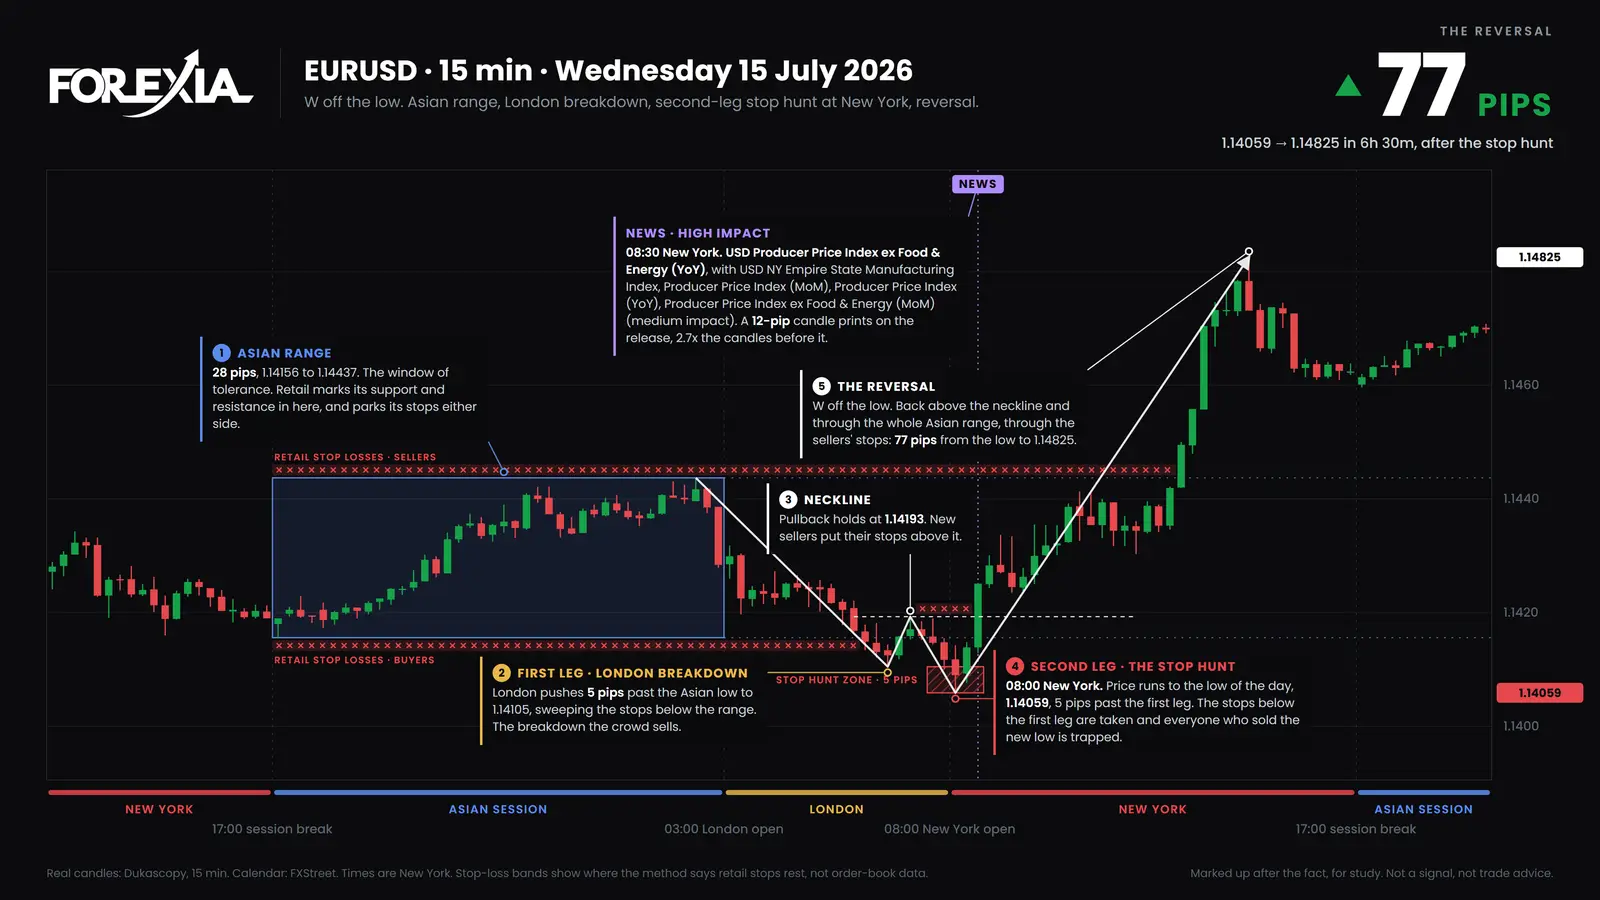
The crosses on our charts show where the method says stops rest. They are a reading of the structure, not order-book data. That middle bullet is a read too. Nobody outside saw who bought at 1.14059. The comparison gets its own page in retail traders vs institutional traders, and the plain question of who takes the other side of your forex trade has another.
Dealing desk, ECN and market maker brokers
These are three ways a retail broker can handle your order, and none of them is the market maker we mean above.
| Broker model | What happens to your order | What it changes for you |
|---|---|---|
| Dealing desk, or market maker broker | The broker fills it itself and may keep the risk or offset it in bulk | A real conflict of interest, and prices it may set itself |
| STP | The broker passes it on to larger firms, often with a mark-up in the spread | Your fill depends on who it passes it to |
| ECN | It is matched on a network of other participants, usually for a commission | Tighter quoted spreads, and a commission to count |
The labels are marketing as much as description, and a broker can run more than one. So read what the rules make them say. US rules make retail forex dealers there print this wording, in capitals: "WHEN YOU SELL, THE DEALER IS THE BUYER. WHEN YOU BUY, THE DEALER IS THE SELLER." And: "YOUR DEALER IS YOUR TRADING PARTNER WHICH IS A DIRECT CONFLICT OF INTEREST." And: "YOUR DEALER MAY SET ITS OWN PRICES." The same rule makes those dealers disclose, for each of the last four quarters, what percentage of their accounts were profitable, so ask to see it.
A broker that makes a market for you is not the market maker of the second seat. One quotes you a private price. The other trades in the wholesale market, where your broker is at most a small customer. Your broker cannot move EUR/USD. It can affect your fill, through the spread, the rollover or its own feed, and you can check that against a second feed. We show how in do brokers hunt stops. The comparison of market maker vs ECN broker goes further. None of the three changes where the crowd's stops sit.
A real gold day through the market maker's seat
Gold on Tuesday 7 July 2026 shows the read at its most convincing, which is the reason to be careful with it. Gold has its own wholesale market, over the counter and centred on London, and on our charts $1 counts as 1 pip.
Asia left a 52-pip range, 4116.52 to 4168.19, and it was not a tidy one. The 08:00 New York candle broke the top, and the 08:15 candle reached 4174.91: the breakout the crowd buys, with sellers' stops going off behind it. The pullback held at 4159.73 in the 09:00 candle, which also printed 4178.06, past the first high. Then the 09:30 candle ran to 4180.23, the high of the day, 5 pips past the first high and 12 above the range. The calendar had the ADP weekly figure at 08:15 and a Fed speech at 08:30, both medium impact, and nothing at 09:30.
The 09:30 candle closed at 4177.15, still above the first high. The 09:45 candle closed at 4158.20, under it and under the pullback low. Gold reached 4091.84 at 15:15, 88 pips down and through the whole Asian range, and the day ended at 4105.23.
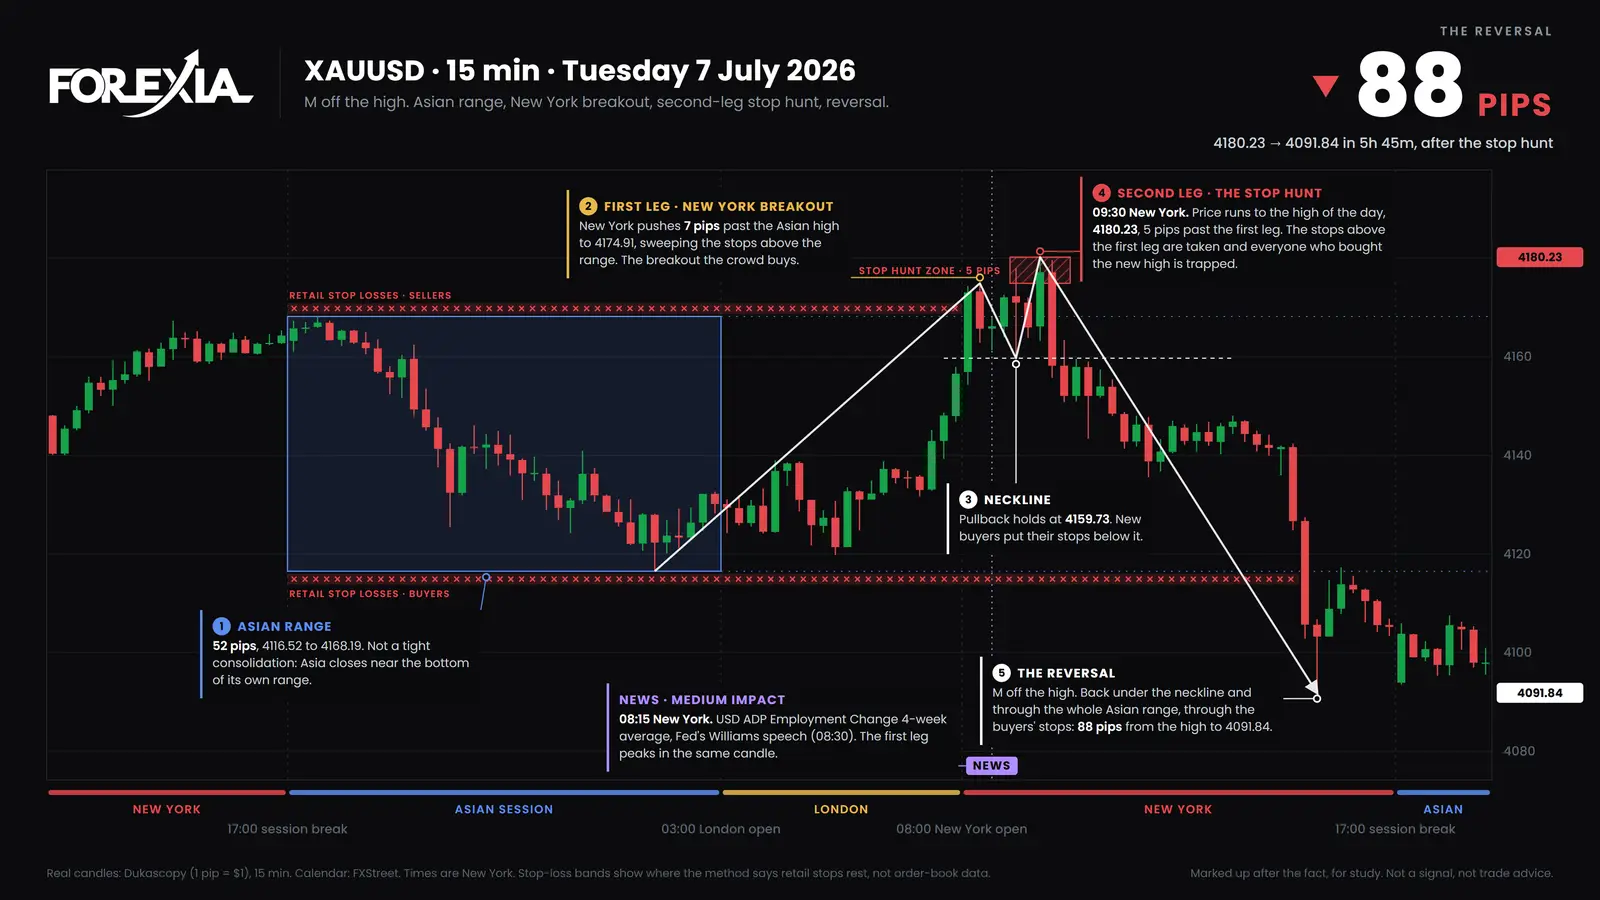
From the market maker's seat, we read it like this. Anyone needing to sell size needs buyers. A new high in a rising morning supplies them twice: the stops of whoever sold the first high are buy orders, and so are the people buying the break. This shape is the M of M & W Reversals. The second push, a stop hunt of the first high (a liquidity sweep of the stops above it), is what we call the Second Leg Climax. Marking those piles of orders before the session is Liquidity Mapping.
That is a reading of one finished day, picked because it reversed. We do not know that anyone sold in size at 4180.23. Another gold day, mapped before London, is on institutional level trading on 17 July 2026. A reversal seen afterwards is not a setup, and when we ran the idea as a fixed rule it did not make money. The stop hunt page has the sample, the costs and the limits.
Dumb money vs smart money: what smart money trading means
Smart money trading means trying to trade with large players by reading their footprints on a chart, and the flaw is that those footprints are unsigned. Dealers' orders are private, so every such method is an inference from price. That includes ours.
"Smart" also claims too much. Much of the flow in the table above is hedging, funding or client business. Nothing in any survey says who made money, and institutions lose too. The usual public source, the COT report, covers futures, comes out on Friday for the Tuesday before, and has no column for intent. We tested whether it helps, and Fade the Crowd is how we use it.
Dumb Money is our word for the other side of the label, and it does not mean stupid. It means predictable: you know where it buys, and where it sells when it is wrong. Plenty of clever people trade that way, because they learned the same pages. The trader who runs those instructions is what we call The NPC.
Predictable levels can be counted. Across seven dollar majors and gold, from 6 April to 1 October 2026, we took every edge of the Asian range and previous-day level traded through after the London open by at least 3% of the average daily range. Of 1,601 levels taken, 1,310 closed back the same day. On 291 no candle had closed back by the end of the day, and those ran a median of 65% of the average day past the level, against 9% for the ones that closed back. So obvious levels get run often, and most of those runs come back. That is a count of candles. It says nothing about whose orders were there.
What you can know and what you cannot
You can know the market's structure, and what you cannot know is who moved a given candle. Here is the line as we draw it.
| What it covers | Where it comes from | |
|---|---|---|
| Known | Who trades, in what volumes, in which cities | BIS survey |
| Known | Most customer orders are matched inside dealers | BIS Quarterly Review, December 2025 |
| Known | A US retail dealer is your trading partner and may set its own prices | US federal rules |
| Known | Traders at banks attempted to trigger client stops, in the years a regulator examined | Stop hunt page, with the 2014 findings |
| Our read | Market makers build the chart: a quiet range gives the crowd its levels, and the hunt collects the stops behind them | Us, from the structure of the chart |
| Unknown | Whose order made any one candle | Nobody outside can say, and a dealer sees only its own book |
| Unknown | Whether runs of levels happen more often than chance | We have not separated the two |
Two pieces of evidence press on our read from opposite sides, and you should have both.
Against it: if dealers match more than 80% of customer trades internally, a dealer does not need your stops for most of its flow. The simple story of banks hunting for fills all day is too simple. We do not know how much of what remains meets stops at a level.
For it: the market's own FX Global Code (December 2024 text), kept by a committee of central banks and the industry, covers this directly in Principle 10. A firm handling a client's stop should disclose "whether risk management transactions may be executed close to a Stop Loss Order trigger level, and that those transactions may impact the reference price and result in the Stop Loss Order being triggered". It lists "trading or otherwise acting in a manner designed to move the market to the Stop Loss level" as unacceptable. So a stop being triggered by a dealer's own hedging is a recognised event, and doing it on purpose is against the code. The code is also voluntary: it "does not impose legal or regulatory obligations". Whether forex is rigged has a page of its own.
The day our chart could not tell: USD/JPY, 30 July 2026
USD/JPY spent Asia in a 44-pip range, 163.209 to 163.644. At 03:45 New York a candle pushed 9 pips over the top to 163.738, the high of the day, and turned. Our markup tool logged that as a stop hunt, a liquidity sweep of the stops above the range, followed by a 578-pip fall to 157.963 at 10:15.
Most of that fall came nearly six hours later. US GDP and inflation came at 08:30, in a 23-pip candle. Then the 09:30 candle, with nothing on our calendar, opened at 162.778 and traded down to 160.279. Three more candles took it to the low: about 480 of the 578 pips in an hour. That was the evening in Tokyo, and the next day Nomura Asset Management wrote that the move was likely to have been triggered by official intervention.
Now look at what a government discloses. Japan's finance ministry reported ¥0 of intervention for 29 June to 29 July. For 30 July to 26 August it reported ¥15,399.3 billion. Those are its regular reporting periods, and the release does not say which days. The one date we found a minister naming is Friday 31 July, New York time, the day after this chart, when Japan bought yen in coordination with the US Treasury. The day-by-day table comes later: April to June's is dated 7 August. On 30 October, when we wrote this, the table for July to September was not up, so even this candle is not officially signed.
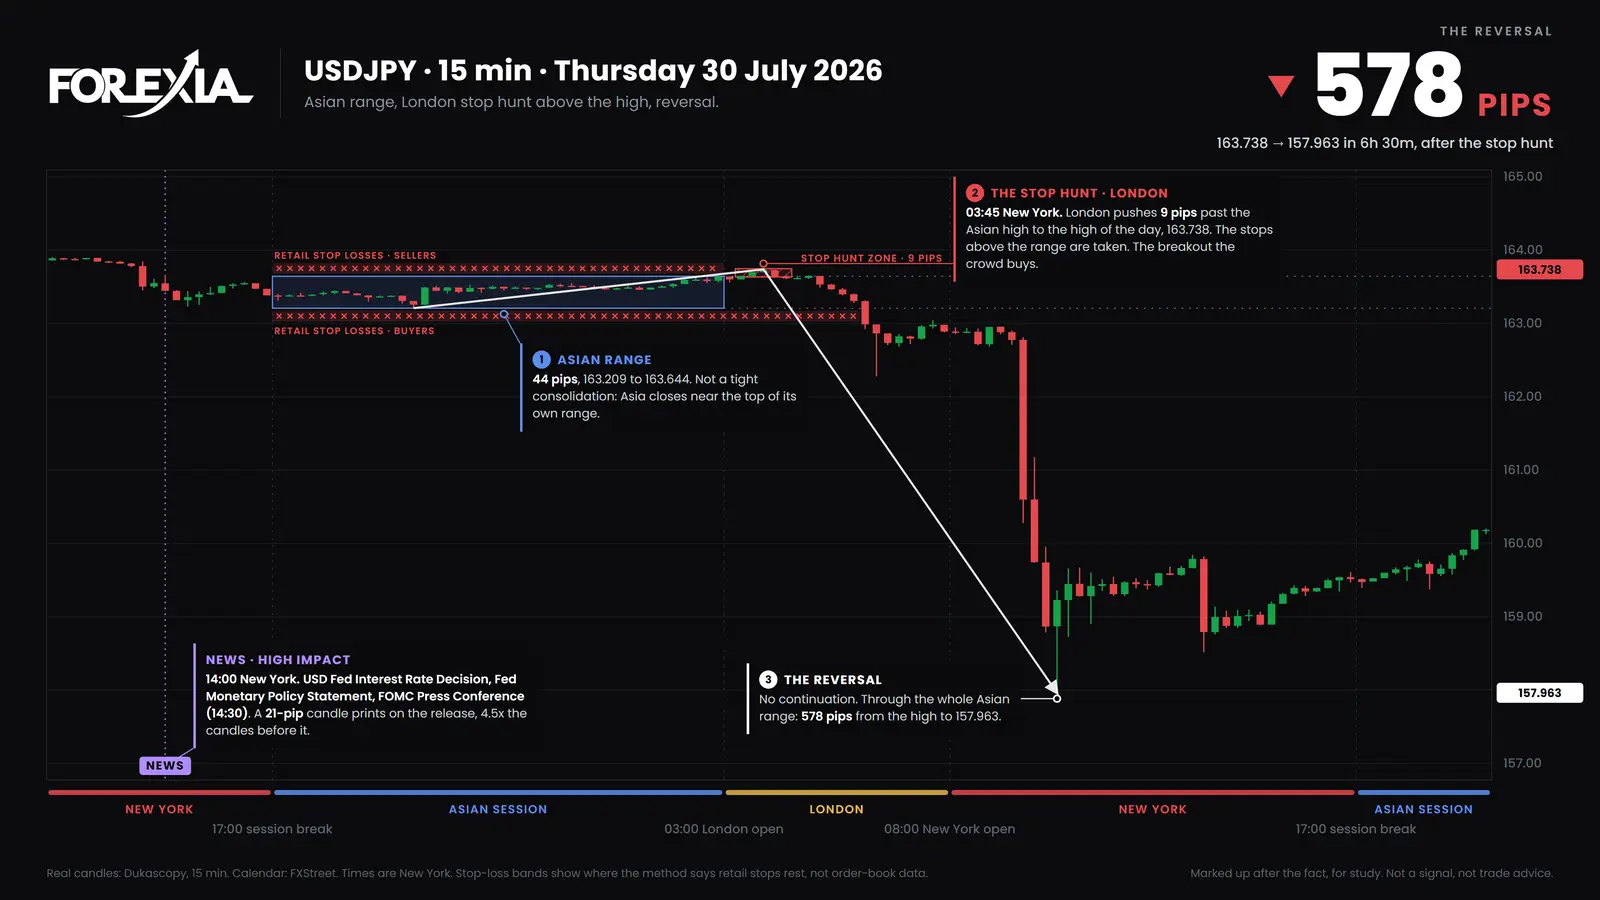
This is the most useful chart on the page, because of what it does to our own label. Read it from the second seat alone and you would credit a hunt of the stops above the range, and we think that is the wrong story for most of that fall. Read it knowing a government may have been selling dollars, and it may be an institutional trade made with no interest in your stop. The candles look the same either way. This is the only kind of day when we even get to learn the name, weeks late, and only because a government publishes. A dealer never publishes its orders.
Common mistakes when copying institutions
Most of them come from copying what large players look like rather than the position they are in.
- Copying a size problem you do not have. A small retail order fills at once. You do not need to find sellers, so you cannot learn much by acting as if you did.
- Treating a shape as a bank's signature. A shape shows where price went. Treat anything that says more as a claim, and ask what data supports it.
- Reading your platform's volume as the market's. It is your broker's activity, or a count of price changes. With most flow inside dealers, nobody's platform shows the whole.
- Following one report as if it were live. The COT report is days old when you read it, and it does not say why a position is held.
- Calling every stop-out an institution. Many stops are just wrong, or too tight, or a broker's spread. Run the check in stop too tight or a stop hunt first.
- Trusting a job title. A dealer's advantage is client flow, a balance sheet and credit lines. A former bank trader leaves those at the bank.
- Taking it personally. A dealer fills orders for a living, and no chart shows a candle was aimed at you. Anger does not help you read the next one.
- Mistaking hindsight for skill. Every day on this page was chosen after it finished. Our weekly chart markups are the same, marked up afterwards for study.
Course 1 of ForexiaPRO, Reading the Map, teaches this read step by step, starting from lesson 1.1.2, Retail, Market Maker, Observer.
Start here
- Retail Traders vs Institutional Traders: One Candle, Three Seats
Retail traders vs institutional traders: who wants what, in one table, then one real EUR/USD candle and a GBP/USD day that cost both ways, on our chart.
Real days
- Institutional Level Trading Strategy on Gold: Three Levels, One Pool, 17 July 2026
An institutional level trading strategy tested on one real day: three lines on gold within $1.36 made one pool, and New York took it on 17 July 2026.
Questions
- Dumb Money vs Smart Money in Forex: Who Is on Each Side of the Candle?
Dumb money vs smart money in forex: one side you can read and one you cannot. A real EUR/USD day where the crowd was caught, and another when it was right.
- Who Takes the Other Side of Your Forex Trade? It Depends on Your Broker's Model
Who takes the other side of your forex trade? What US rules and broker models allow, and what stays unknown. BIS figures and two real days on our charts.
Frequently asked questions
What is institutional trading?
Institutional trading is buying and selling by organisations rather than individuals: banks, funds, insurers, companies and central banks. In forex most of it passes through dealers, who quote prices and take the other side. The Bank for International Settlements measured the whole market at $9.6 trillion a day in April 2025.
What is smart money in forex?
Smart money is a nickname for large players such as banks and funds. No regulator or survey uses it as a category, and it does not mean those players are right. Many of them are hedging, funding or filling client orders, so they are not trying to predict the next candle at all.
Does smart money trading work?
It depends what you mean, and nobody can show it from a chart. Nobody outside a dealer can see its orders, so a chart can only suggest what large players did. We ran our own read as a fixed rule, on real prices with costs, and that rule did not make money. It does not prove a trader reading the chart cannot do better.
Who is on the other side of a retail trade?
It depends on your broker's model. US rules make retail forex dealers tell clients: when you sell, the dealer is the buyer. The broker may then keep that risk or offset it with a larger firm, and you cannot see which unless it tells you. Beyond the broker, your order is one small part of a dealer's flow.
What is the difference between a dealing desk, an ECN and a market maker?
A dealing desk broker, also called a market maker broker, fills your order itself and may carry the risk. An STP broker passes it to larger firms. An ECN matches it on a network of other participants, usually for a commission. These are broker models. None of them is the market maker of Forexia's second seat, which means the dealers in the wholesale market.
How do banks trade forex differently from retail traders?
Dealer banks mostly quote prices to clients and manage the risk that leaves on their books. The BIS says dealers match more than 80% of customer trades within their own pools. A retail trader takes a view and pays the spread. A dealer is paid by the flow, and has a size problem that a small account does not have.
What percentage of forex trading is retail?
The closest official figure is the BIS's. Its final tables for April 2025, published in June 2026, put retail-driven trading at $242 billion a day: 2.5% of total turnover and 3.7% of spot. In 2013 it was 3.5% and 3.8%. The survey sees only retail trades that reached a dealer, so treat any more precise figure without a named source with caution.
What is the difference between dumb money and smart money?
Dumb money is our word for the predictable retail herd, and it is about predictability, not intelligence. You know where it buys and where it sells when it is wrong. Smart money is a nickname for size. Neither word says who made money, and no survey measures that.
Do market makers hunt stops?
It is our read, and it cannot be proven from a chart. The market's own code of conduct lists trading designed to move the market to a stop level as unacceptable, and a UK regulator found in 2014 that traders had attempted to trigger client stops. That is evidence it has happened, not evidence that a given candle was a hunt.
Can you see institutional orders?
No. Spot forex has no central exchange and no public tape, and the BIS says most customer orders are matched inside dealers, where nobody else sees them. The volume on a retail platform is that platform's activity, not the market's. The COT report shows large positions in futures, once a week, days late.
Can a retail trader trade like an institution?
Not literally. You do not have the client flow, the balance sheet, the credit lines or the view of orders. You also do not have the problem of filling a huge order. What you can do is reason about where other people's orders probably rest, and treat that as a reading rather than a fact.
Do central banks trade forex?
Yes, some of the time. They sit in the BIS tables as official sector institutions, and they deal for reserves or policy. Japan's finance ministry, with the Bank of Japan carrying out the deals, reported ¥15.4 trillion of intervention for 30 July to 26 August 2026. Its reports give the total first and the individual days only after the quarter ends.
The latest chart markups
- Forex Chart Markups: Weekly Stop Hunt & Reversal Archive
Forex chart markups, week by week: stop hunts, M and W formations and midweek reversals on the majors and gold, drawn on real candles.
- Reverse Price Action: How to Read a Forex Chart Markup
Reverse price action reads a chart from the side of the crowd: where retail orders and stop losses sit, and how price collects them. A visual guide.
- EURUSD Stop Hunt: Forex Chart Markups, 28 September 2026
An EURUSD stop hunt through Tuesday's high on US PCE data completed an M formation and fell 165 pips. Chart markups, 28 September 2026.