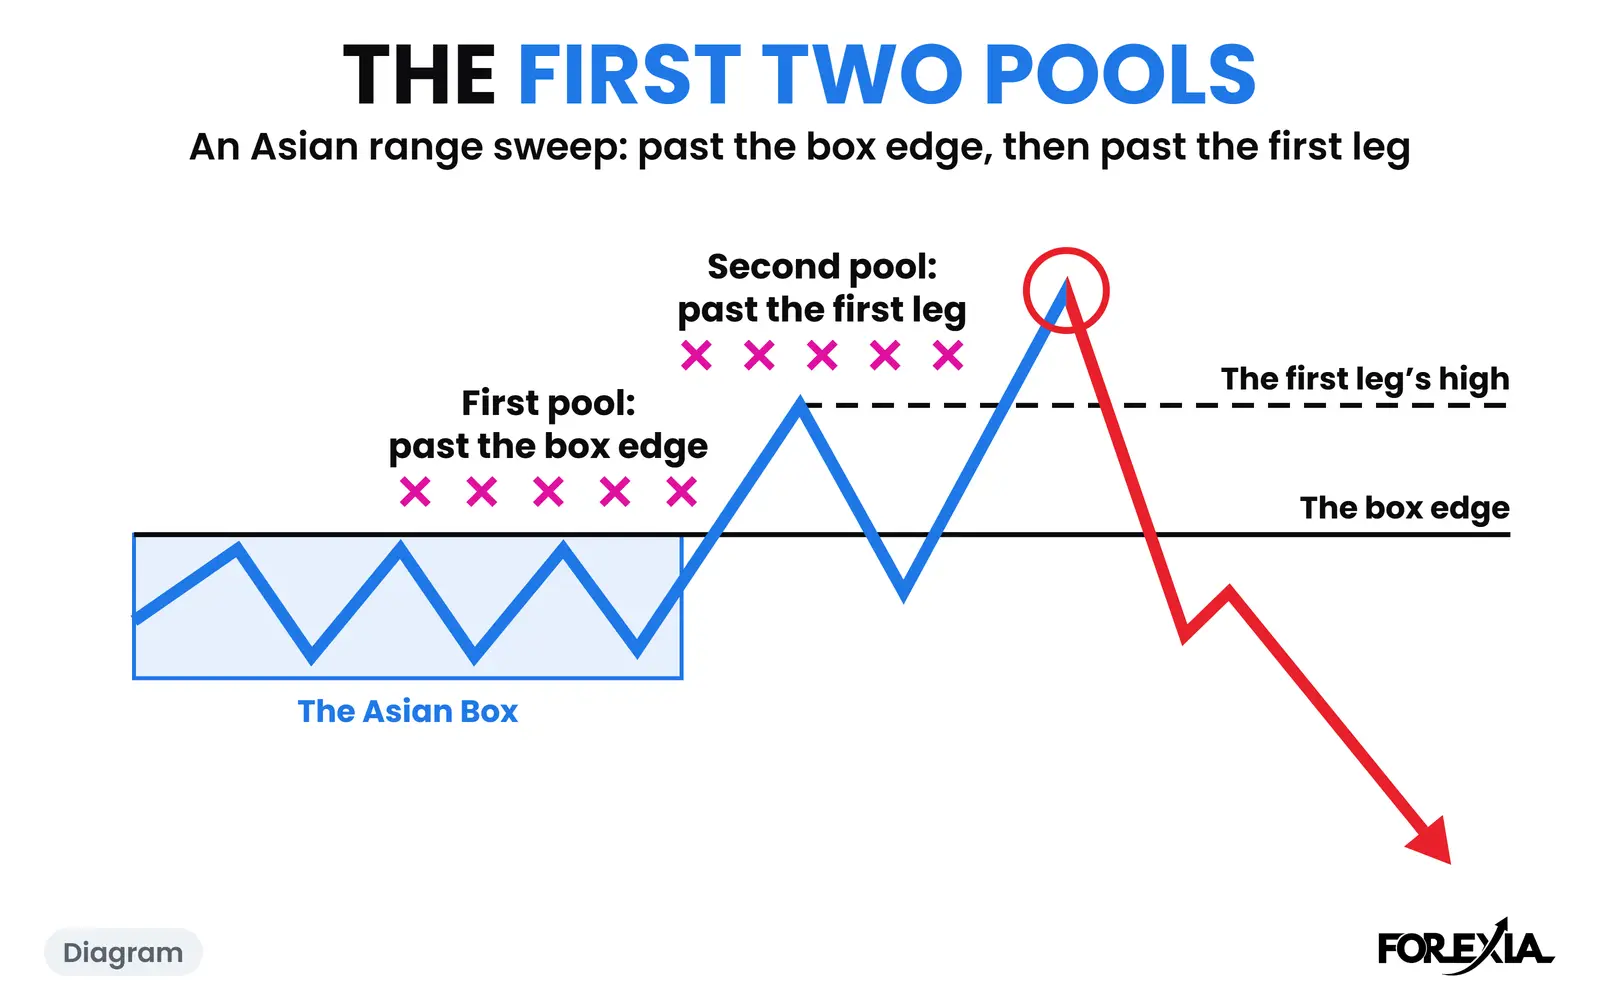
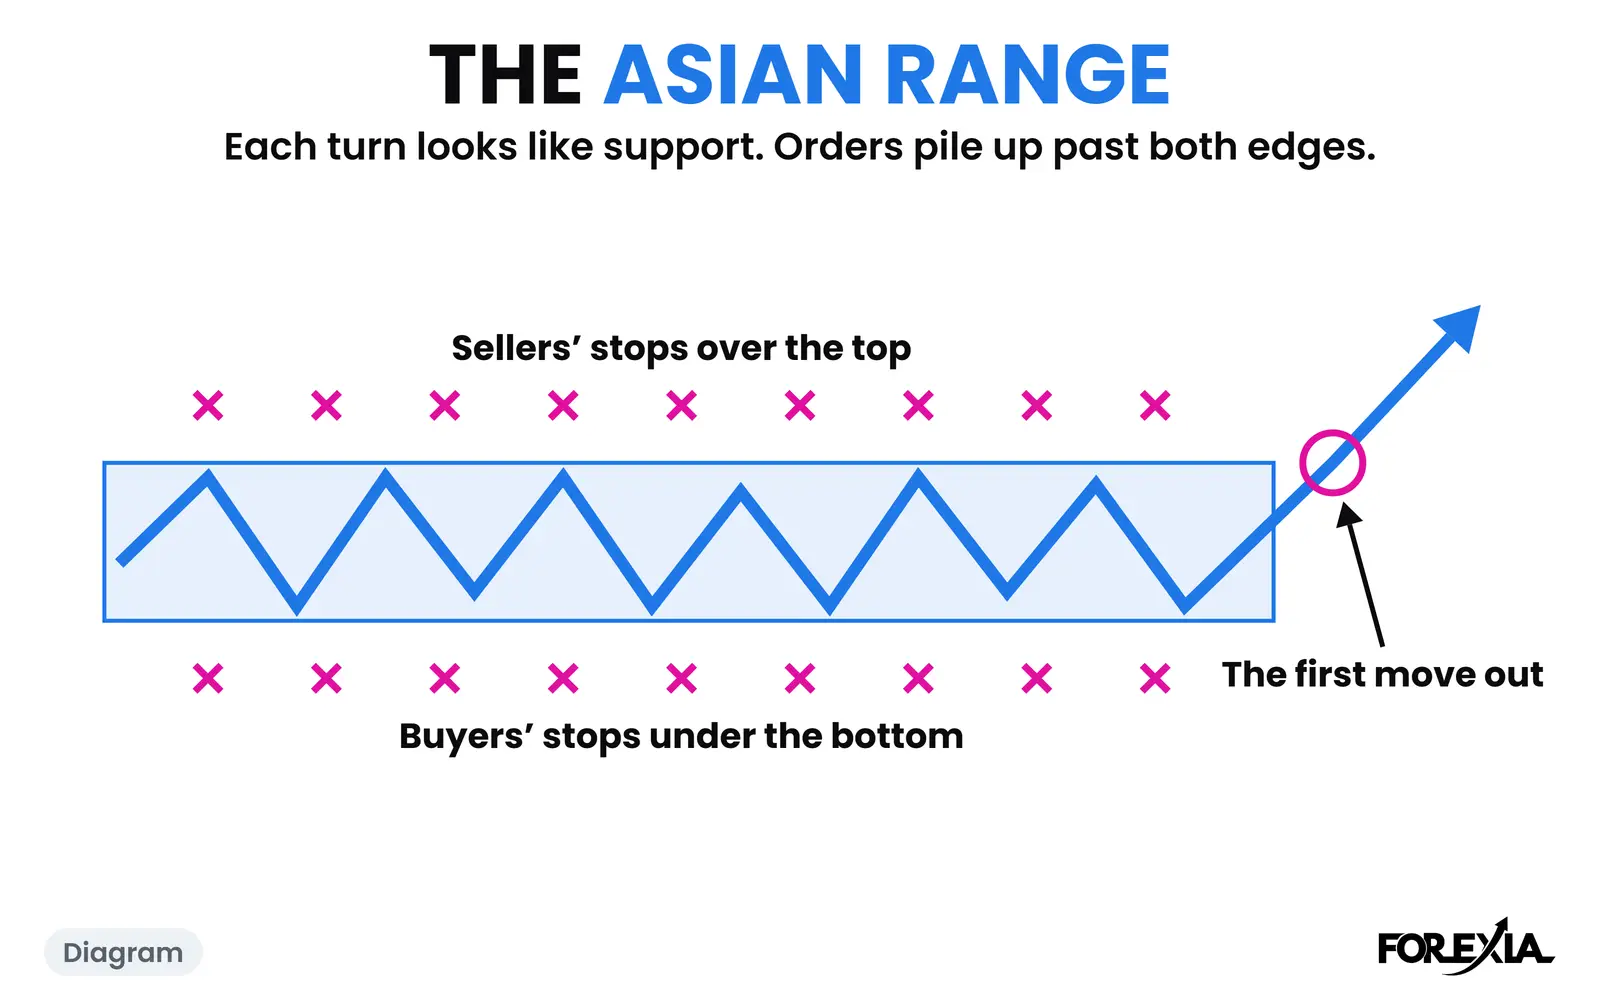
Dumb Money vs Smart Money in Forex: Who Is on Each Side of the Candle?
Dylan Forexia7 min read
Dumb money vs smart money is a contrast between the predictable retail herd and the large players said to take the other side. Only one half can be read. You can see where the crowd was told to act, because it is in the books. Smart money's orders are private, so "following" it means guessing from the result.
Dumb Money has its own page, with what the word means and where the phrase came from. This one puts the two side by side, asks who could really be on the far side of a candle, and shows a day when the herd was right.
What is the difference between dumb money and smart money?
Dumb money is defined by being predictable, and smart money by being large. Neither word says who made money.
| Dumb money | Smart money | |
|---|---|---|
| What the word means | In our use, a predictable herd. Not stupid | A nickname for banks, funds and other large players. The regulators' and surveys' documents we read do not use it as a category |
| Who it describes | A trader acting on the shared textbook that day, whoever they are | Everyone from a dealer filling a client to a company hedging. Many have no view on direction |
| What it wants | To be right about direction | It depends on who it is |
| Can you see it? | Yes, as a plan: the entries and stops are in the book | No. Spot forex has no public record of who traded |
| Is it always wrong? | No. See the second day below | Nothing says it is always right either |
The common version of this table says smart money can predict trends and dumb money cannot. One ranking page says exactly that, with no evidence. We do not repeat it, because the first half is what nobody outside can check.
There is research on the real question. A 2016 paper in the Journal of Finance looked at customer currency trades through a large dealer and found that customer groups "differ markedly in their predictive ability, trading styles, and risk exposure". An earlier draft of the paper found asset managers' flows the most informative and those of corporate and private clients generally not. So groups of traders do differ, which gives the idea some support. But that view comes from one dealer's private books, its groups are customer types and not the words "smart" and "dumb", and none of it shows on your chart.
Who is on each side of the candle?
The crowd's side can be named, and the other side can only be listed. EUR/USD on Wednesday 30 September 2026 shows how far that goes.
Asia's range ran from 1.13288 to 1.13572. Drawn on the chart, that is the Asian Box. Tuesday's high sat above it at 1.13740. London reached 1.13639 at 06:00 New York and pulled back to 1.13483 by 07:45. ADP came at 08:15. US core PCE inflation and final GDP came at 08:30, and that candle opened at 1.13610, ran to 1.13803 and closed at 1.13744, just over Tuesday's high.
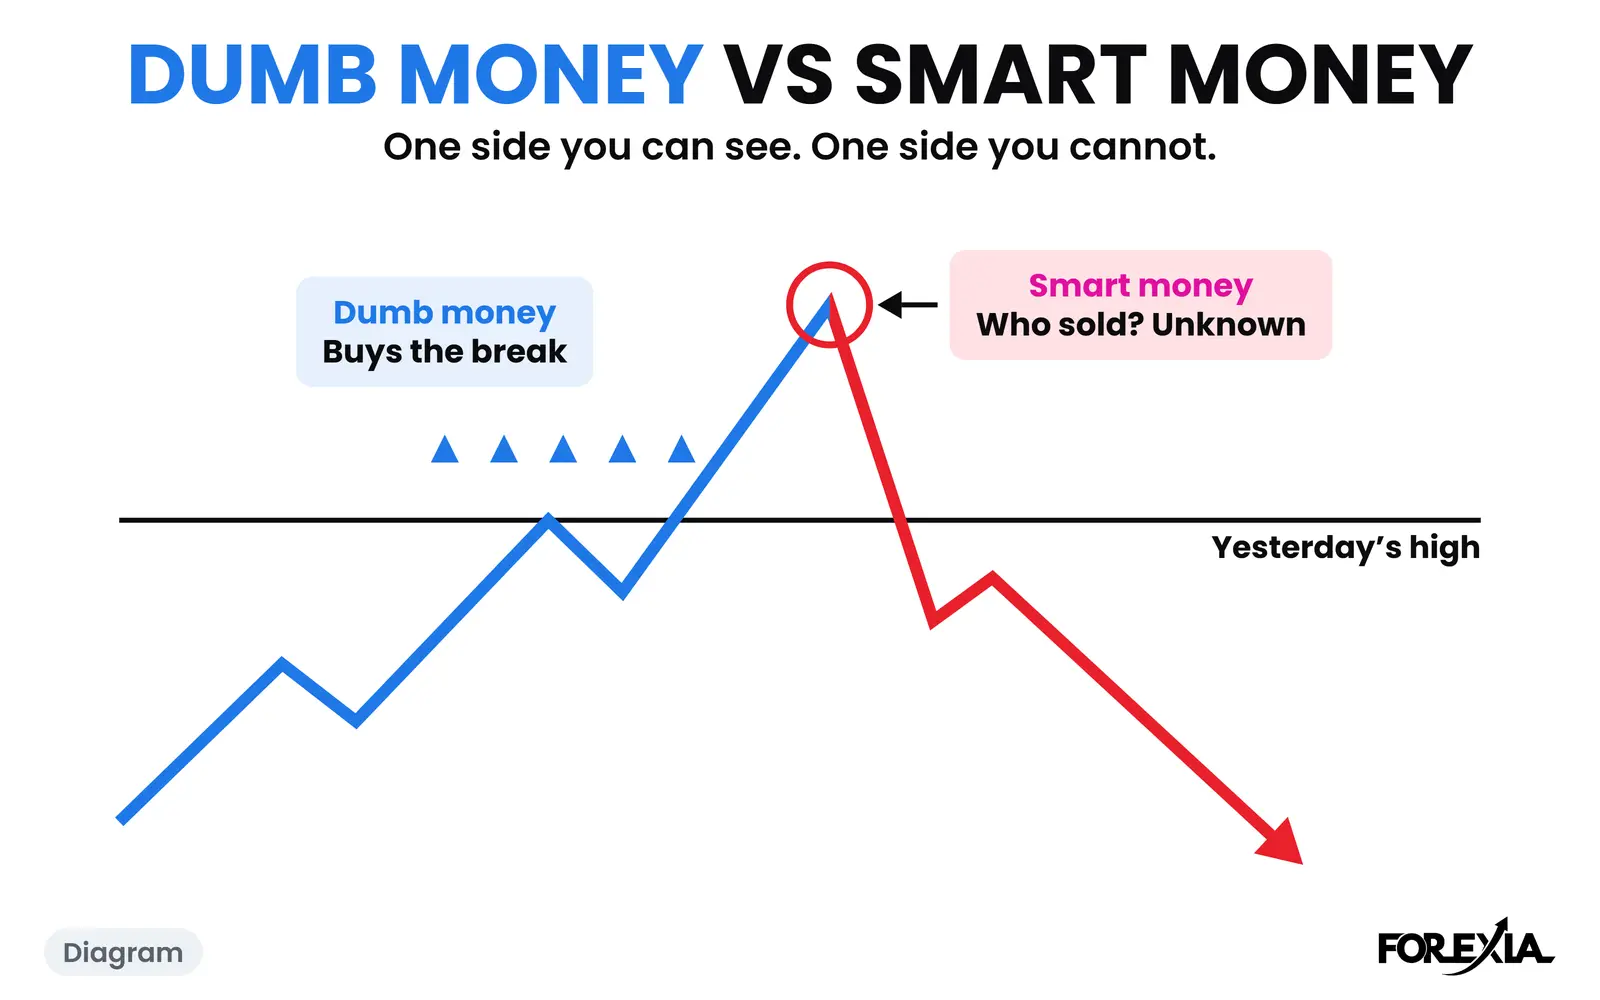
The buy side of that candle is not much of a mystery. Price closing over yesterday's high on a data release is about the plainest breakout in any textbook, and its stop sits back under that line. The stops of anyone short went off there too. Those are the orders of the NPC: the same instructions, run by many traders on one candle.
Every one of those buys had a seller. Who?
- A dealer filling customers. It sells because customers are buying, then manages the risk. It may have no view at all.
- A large seller with its own reason. It needs buyers to get its size done, and this was a good moment to find them. That is our read of what the turn means, and it is what we call the Stop Hunt.
- A company or fund selling dollars or euros for reasons of its own, which could be nothing to do with that candle.
- Another retail trader who read the data the other way.
The chart cannot choose between those. Institutional trading sets out why most customer orders never reach a venue where anyone could see them.
The 08:45 candle traded back to 1.13633, 11 pips under Tuesday's high, which took that stop within the quarter-hour. By 15:45 price was at 1.13222, 58 pips off the top.
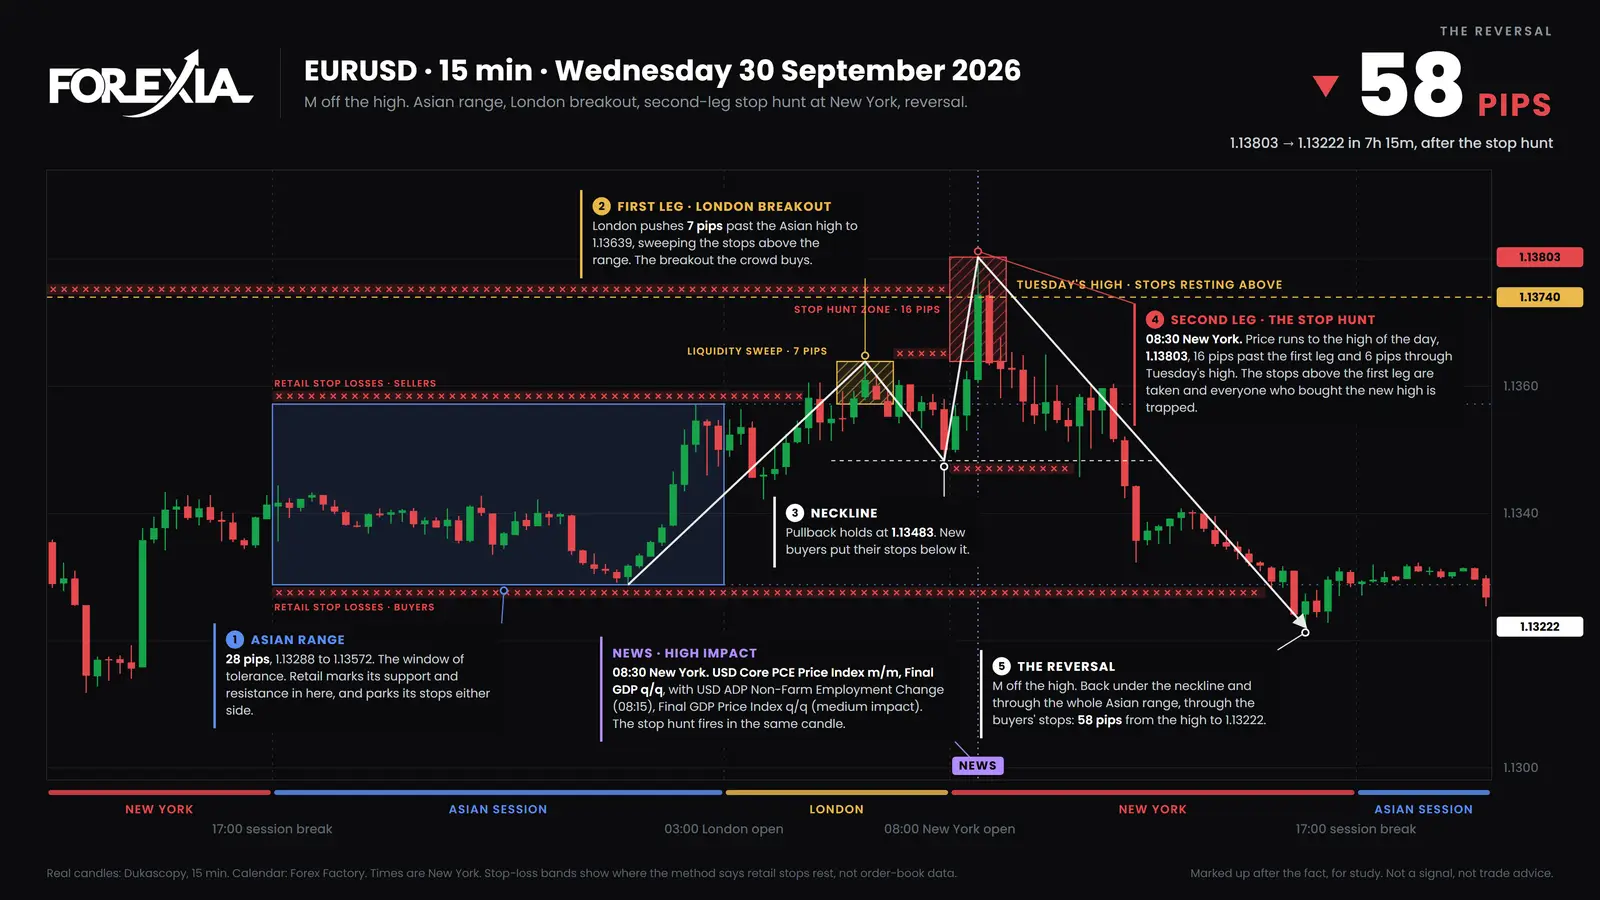
That is why we say the crowd's plan can be read and the seller's cannot. The stop bands on our charts mark where the structure says stops rest. They are not order-book data.
Does dumb money always lose?
No, and a day like this should be kept beside the one above. EUR/USD on Wednesday 19 August 2026 is the same pair and the same kind of break.
The box ran from 1.15700 to 1.15985, 29 pips. The 04:00 New York candle closed over it at 1.16035. The 04:15 candle closed back inside by less than a pip, at 1.15981. Price dipped to 1.15962 at 05:00, 2 pips inside the top, on a candle with euro-area inflation figures, and the 05:15 candle closed back over at 1.16041.
A trader taught to look for traps might well have sold that first close back. The crowd's buyers looked caught, and for about an hour the picture said so.
Then it ran. After that close, price never again traded under 1.15992, which is above that dip. The 08:30 candle went from 1.16068 to 1.16287 with nothing on our calendar at that time, and by 15:30 price was at 1.16790, with the Fed's minutes at 14:00 on the way. That is about 80 pips over the box and 75 over the 05:15 close. A buyer who got in at that close, with a stop under that dip, was never touched. The seller was the one who paid.
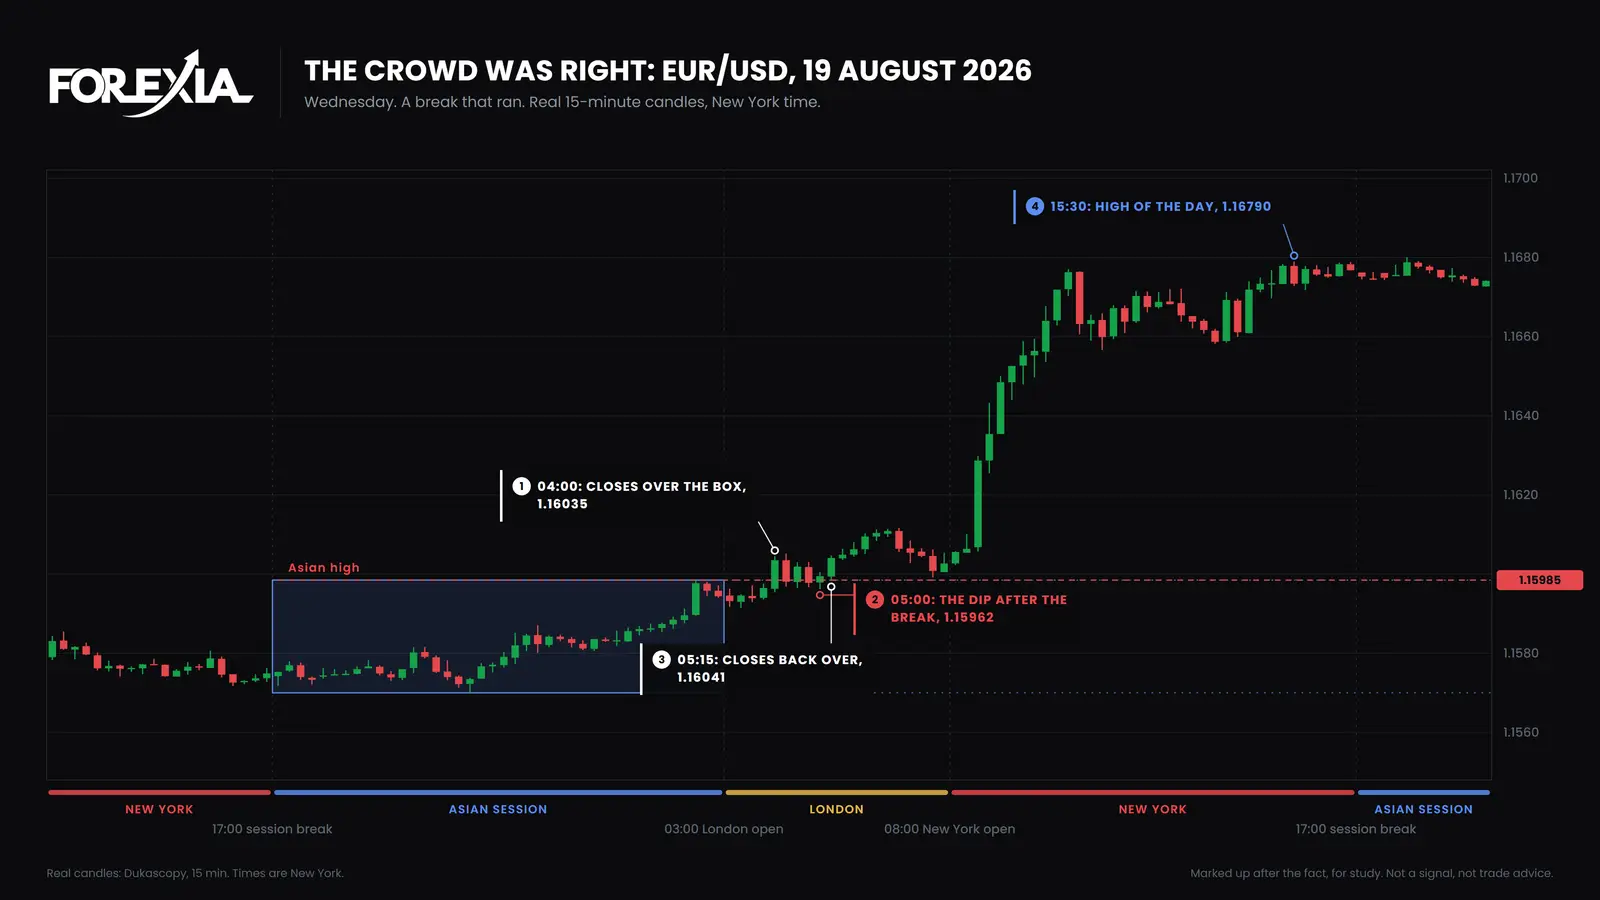
The word on this day still means what it meant: predictable. The buyers were in the book's place, and it worked. Being predictable hurt on the day the market went to the stop first, and not on this one. The Dumb Money page has a count of how often a level taken does not come back.
Nothing on that chart labels the buyers as dumb or as smart. Large players may have been buying alongside them, or not. The labels were never in the candles.
How do you follow smart money, and what does each tool show?
You cannot follow it directly, and each tool sold for the job shows something narrower. Many pages on what smart money trading means are built around stocks, where filings and exchange data exist.
- The COT report. It shows positions in currency futures, by type of trader, once a week and days late, with no reason attached. We tested whether it helps: joining a crowded side lost, and fading it is promising and not proven.
- 13F filings. Form 13F reports what institutional managers with $100 million or more in certain securities, mainly US exchange-traded stocks, hold. It comes quarterly, up to 45 days late, and it has no line for spot forex.
- Volume on your platform. That is your broker's activity, or a count of price changes. It is not the market's.
- Chart shapes said to mark a bank's orders. A shape shows where price went. No dealer data we know of links one to a bank's order, and that applies to our own read too.
What can you do with the distinction, then? It is a question and not a signal. On 30 September, Tuesday's high, the buying over it and the stops under it could all be written down before the session. That said nothing about what came next, as 19 August shows. We ran the idea as a fixed rule and it did not make money, so a turn seen afterwards is not a setup. Retail traders vs institutional traders takes the wider comparison.
Common mistakes
All three come from taking the labels as facts.
- Taking the word as a description of a person. The buyer on 30 September and the buyer on 19 August could be one trader on one instruction, caught once and paid once.
- Taking 30 September as the rule. On 19 August the same kind of break ran, and selling its first close back was the losing side by about 80 pips.
- Crediting smart money for every turn. On 30 September a US data release landed at the top of the move. That may be all it was, and a chart cannot tell you otherwise.
Course 1 of ForexiaPRO, Reading the Map, teaches this read step by step in lesson 1.1.3, Dumb Money and the NPC.
Frequently asked questions
How do you follow smart money in forex?
You cannot follow it directly, because spot forex has no public record of who traded. The usual tools each show something else: the COT report shows futures positions, days late; platform volume shows your broker's activity; chart shapes show where price went. Any of them can be useful as long as you do not call it smart money's footprint.
Is smart money always right?
No. Smart money is a nickname for size, and size is not the same as being right. Much large flow is hedging, funding or client business with no view on the next candle, and institutions lose too. Nothing in any public survey says who made money.
Does dumb money always lose?
No. On EUR/USD on 19 August 2026 a trader who bought the break over the Asian range and held was 75 pips ahead by the afternoon. Being predictable hurts when the market goes to your stop first. On many days it does not, and on that day the trader selling against the crowd was the one who paid.
Do different groups of forex traders really differ in skill?
There is research saying so. A 2016 Journal of Finance paper on a large dealer's customer flows found groups differing markedly in predictive ability, trading style and risk. That data is private to the dealer, its groups are customer types such as asset managers and companies and not the words smart and dumb, and no retail chart shows it.