Institutional Level Trading Strategy on Gold: Three Levels, One Pool, 17 July 2026
Dylan Forexia6 min read
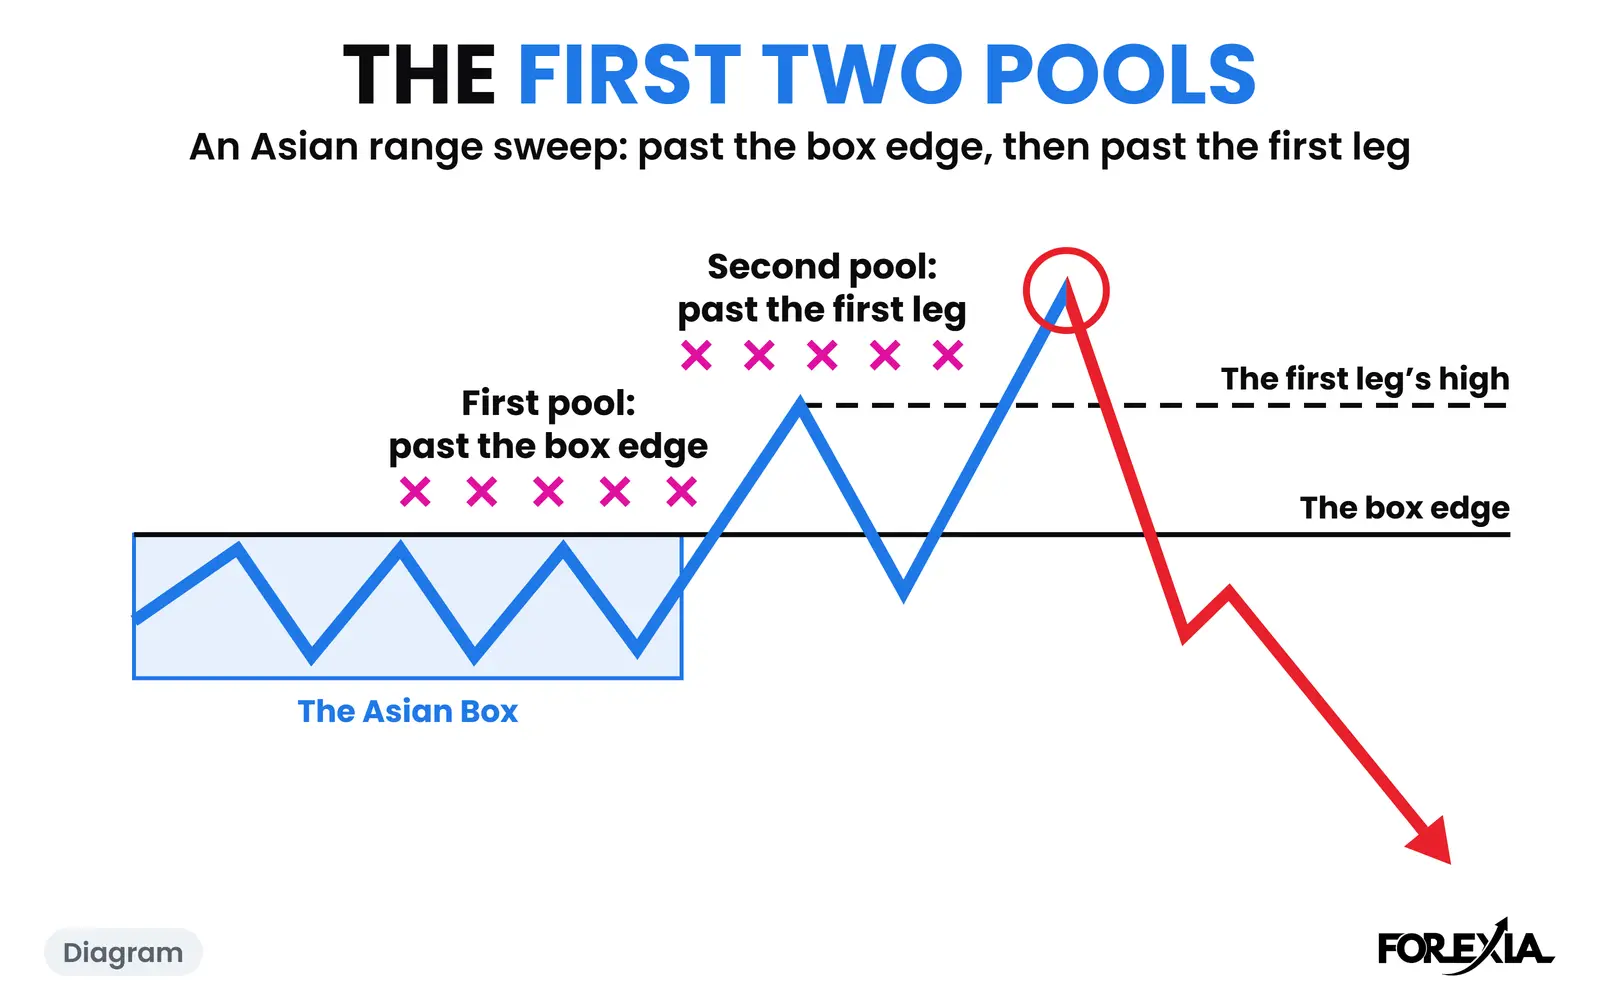
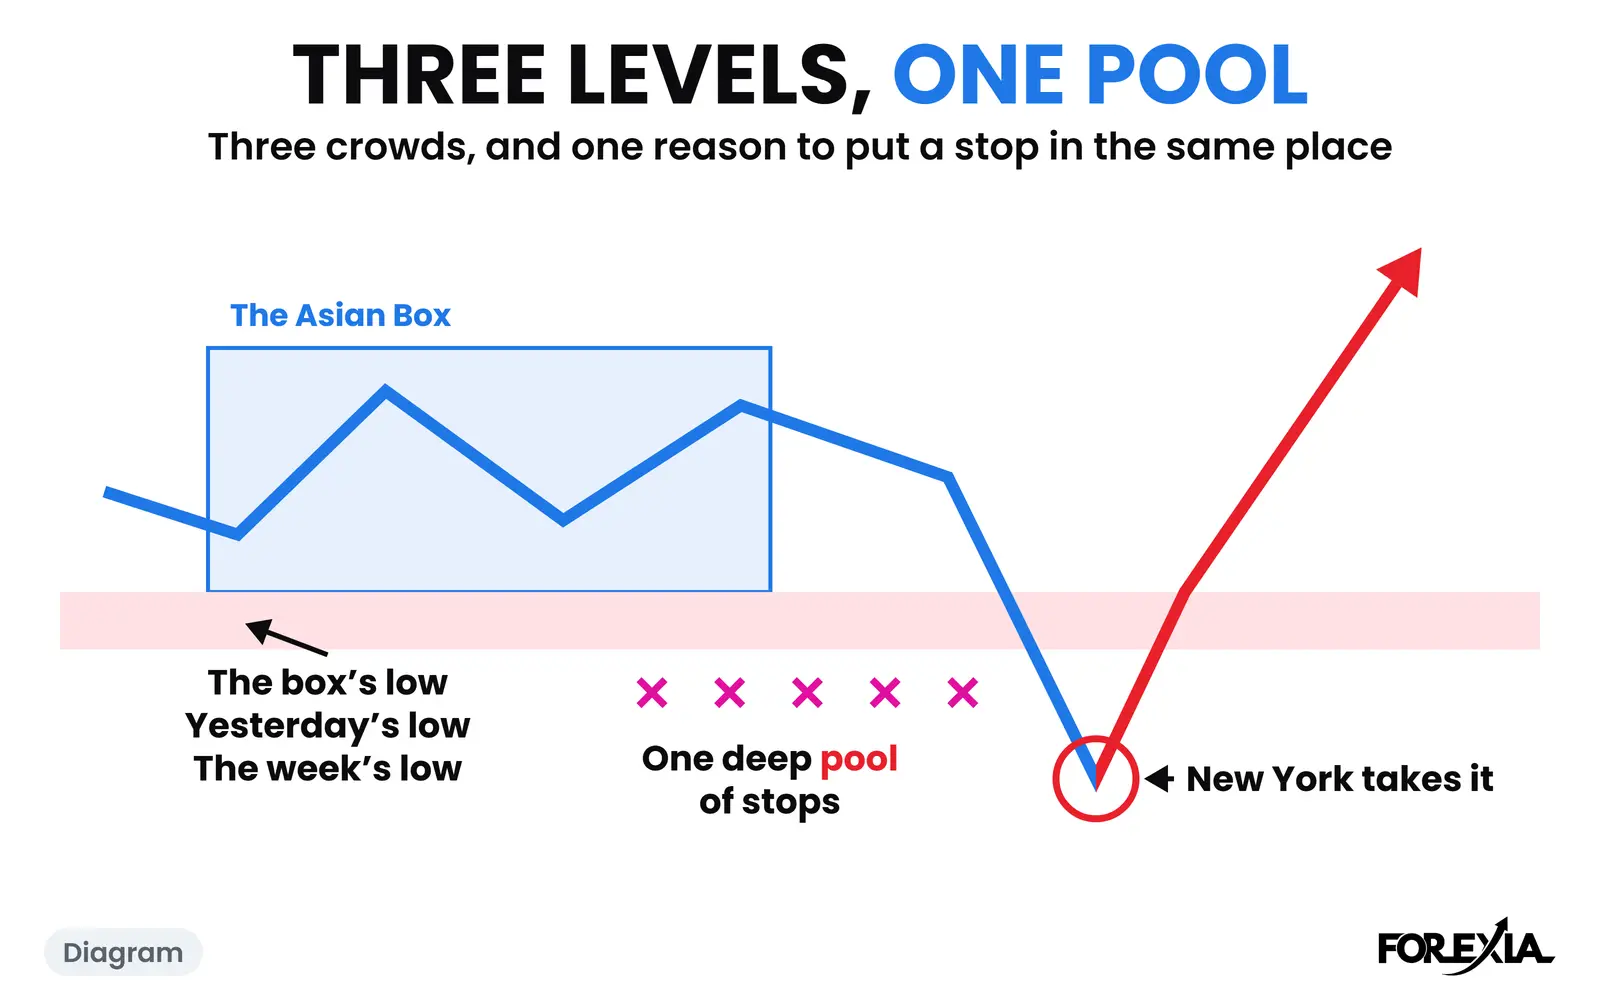
An institutional level trading strategy rests on a claim: big orders sit at certain prices. Nobody outside a dealer can see those orders. What you can see is which lines the whole crowd shares. On gold on Friday 17 July 2026 three such lines sat within $1.36, and New York took all three before turning $64. We read that as one pool.
On gold we count $1 as 1 pip. All times are New York, and a candle is named by when it opens. For who the institutions are and what they do all day, see institutional trading. This page is one day from the course, told as it came.
What is an institutional level trading strategy, really?
It is usually a list of prices with a story attached. The posts that rank for this search give gold a set of "institutional" levels for one session, a line about liquidity, and an entry, a stop and a target. We read several. None showed where the orders came from, and none checked its list against what happened next.
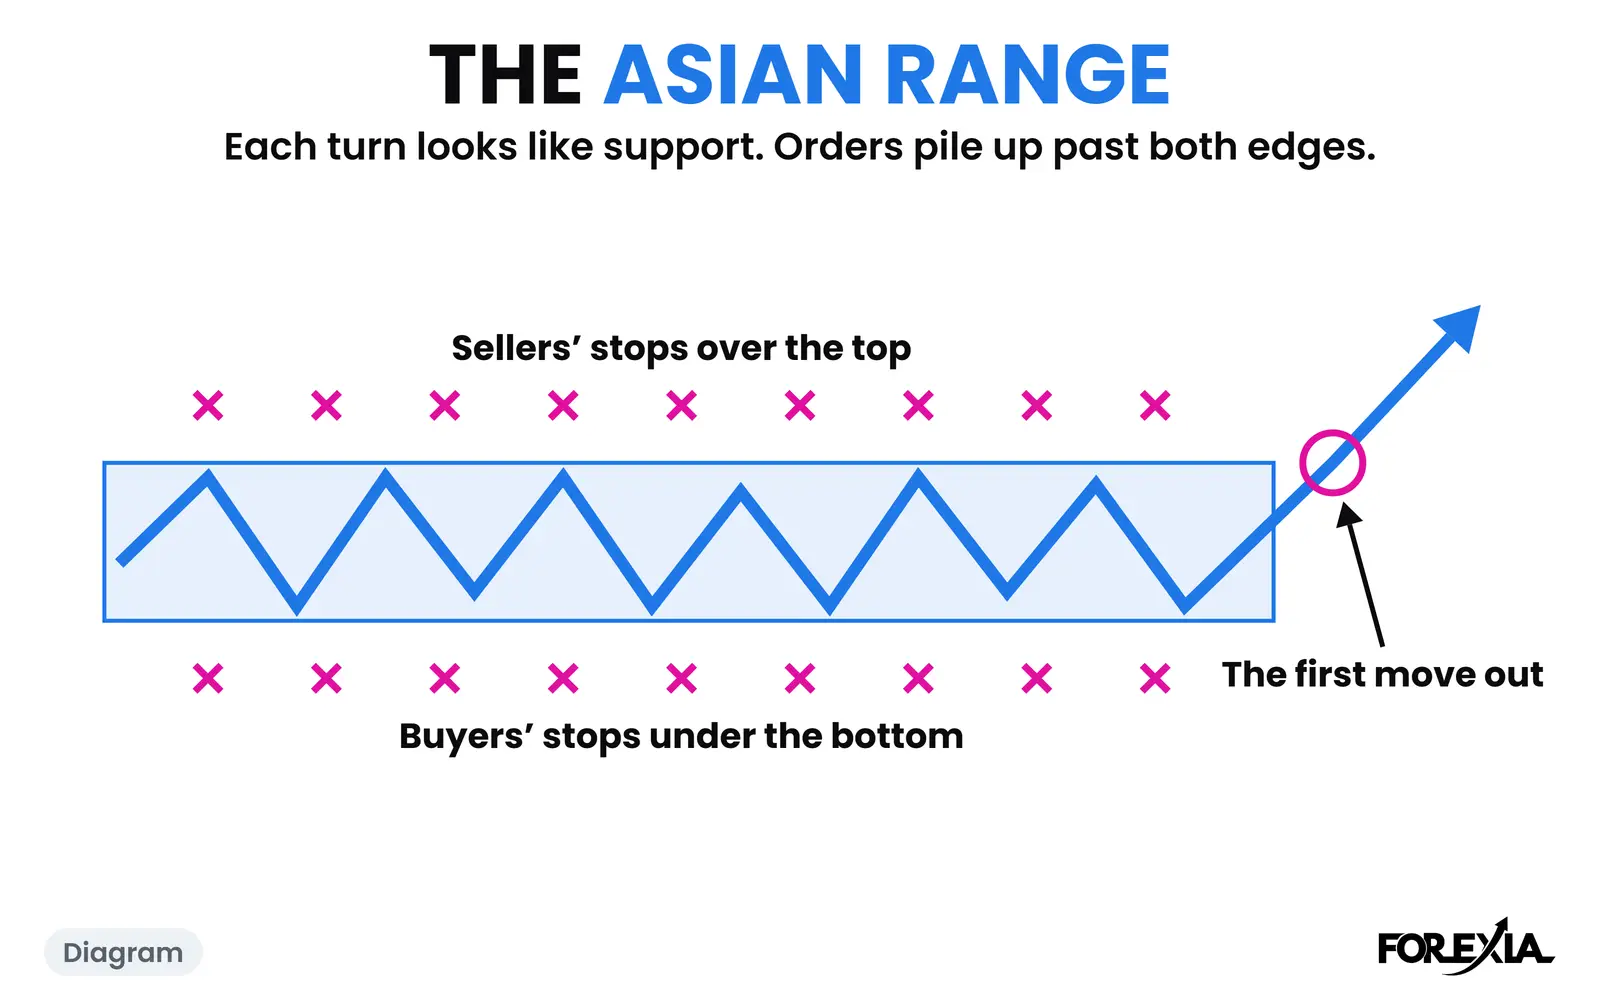
Our read starts somewhere plainer. A stop is an order that has not fired. The textbook tells every trader to put it just past the same few lines. So you need no view of any bank's book to know where the orders probably gather: under the low a crowd bought, over the high it sold. Marking those lines before the session is Liquidity Mapping. Finding liquidity pools in forex shows the method on a release morning. Gold trading has its own guide.
That is a reading of the structure. It is not order-book data, and the same goes for the word "trap".
What was on the map before London? Gold, Friday 17 July 2026
Before London, three lines sat in almost the same place, under a wide box. The candles to that point showed this.
| Line | Price | Where it sits |
|---|---|---|
| Week's high | 4103.27 | $95 over the box, from Sunday evening |
| Thursday's high | 4066.76 | $58 over the box |
| Top of the Asian Box | 4008.39 | Thursday 23:15 |
| Bottom of the Asian Box | 3970.41 | Thursday 22:30 |
| Thursday's low | 3969.05 | $1.36 under the box |
| The week's low so far | 3969.05 | The same candle |
Be plain about what that is. Three lines, and two of them the same price, since Thursday's low had also become the low of the week. It is three crowds' reasons to have a stop there: those who bought the box's bottom, those who bought yesterday's low, and those who bought the week's low. We read it as a deep pool, and we cannot see one order in it.
Thursday had built that low. The day's high of 4066.76 came on the Wednesday evening, US retail sales came at 08:30, and the low came at 15:30.
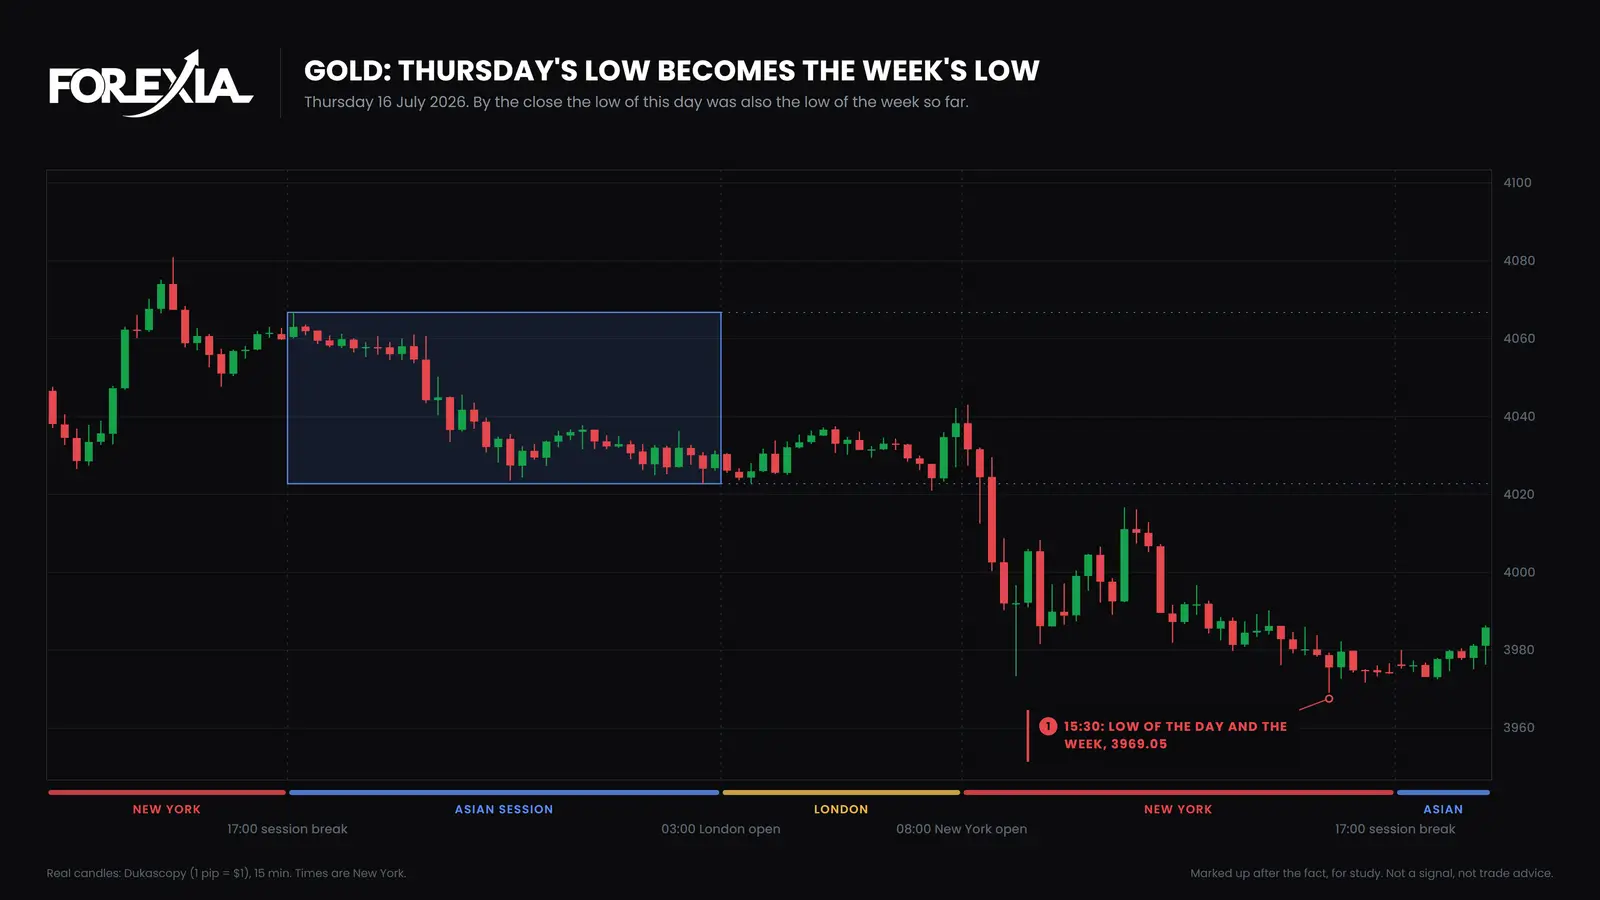
The box itself was no clean picture. At $38 it was 38% of gold's 101-pip average day, it drifted, and it closed near its top.
The calendar for Friday had US building permits and housing starts at 08:30, industrial production at 09:15, and consumer sentiment at 10:00, the only high-impact one of those.
What did New York do with the pool?
It took it, in three candles, and London never came close. London traded between 3987.59 and 4002.45, inside the box the whole way. To anyone watching from the first seat, nothing happened for five hours.
Then the 08:30 candle, on the housing figures, opened at 3987.13 and fell to 3965.26. That is $5.15 under the box and $3.79 under Thursday's low, in a $23 candle. It closed at 3969.41, a few cents above Thursday's low and still outside the box. The 08:45 candle went to 3963.89.
The 09:00 candle printed the low of the day and of the week: 3959.49. That is $11 under the box and $10 under Thursday's low. It closed at 3969.82, back above Thursday's low. To a seller, the whole sequence was a breakdown through three levels at once. We read it as the stop hunt, which most traders call a liquidity sweep.
The low came in the candle before the 09:15 release, not on it, though the 08:30 figures had already moved price.
The 09:30 candle ran up to 4003.45 and closed at 3984.82, back inside the box. That is the Close Back. Price went over the top of the box in the 11:00 candle, and reached 4023.64 at 12:15, 3 hours 15 minutes after the low. Friday ended at 4013.97.
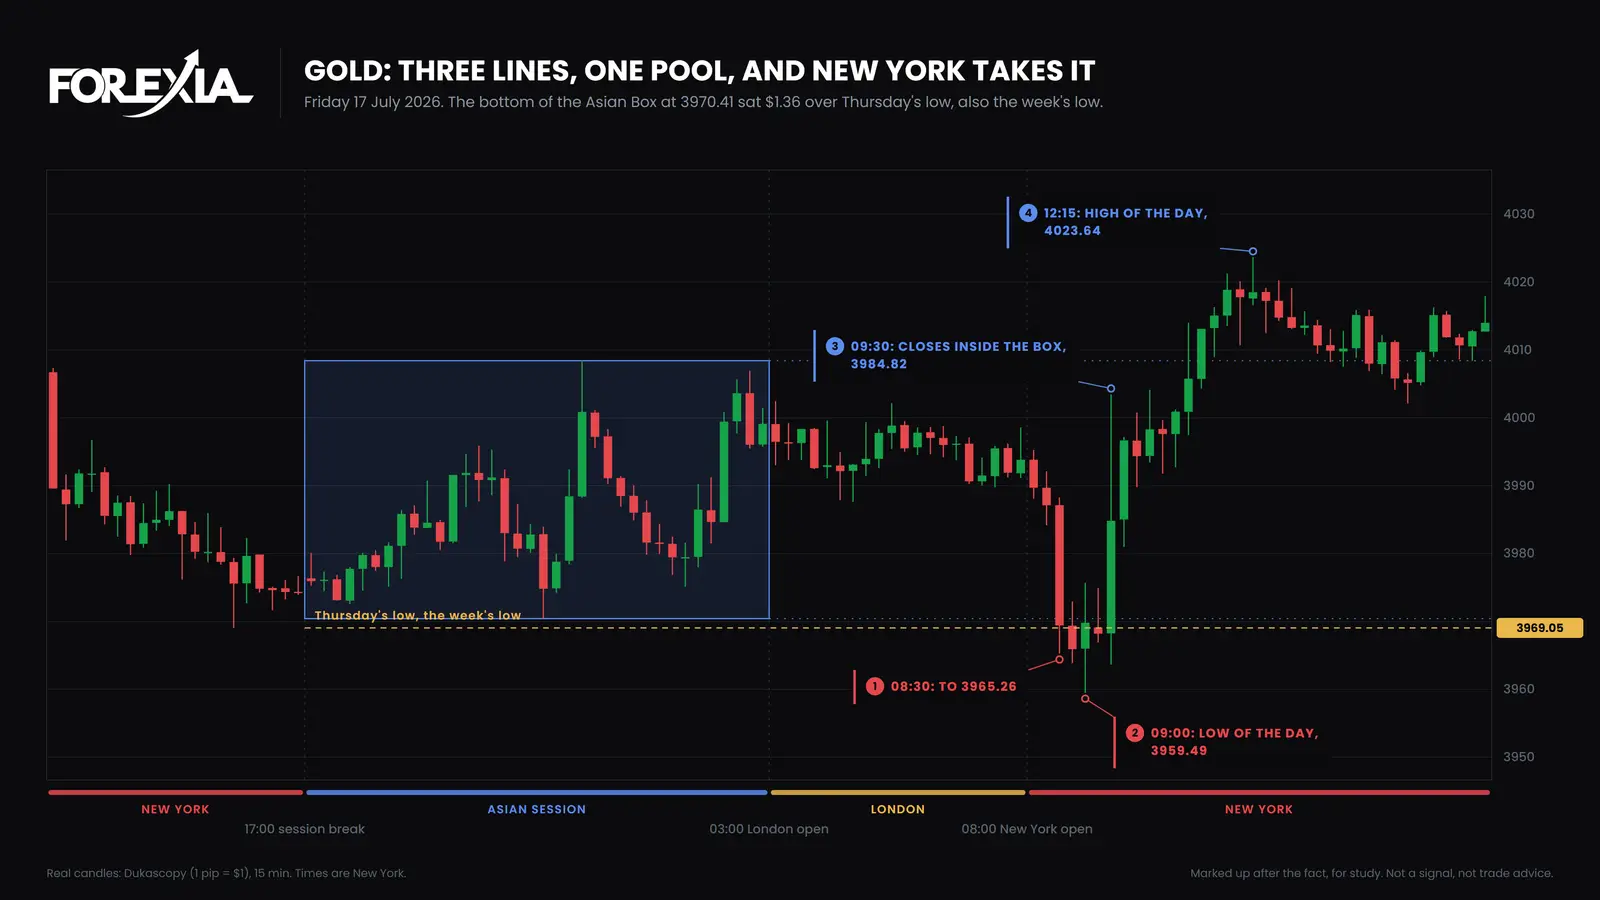
That $64 is about two thirds of gold's average day, and it cleared the whole box. In the next session, Monday 20 July, gold's low was 3981.93, $22 above the low of 17 July.
What did each seat see on gold that morning?
Three people could look at the same 45 minutes and see three different mornings. These are the three seats.
- Retail saw support, then a breakdown. Buy the bottom of the box with a stop under it, or sell the break under the week's low. Both stops were in the same few dollars.
- The market maker, as we read it, saw a pool. Anyone with size to buy needs sellers, and sellers came together: the longs' stops and the breakdown sellers, all in three candles.
- The observer saw the order of events. A line everyone could see, a push past it, a close back. The observer cannot say who bought 3959.49. It can say that anyone who sold at 3965.26 was $20 under water when the 09:30 candle closed.
What does this one day not show?
It does not show that the method works, and it is not a day we chose at random. It is a clean one. Other days do not go this way: on some the pool is right and the turn stalls short, and on others the lines never meet, so there is no pool like this one to read.
It also cannot show who moved price, or that anyone aimed at those stops. It came with US data that morning, so a chart cannot separate the release from the level. We read the shape as a pool being taken, and that is a reading.
Nor is a level list a strategy. Run as a mechanical rule, trading against these hunts did not make money in our own test: many have another leg, and some start a trend. A day like this, seen afterwards, is not a setup.
For another gold week, with a different shape, see the gold W markup of 3 August 2026.
What goes wrong with an institutional level trading strategy?
Three errors recur, and all three come from trusting the label.
- Treating a level list as knowledge. A line is not an order. "Institutional" on a post names nobody and shows nothing. Ask who could see it.
- Counting lines instead of prices. Thursday's low and the week's low were one price here. It reads as three levels and it is one place.
- Judging a list by 17 July. This day was picked because it was clean, and a page that shows only the clean one flatters the idea. It says nothing about how often a list of levels does this.
Course 1 of ForexiaPRO, Reading the Map, teaches this read step by step in lesson 1.4.1, Six Real Days, Mapped.
Frequently asked questions
What are institutional levels in trading?
Guides use the phrase for prices where big orders are said to rest: round numbers, old highs and lows, session ranges. Nobody outside a dealer can see those orders. What you can see is which lines the whole crowd shares, and we read the stops and breakout orders as gathering just past them.
How do you find liquidity levels on gold?
On gold on 17 July 2026 they were lines any trader could see. The bottom of the Asian range sat $1.36 over Thursday's low, which was also the week's low. We read those lines, that close together, as one deep pool.
Do market maker traps happen on gold?
Gold makes the same shape as the currencies: a push past a level the crowd can see, then a close back. On 17 July 2026 it went $11 past the Asian low and turned $64. A chart cannot show who did it or why. 'Trap' is our reading of the structure, not something the data proves.
Does this make an institutional level trading strategy profitable?
This page shows one day. Seen afterwards, it is not a setup, and it was picked because it was clean. Run as a mechanical rule, trading against these hunts did not make money in our own test, because many have another leg and some are the start of a trend.