
How to Trade Gold (XAUUSD): What Moves It, Pips, Timing and Real Marked-Up Days
How to trade gold: the short answer
To trade gold, you first need to know what a dollar of movement costs you, when gold usually moves, and which cause the market is pricing today. Then you mark where the crowd's stops are likely to rest and read how price behaves there. This page reads all of that on real XAUUSD days. It gives no entry and no forecast.
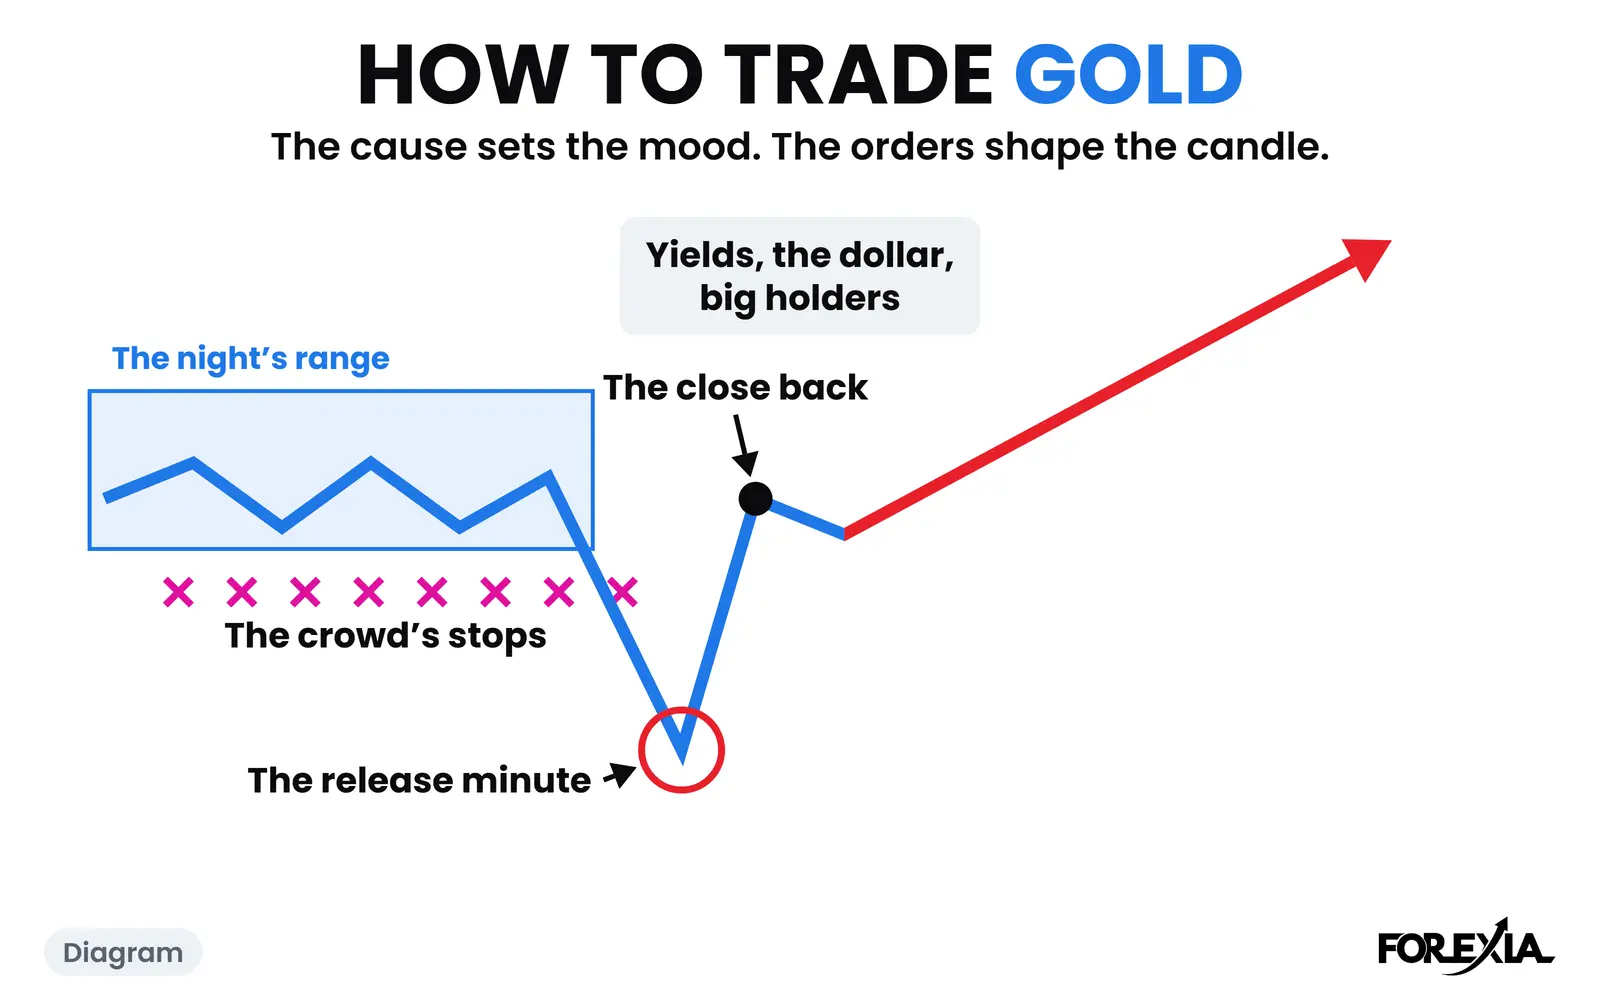
On our charts we count $1 as 1 pip on gold, and every pip on this page means that. The times are New York, and the candles are Dukascopy's bid, so your broker's chart may differ by more than a pip on gold.
One thing up front. We ran intraday rules on gold with real costs and they lost money. Reading a chart well is not the same as having an edge, and the section on our tests says how far that goes.
What moves the gold price?
Gold pays no interest and is priced in dollars, so most large moves come back to what else a holder could own and who is buying or selling. Each cause has a public number you can check.
| Cause | Why it matters | Where to check |
|---|---|---|
| Real yields | A Treasury's yield after expected inflation is what a holder of gold gives up | 10-year real yield, from the Federal Reserve's H.15 data |
| The dollar | A firmer dollar makes gold dearer in every other currency | EUR/USD beside gold, over the same hours, and the Fed's broad dollar index |
| Central banks | Slow, large buyers and sellers, reported weeks late | World Gold Council, Gold Demand Trends |
| Funds | Futures funds and gold funds can sell in the same month others buy | The CFTC's weekly COT report, and ETF flows in Gold Demand Trends |
| Fear | A safety bid comes and goes with the news | No clean number |
Here is what those numbers look like at their clearest. The World Gold Council puts gold's record at $5,405 on 29 January 2026 and its September finish at $4,176, and it calls a rise in yields and a stronger dollar "major contributors" to that month's drop. In the second quarter of 2026 central banks bought 289 tonnes while gold funds lost 45. So a central bank headline can be true and still not be today's reason.
These links are loose, and they explain a move better after it has happened. On 9 June 2026 gold fell 69 pips while yields closed lower and EUR/USD closed higher. Why gold is falling walks through that day and gives a check you can run, why gold goes up takes the other side, and what moves gold owns the causes in full.
XAUUSD analysis: what do we read that a forecast does not?
Most XAUUSD analysis gives a direction and some levels. We read three things in order, and the answer is often "nothing to say yet".
- The cause. Which number moved, and did gold move with it? If nothing fits, that is a real answer.
- The map. Where the obvious levels are: the Asian Box, the previous day's high and low, the week's high and low. Marking them before the session is what we call Liquidity Mapping.
- The candle. Whether price runs past a level and closes back, or stays past it.
The Three Seats split gold's day the same way as a currency's. Retail sees a headline and a break. The market maker, on our read, sees where the orders are and uses a known minute to fill against them. The observer checks the data and the chart, and says which of them can be shown. Our read is that market makers build the chart. Nobody outside can see those orders, and we cannot say who moved any candle.
XAUUSD pips, lot size and the one-dollar rule
A dollar is one pip on our charts, and that is a choice, not a standard. Most brokers quote gold to two decimals, so one broker's "pip" is $0.10, a calculator's is $0.01, and ours is $1. The same $20 move reads as 20, 200 or 2,000 pips. That is why two gold posts can disagree by a factor of ten and both be right.
Work in dollars and you avoid the problem. The COMEX gold contract is 100 troy ounces, and we take a lot as that size. That is our convention, because no exchange sets a lot of spot XAUUSD:
| Position | Ounces | $1 of movement | A 100-pip day on our count |
|---|---|---|---|
| 1.00 lot | 100 | $100 | $10,000 |
| 0.10 lot | 10 | $10 | $1,000 |
| 0.01 lot | 1 | $1 | $100 |
Brokers set their own contract sizes, so read yours before you size anything. As plain arithmetic, a $20 move against 0.05 lot costs $100, because 0.05 lot is 5 ounces. The XAUUSD pip value page goes through the conventions one by one.
Best time to trade gold, by session break
The best time to trade gold, if the goal is movement, is the London and New York overlap: 15 to 19 hours after the 17:00 New York session break, or 08:00 to 12:00 New York while both cities are on summer time. We count from the session break because that holds when the clocks change, as our sessions guide explains.
We counted gold's 127 market-days from 6 April to 1 October 2026, on 15-minute candles. A day runs from break to break, and the low of its first candle is cut to its body, because that wick is often only the spread.
| Window, from the session break | New York time | Median range, pips | Pips an hour | Day's high printed here | Day's low printed here |
|---|---|---|---|---|---|
| Asia, 0 to 10 hours | 17:00 to 03:00 | 54 | 5.4 | 59 | 54 |
| London alone, 10 to 15 hours | 03:00 to 08:00 | 33 | 6.6 | 10 | 12 |
| Overlap, 15 to 19 hours | 08:00 to 12:00 | 50 | 12.5 | 37 | 35 |
| New York after London, 19 to 24 hours | 12:00 to 17:00 | 31 | 6.1 | 21 | 26 |
Three things stand out. The overlap moves about twice as fast as any other window. London alone prints far fewer of the day's extremes than the usual advice suggests. And gold's night is not quiet: it holds 113 of the 254 highs and lows, and a median night is about half of an average day, against 40% on EUR/USD. On our feed gold's candles start an hour after the break, so its night moves nearer 6 pips an hour than 5.4.
Range is not profit. These are the hours the releases land in, when spreads can widen, and over the whole record our fixed test lost money in London and in New York. New York stayed above zero only in 2012-14. The hour-by-hour read is on XAUUSD trading hours.
Gold on news days: NFP, CPI and FOMC
Gold moves most on the US jobs report, inflation and the Fed's decisions, because each can change what the market expects from rates. The release sets the minute more reliably than the direction. On 5 June 2026 a report that beat forecasts came with a fall. On 2 October a weak one came with a fall too.
Friday 7 August 2026 went up. Gold sat over its 69-pip Asian Box, whose high was 4298.57, and the 08:15 candle dipped to 4300.82, 2 pips above that line. Nonfarm Payrolls landed on the next candle, which ran from 4308.55 to 4370.57 and closed at 4366.81. The next candle printed the day's high, 4371.69. Then it came off: 4327.13 by 10:00, and the day ended at 4340.40. After the release no candle closed back under the box, so this was a break and not a hunt.
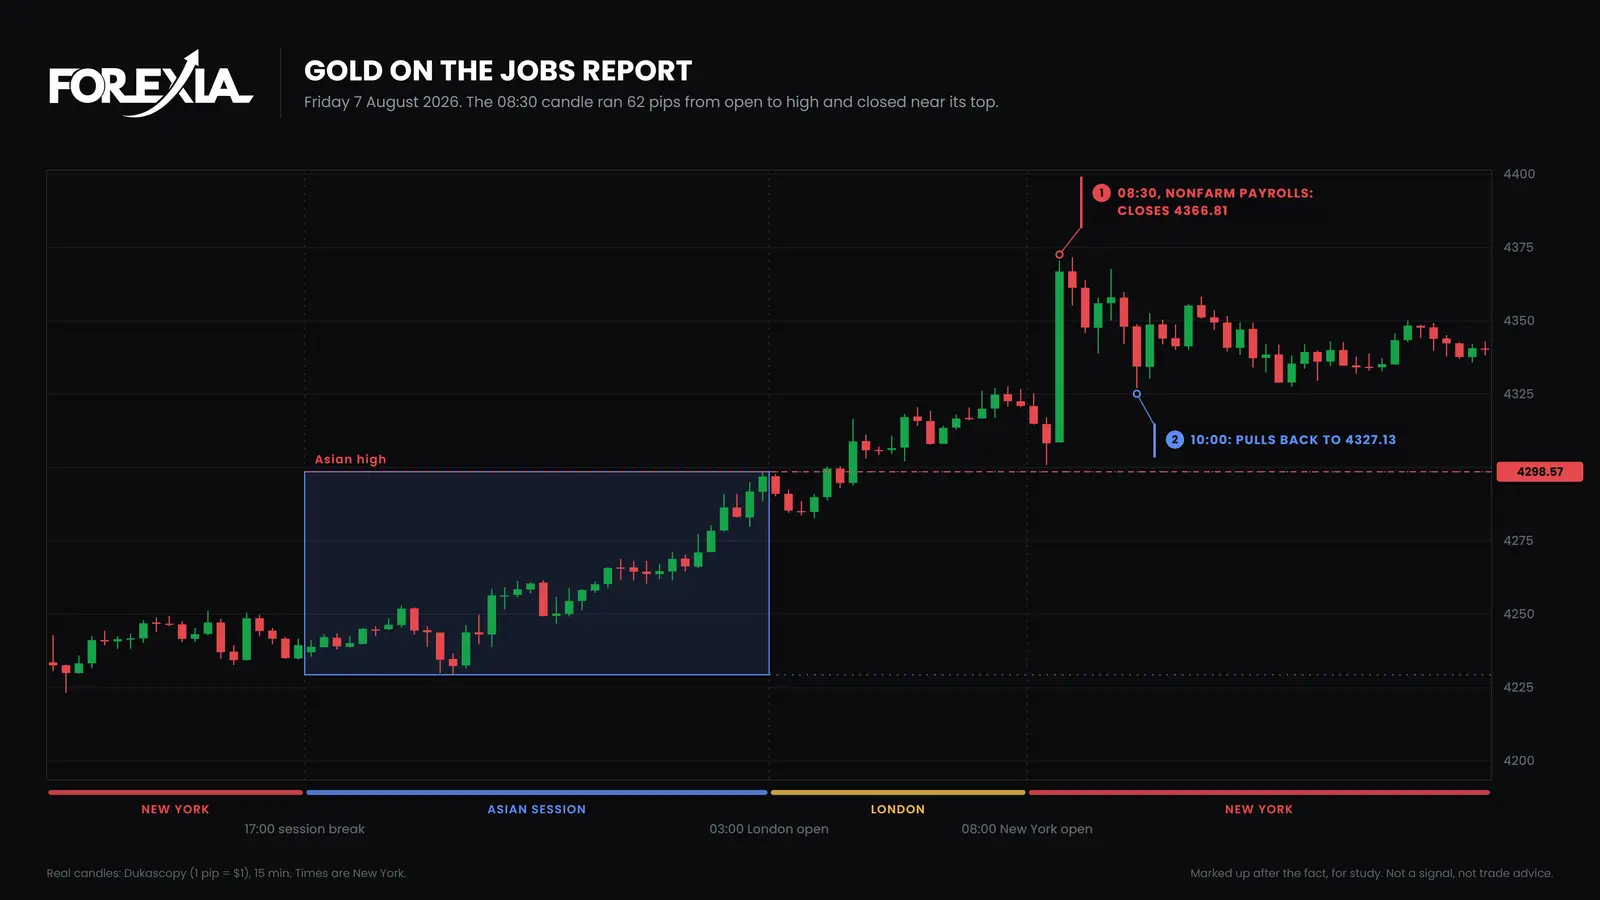
Orders gather around a minute everyone knows, and we call that News-Induced Liquidity. In our count from 2021 to 2026, 16% of gold's hunts printed within 15 minutes of a high-impact release, against 4% of the breaks that stayed. So a release is a common place for a hunt, and a hunt needs no release: neither hunt below had a high-impact one on its candle.
Each release has its own page: how NFP moves gold, how CPI moves gold and gold on FOMC day. The news trading guide covers the minute itself on all markets.
Gold liquidity sweeps and stop hunts, on real days
Gold makes the same move as a currency. The stop hunt is a run past an obvious level into the stops behind it, what most traders call a liquidity sweep, and the close back is a candle finishing back inside. These three days were marked up afterwards, for study. None is a signal.
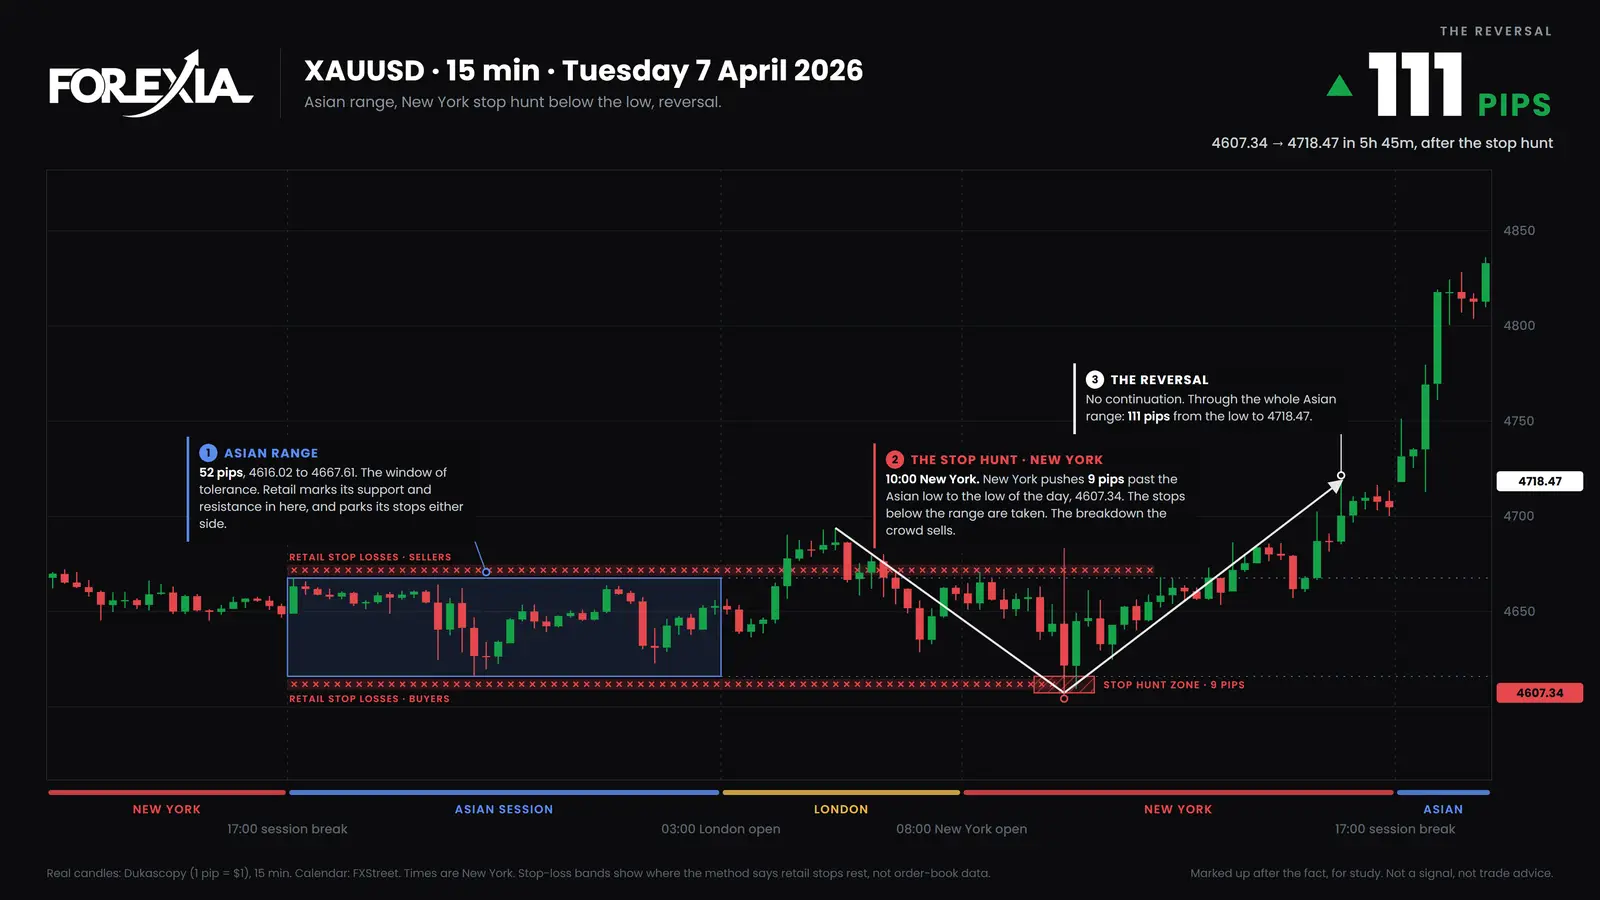
A New York hunt: Tuesday 7 April 2026
Asia left a 52-pip box, 4616.02 to 4667.61. London traded above it and came back, and at 10:00 New York a candle fell to 4607.34, 9 pips under the box. That is the breakdown the crowd sells. The same candle closed at 4621.68, back inside. No US release landed on it. Canada's Ivey PMI, medium-impact, did, and the nearest US items were medium-impact too: durable goods at 08:30 and a Fed speaker at 08:40.
We read that as the stops under the night's low filling someone's buying. By 15:45 gold was at 4718.47, 111 pips off the low, and the day ended at 4704.78.
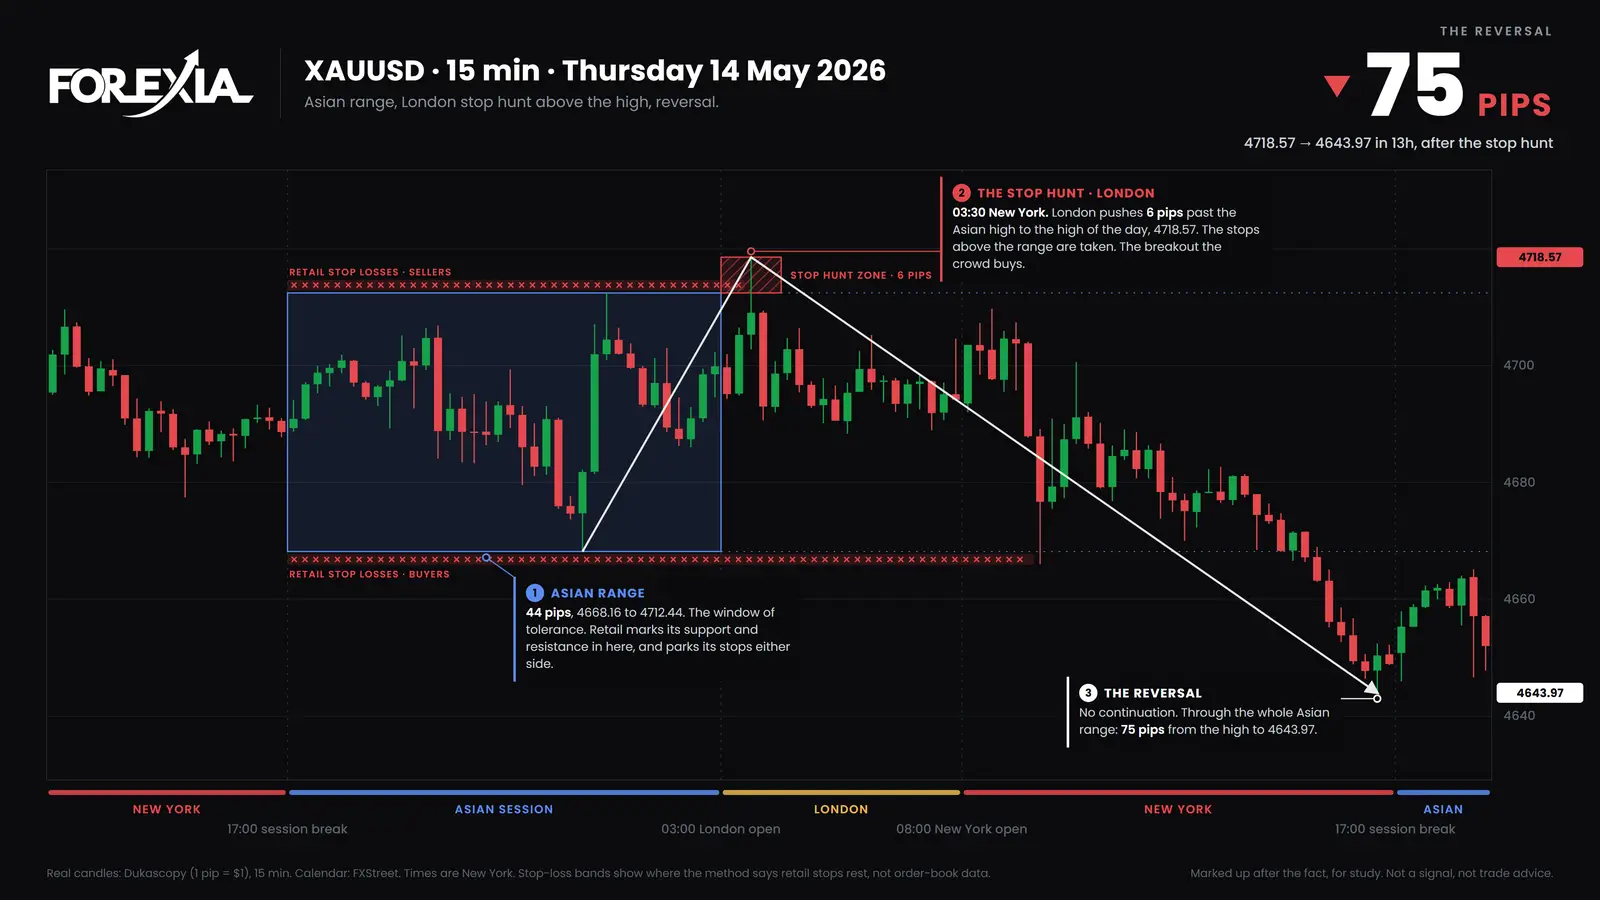
A London hunt: Thursday 14 May 2026
The mirror came about five weeks later. Asia left a 44-pip box, 4668.16 to 4712.44. At 03:30, half an hour into London, a candle ran to 4718.57, 6 pips over the box, the breakout the crowd buys. It closed at 4709.05, back inside.
US retail sales, a high-impact release, came at 08:30, and that candle moved only 12 pips. The fall came slowly: 4643.97 by 16:30, 75 pips off the high, with the first close under the box at 15:00. The day ended at 4648.90.
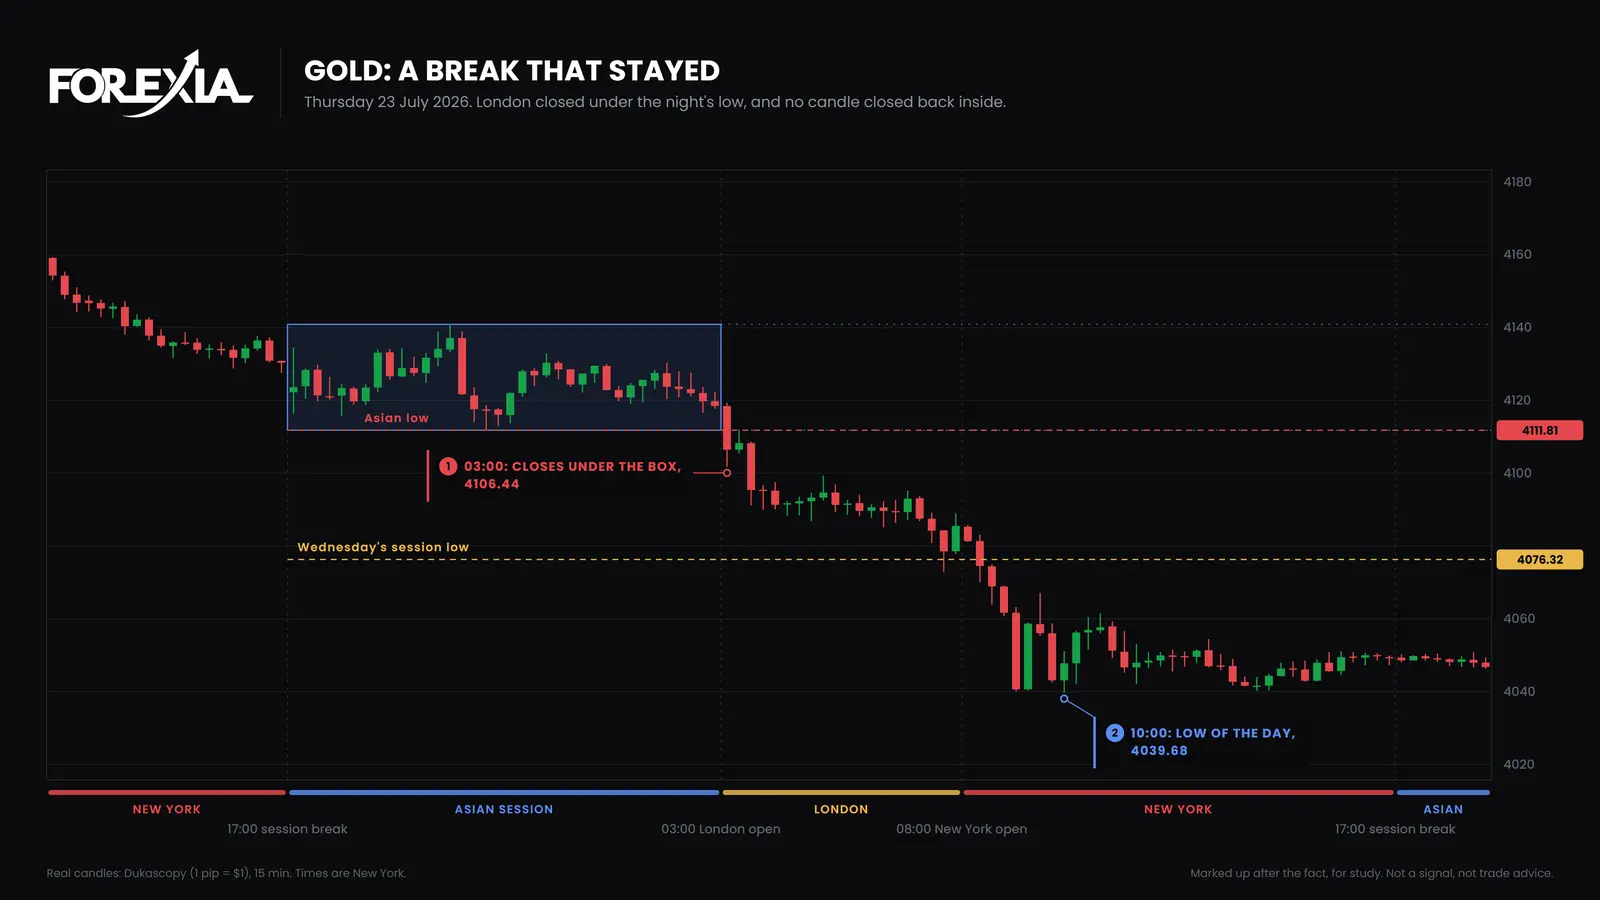
A break that stayed: Thursday 23 July 2026
This one looked the same for one candle and never came back. Asia left a 29-pip box, 4111.81 to 4140.90. At 03:00 London's first candle closed at 4106.44, under the box. The next candle touched 4111.97 and closed under the line again, and no candle closed back over it that day.
Gold went through Wednesday's session low of 4076.32 at 07:30 and closed under it at 08:15, reached 4039.68 at 10:00, 72 pips under the box, and ended the day at 4049.38. The only US item on our calendar that morning was medium-impact jobless claims at 08:30. The ECB's high-impact decision came at 08:15, the candle that closed under Wednesday's low. Anyone reading the first break as a hunt was run over. On this day the sellers of the break were right.
How often does gold do each?
About as often as EUR/USD, once you allow for its size. These figures cover 2021 to 2026 on Dukascopy candles, 1,488 trading days. A hunt here means the day's high or low printed in London or New York past the Asian range, then price came back at least 0.4 of the average daily range, inside the range. That definition needs the day to be over.
| 2021 to 2026 | Gold | EUR/USD |
|---|---|---|
| Breaks of the Asian range that became a hunt | 47% | 49% |
| Hunts a week | 2.9 | 3.2 |
| Median hunt past the Asian range, pips | 7 | 16 |
| The same, as a share of the average day | 23% | 23% |
| Hunts that printed in New York | 67% | 56% |
On gold the busiest hours for a hunt were 08:00 (22%), 09:00 (21%) and 10:00 (14%) New York. So gold's hunts are mostly a New York matter, as gold stop hunts at the New York open shows.
A second count, with a different rule, is a warning. From 6 April to 1 October 2026 we took each edge of the Asian Box and each previous-day high or low that gold traded past by at least 3% of its average day: 184 of them. A candle closed back on 151 by 17:00. After 96 of those close backs, a later candle went past the furthest price anyway. A close back is a read and not a promise. Gold liquidity sweeps has more days, gold's M and W patterns the two-legged version, and our weekly M on gold and W on gold are marked up in full.
Gold and the COT report, and across the week
The COT report needs more care on gold than on a currency. Large speculators were net long in every report on our gold COT page, so a "crowded long" reading says less there than it does elsewhere. Our general read of Fade the Crowd does not carry over either: in our test, gold alone went the other way, on too few trades to build a rule on.
Across the week, gold's days differ less than its reputation suggests. This is the median range by weekday on the same 127 market-days:
| Monday | Tuesday | Wednesday | Thursday | Friday | |
|---|---|---|---|---|---|
| Median range, pips | 86 | 98 | 106 | 92 | 91 |
| Days | 26 | 26 | 26 | 26 | 23 |
A bigger day is not a better trade, and 25 weeks and four days is not much. The forex weekly cycle reads how a week unfolds, and the WTF Reversal is its back half. Gold in the week of 11 May 2026 is one of its examples.
What we tested on gold, and what failed
We ran our setup on gold as a fixed rule, with no judgement, and it lost money in every period. The test used Dukascopy's 5-minute bid and ask from 2012 to 2 October 2026, the real spread on every bar, and $0.15 a round trip for commission and slippage. Across four periods and 3,884 trades it lost between -0.089R and -0.146R a trade. R is the amount risked on a trade.
Other rules we ran on gold failed as well, including the published overnight pattern and Gann's Square of Nine levels. Trend rules stayed above zero in a market that rose, which is a different statement.
This is why this page gives no gold trading strategy. It does not show that a person reading the chart loses, or wins: judgement is not tested, it is one data source, and real fills around a release are worse than 5-minute candles show. The wider test and its limits are on the stop hunt page. Every day above was picked after the fact, and a reversal seen afterwards is not a setup.
Risk on gold: why the swings are wider
Gold's swings are wider because a dollar is a small part of its price, its average day has grown, and each dollar costs more on a lot than a pip does on EUR/USD. Three comparisons show it.
- Against its own past. From 2021 to 2026 gold's average day was $45 and its median Asian range $13. From April to October 2026 its average day was about $101 and its median night $54. A distance that fitted gold in 2022 is noise in 2026, so measure the market you are in.
- Against EUR/USD, by share of price. In that 2026 sample gold's average day was 101 pips and EUR/USD's 56. At a gold price of 4,300 and a euro of 1.15, that is about 2.3% against 0.5%.
- Against EUR/USD, in dollars. On a standard lot, that day is about $10,100 on gold and $563 on EUR/USD, roughly 18 times as much. The same lot size is not the same risk.
Two costs are easy to miss. A typical spread of $0.39 from 2021 to 2026 is $39 on a 100-ounce lot, and it can widen around a release and at the rollover. Gold also gaps: over 25 weekends from April to September 2026 the median gap between Friday's close and Sunday's open was 15 pips, and on 12 April it was 112, from 4746.94 to 4635.00. A stop does not protect you from a gap.
Our stop hunt guide covers what a wider stop does and does not fix. Leveraged gold can lose more than you expect very quickly, so the first question on any gold trade is what a dollar costs you.
Course 3 of ForexiaPRO, Reverse Price Action, teaches the hunt and the close back step by step, and Course 2, The Chaos Pattern, teaches the news minute.
Questions
- Why Is Gold Falling? Real Yields, the Dollar, Who Is Selling, and How to Check
Why is gold falling? Real yields, the dollar or big holders selling, how to check which today, and three real falls set against the data on our own charts.
Frequently asked questions
How do you trade gold?
Know three things before anything else: what a dollar of movement costs on your position, when gold moves, and which cause the market is pricing today. Then mark where stops are likely to rest and read how price behaves there. This page reads that on real days and gives no signal. Our own fixed intraday rules on gold lost money after costs, so reading a chart is not the same as having an edge.
What is the best time to trade gold?
If the goal is movement, the London and New York overlap, 08:00 to 12:00 New York, which is 15 to 19 hours after the 17:00 session break. In our count from April to October 2026 gold's median range was 50 pips in those four hours. More movement is not a better trade: the same hours hold the releases, and over the whole record our fixed test lost money in both sessions.
Is one dollar one pip on XAUUSD?
On our charts, yes: we count $1 as 1 pip on gold. There is no single standard. Many brokers and calculators call $0.10 or $0.01 a pip, so the same move can read as 1, 10 or 100 pips. Dollars are the safe unit: on a 100-ounce lot, $1 of movement is worth $100.
What moves the gold price?
Over weeks and months, mostly real yields, the dollar and what large holders do: futures funds, gold funds and central banks. Over minutes, scheduled US releases and the orders resting around obvious levels. The links are loose. Gold can fall on a day when yields fall, as it did on 9 June 2026, so check the data rather than the headline.
What is the best gold trading strategy?
We cannot name one. Every intraday rule we ran on XAUUSD lost money after costs. Trend rules stayed above zero in a market that rose, which is a different statement. Anyone selling a gold strategy should be asked for its costs, sample and losing periods.
How much is a pip on gold worth?
It depends on what your broker calls a pip and on your lot size, so start from dollars. We take a lot as 100 ounces, the size of the COMEX contract. That is our convention, and brokers set their own. So $1 of movement is $100 on 1.00 lot, $10 on 0.10 and $1 on 0.01. Check the contract size in your broker's specification.
Does gold get stop hunted?
Gold makes the same move as forex: a run past an obvious level, then a candle closing back. From 2021 to 2026, 47% of breaks of its Asian range ended as a hunt by our definition, close to EUR/USD's 49%. That is a count of finished days. It says nothing about who moved the price, and you only know which break it was afterwards.
Can anyone predict where gold goes next?
Not reliably, and this page does not try. Yields, the dollar and central bank figures explain moves afterwards better than they forecast the next one. Central bank figures also arrive weeks late. A mapped level says where orders may rest, not whether price will go there.
The latest chart markups
- FOMC Stop Hunt: Forex Chart Markups, 14 September 2026
The FOMC stop hunt completed M formations on gold, AUDUSD and NZDUSD in the candle of the Fed decision. Chart markups, 14 September 2026.
- AUDUSD Stop Hunt: Forex Chart Markups, 24 August 2026
An AUDUSD stop hunt in London set the low of the week, and a second one on Friday set the high. Chart markups, week of 24 August 2026.