
The Week's High and Low: the Biggest Pool of Stops, and Why It Moves
The Week’s High and Low are the biggest pool of stops on the chart, and the pool the WTF Reversal runs for. Each is only the furthest price so far until the week is over, so the map moves every day. "Biggest" is our reading: stops build up behind a week's trend for days, and no public book shows them.
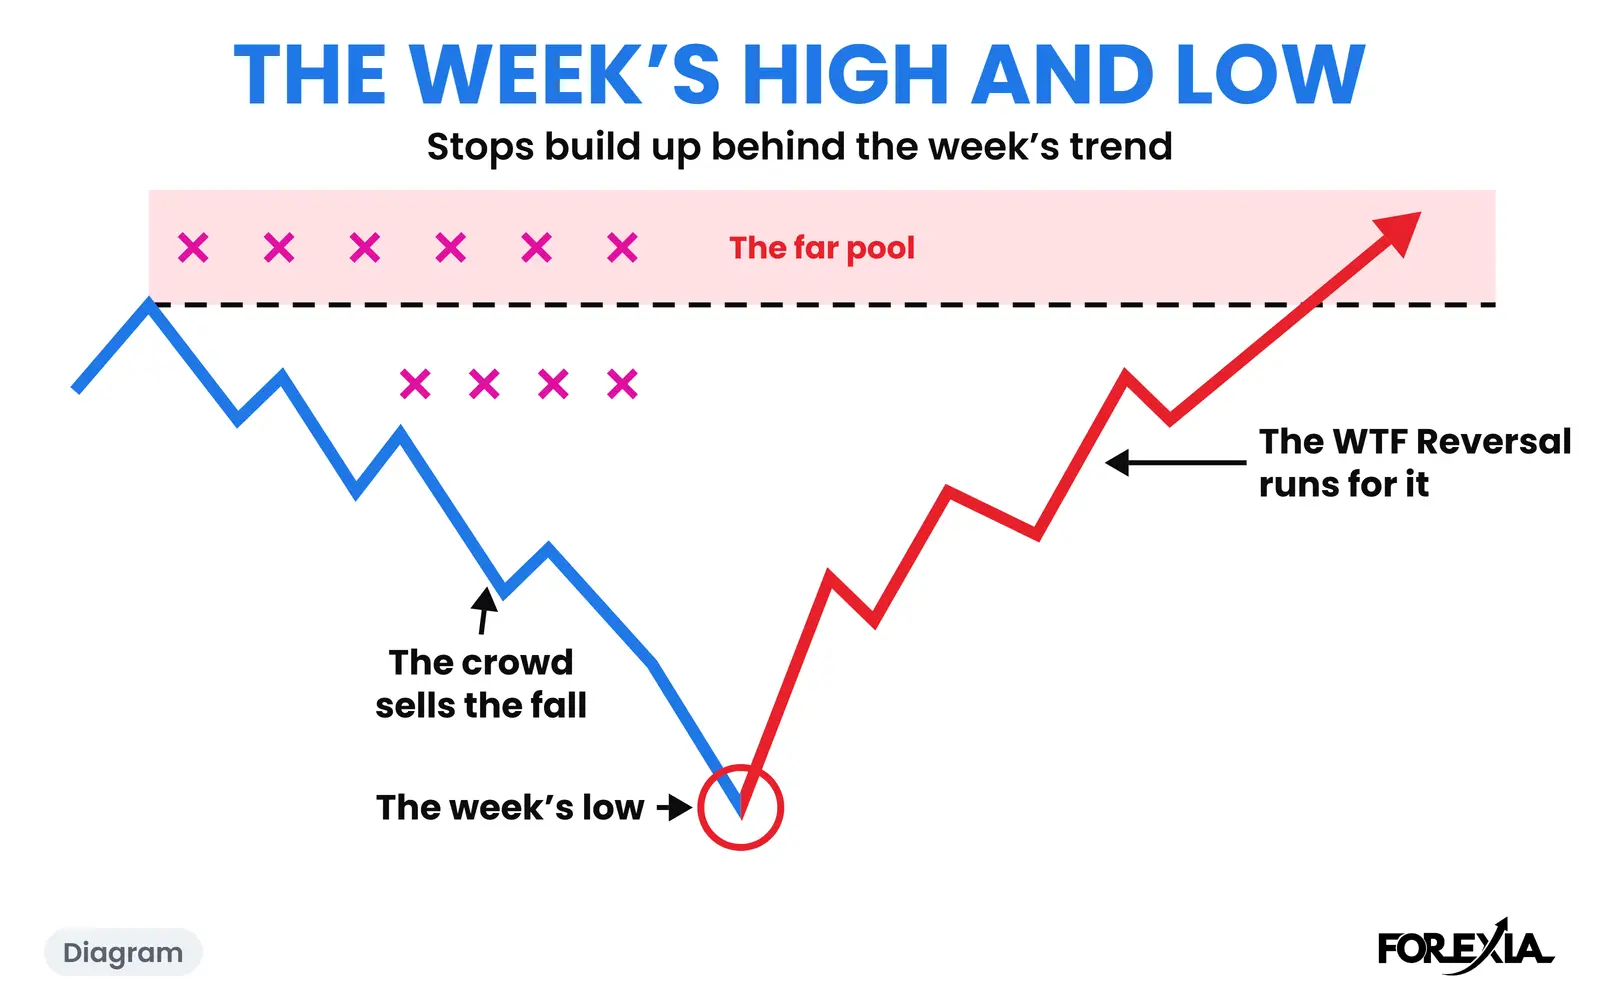
What do the Week's High and Low look like on a chart?
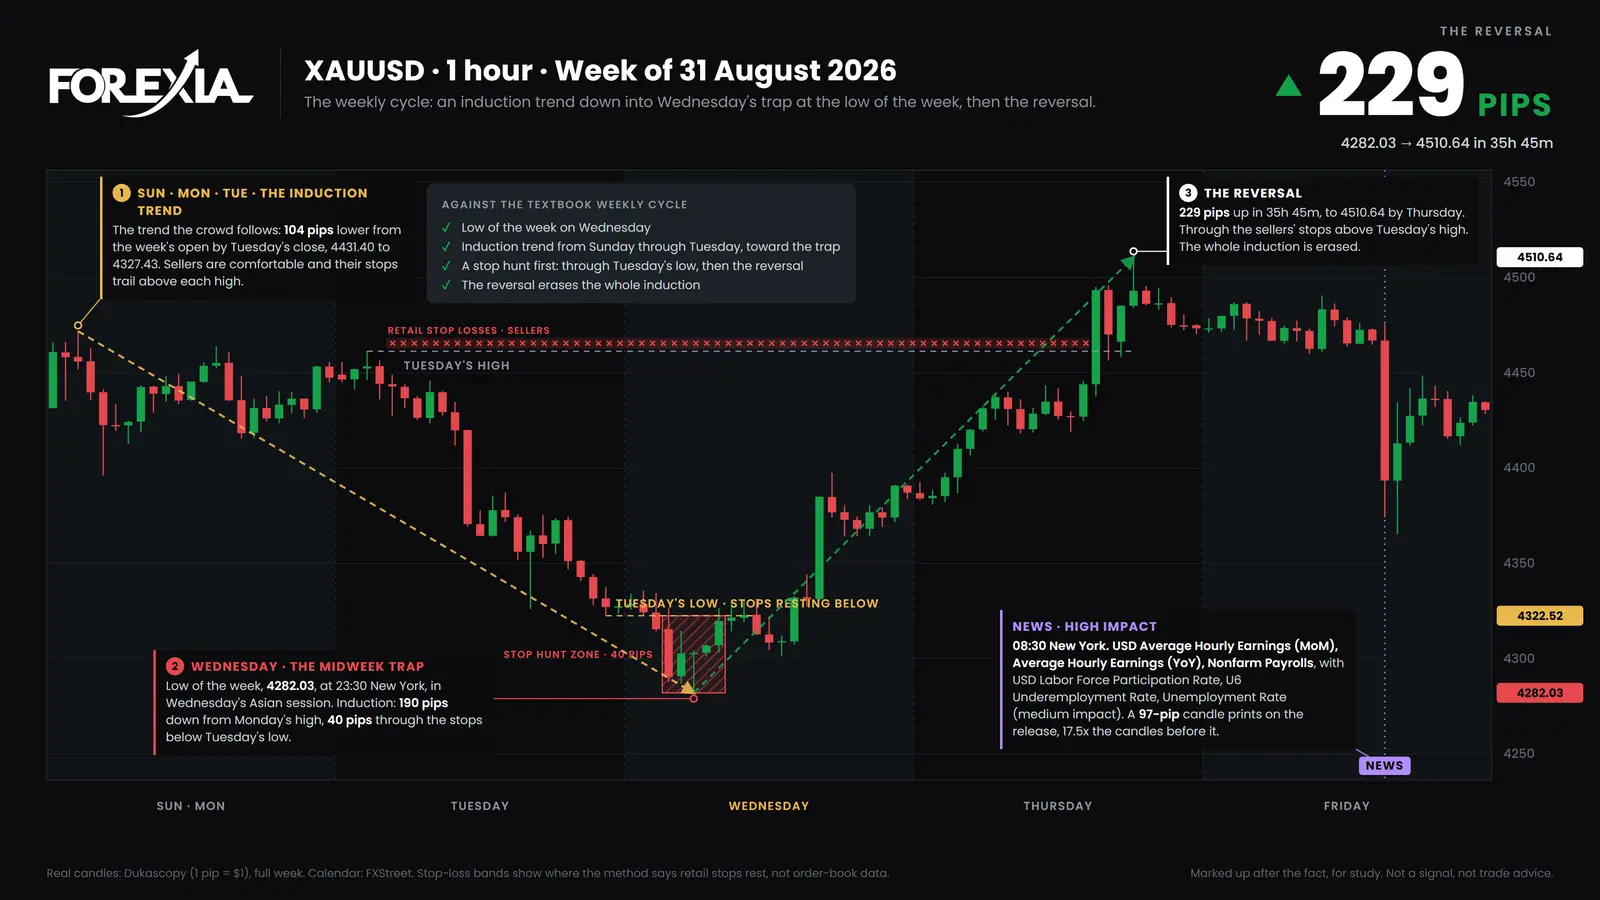
They look like a staircase of daily levels, with the far pool on the side the crowd has its back to. Gold in the week of 31 August 2026 fell from its first evening. It opened at 4431.40, Monday's high came at 4471.77 on Sunday evening, and by Tuesday's close gold was at 4327.43, 104 pips under the open. We count $1 as 1 pip.
In a falling week the crowd sells, and its stops sit above each day's high. Tuesday's high was 4461.27 and Monday's 4471.77, so we read the far pool as above that. At 23:30 New York on Tuesday, in the first hours of Wednesday's session, gold made the low of the week at 4282.03, 40 pips under Tuesday's low. The 08:45 candle on Thursday closed at 4493.40, over Monday's high. By 11:15 gold was at 4510.64, 229 pips off the low and 39 over Monday's high.
A rising week is the same map the other way up. AUD/USD in the week of 7 September opened at 0.71935, with Monday's low at 0.71920. Tuesday's low was higher, at 0.72043, and Tuesday's close 22 pips over the open. Buyers' stops trail under each day's low, so we read the far pool as under Monday's. At 03:15 on Wednesday price reached 0.72374, 7 pips through Tuesday's high, and that stood as the high of the week. The 07:45 candle on Thursday closed at 0.71907, under Monday's low, and no later candle that week closed back over it. By 08:30 on Friday price was at 0.71496, 88 pips off the high.
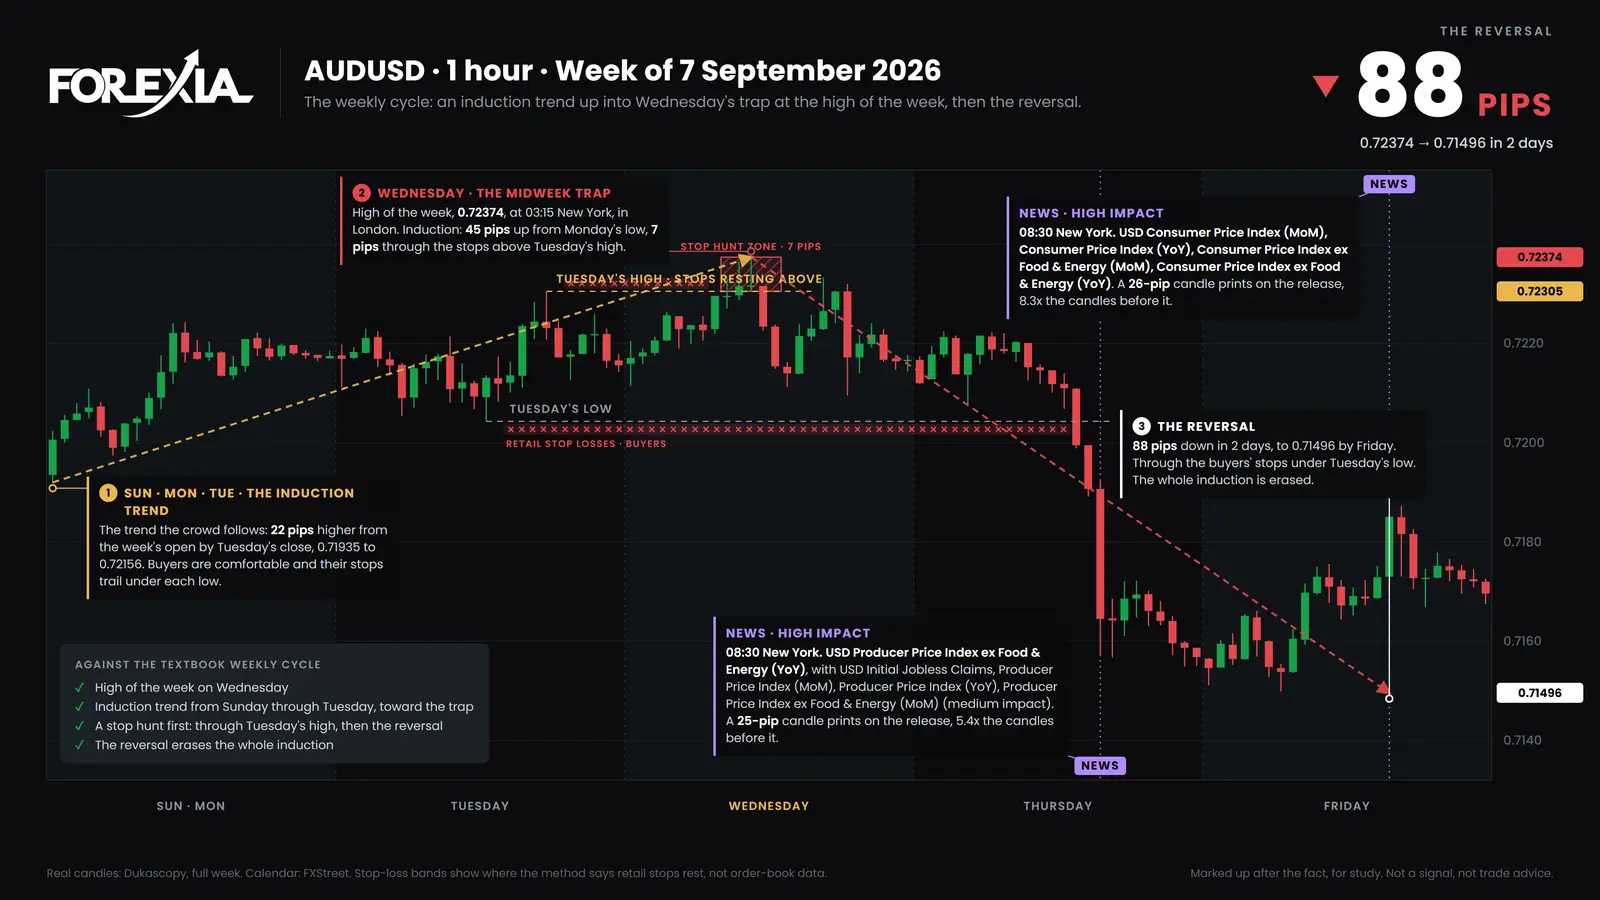
Monday's low there was printed at Sunday 17:15, in the week's first minutes, when spreads are wide. On OANDA it sits about 4 pips higher. Check any level made at the open on a second chart.
The Week's High and Low and weekly high and low liquidity: what is the difference?
The phrase people search usually means last week's finished high and low, and our word means this week's as it builds. Most weekly liquidity pages treat last week's levels as a stop cluster and leave it there. Those levels matter, and we mark them too, but they are fixed. This week's move, and which side grows depends on which way the crowd is leaning.
Weekly high and low liquidity goes deeper into that pool, and the wider liquidity sweep guide shows how the pools fit together.
How did the Week's High and Low move on these two weeks?
One side kept moving, and the other stopped early. On gold, the week's high was set in its first hours, at 4471.77, and stood until Thursday. The week's low went from 4396.15 on Monday to 4322.52 on Tuesday and 4282.03 in Wednesday's first hours. On AUD/USD it was the other way round. The low stayed at 0.71920 from the first minutes until Thursday, while the high went from 0.72243 on Monday to 0.72305 on Tuesday and 0.72374 on Wednesday. In both weeks the side that stopped early was the far one, which is Liquidity Mapping on a bigger scale.
The trend the crowd follows has its own word, the Induction Trend, and its last push is the Midweek Trap.
These two weeks are chosen examples, not a sample. We only draw a weekly chart when the week turned, and a week that trends into Friday leaves its far pool untouched.
What do traders get wrong about the Week's High and Low?
Three readings cost the most.
- Reading only last week's lines. They are fixed, and this week's are not: gold's low of the week came 114 pips under Monday's low.
- Naming the high too early. On that AUD/USD week, Monday's high went on Tuesday and Tuesday's on Wednesday. The week's high is only known once the week has turned.
- Reading the far pool as a forecast. It says where the stops build, not when price goes there. A reversal seen afterwards is not a setup, and our own test of the daily setup as a mechanical rule did not make money.
Which words do the Week's High and Low lead into?
Four sit next to them.
- The WTF Reversal: the reversal through the herd's stops later in the week, after the Induction Trend and the trap.
- Mid-Week Reversal: the turn itself, after the trap.
- Fade the Crowd: the COT reading that when large speculators are crowded, you do not trade with them.
- Liquidity Mapping: marking the pools of stops on the chart before the session.
Where are the Week's High and Low taught?
Course 1 of ForexiaPRO, Reading the Map, teaches this read step by step in lesson 1.2.4, The Week's High and Low. Which day the week turns, and how to tell, is for Course 4 of ForexiaPRO, The Week, in production.
Related words
Frequently asked questions
What are the Week's High and Low?
They are the highest and lowest prices of the week so far, and we read them as the biggest pool of stops on the chart. They are also the pool the WTF Reversal runs for. The size of that pool is our reading: no public book shows forex stops.
Where do the stops sit in a rising week?
Under each day's low, because the traders following the week's rise are buyers. So the far pool is under the week's low. In a falling week it is the other way up: the sellers' stops sit above each day's high, and the far pool is above the week's high.
Is the week's high the same as the previous week's high?
No. Last week's high and low are fixed. This week's keep moving as the days go by. Most writing on weekly liquidity means last week's. We read both.
When do you know the high or low of the week?
Only when the week is over, or when it has clearly turned. Until then each is only the furthest price so far. On AUD/USD in the week of 7 September 2026, Monday's high was passed on Tuesday and Tuesday's on Wednesday.