Weekly High and Low Liquidity: Why the Week's Extremes Hold the Most Stops
Dylan Forexia9 min read
Weekly high and low liquidity is the stops and breakout orders resting past the week's extremes. We read it as the biggest pool on the chart, because it builds for days. Two sets of lines go by that name: last week's finished high and low, and this week's as it forms. Here is what a count of 177 lines and three real weeks in 2026 show.
The Week's High and Low defines our word. This page goes deeper into the pool: what the week does to last week's lines, and what happens when the far pool is never reached.
What is weekly high and low liquidity?
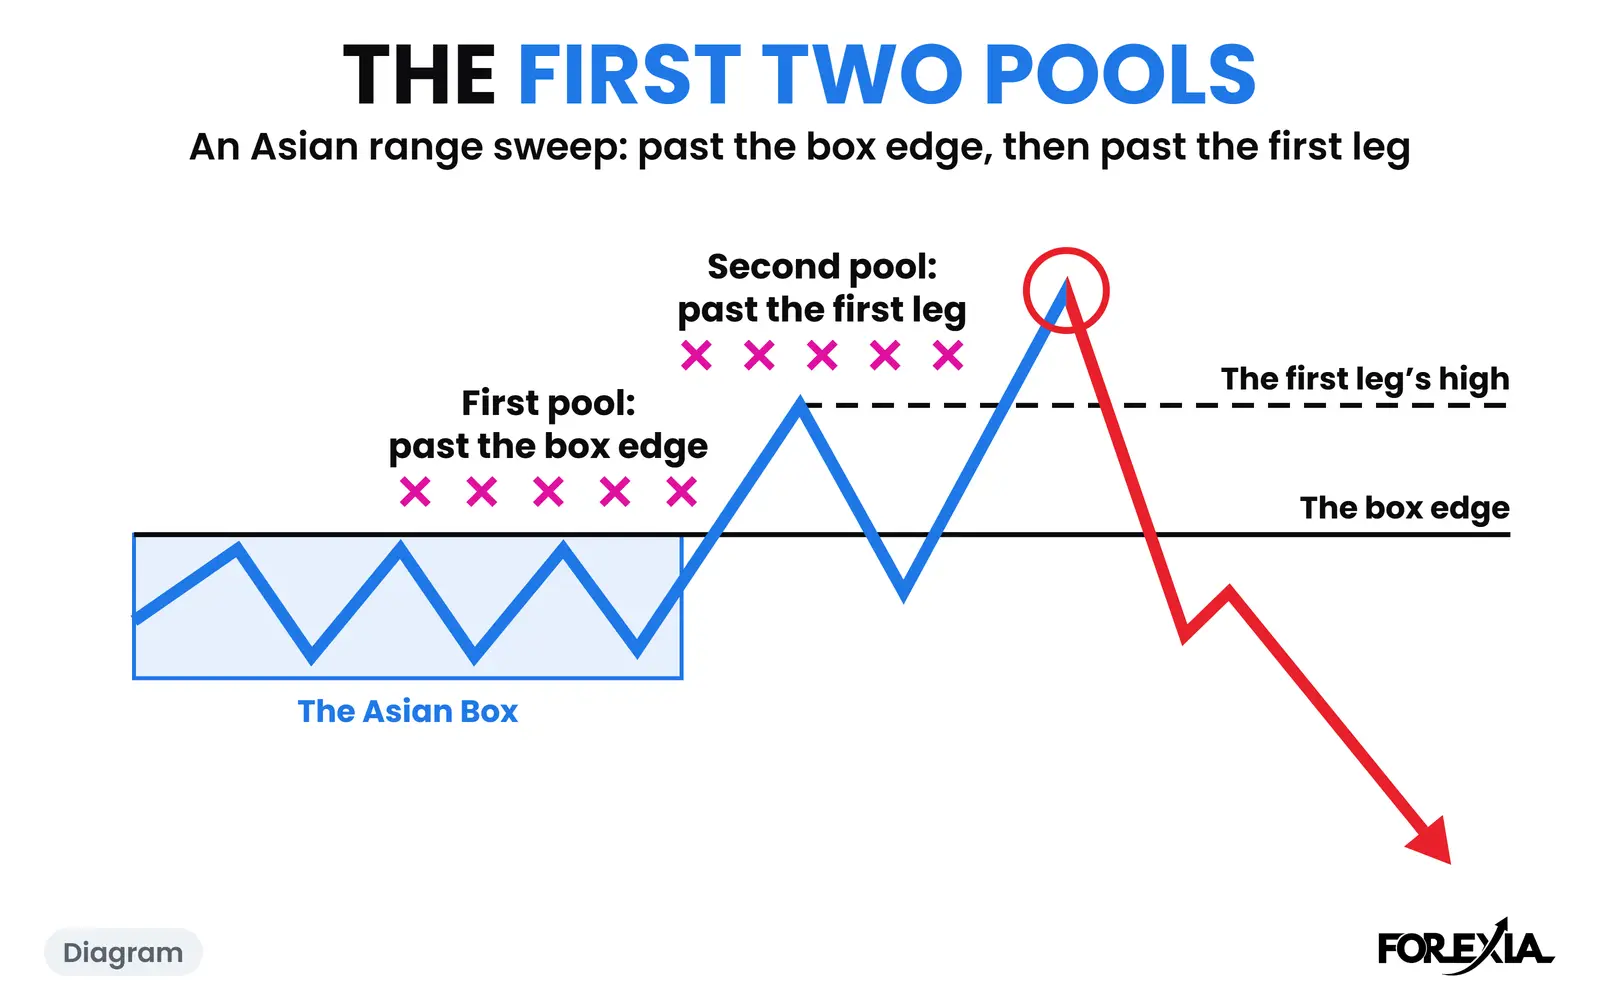
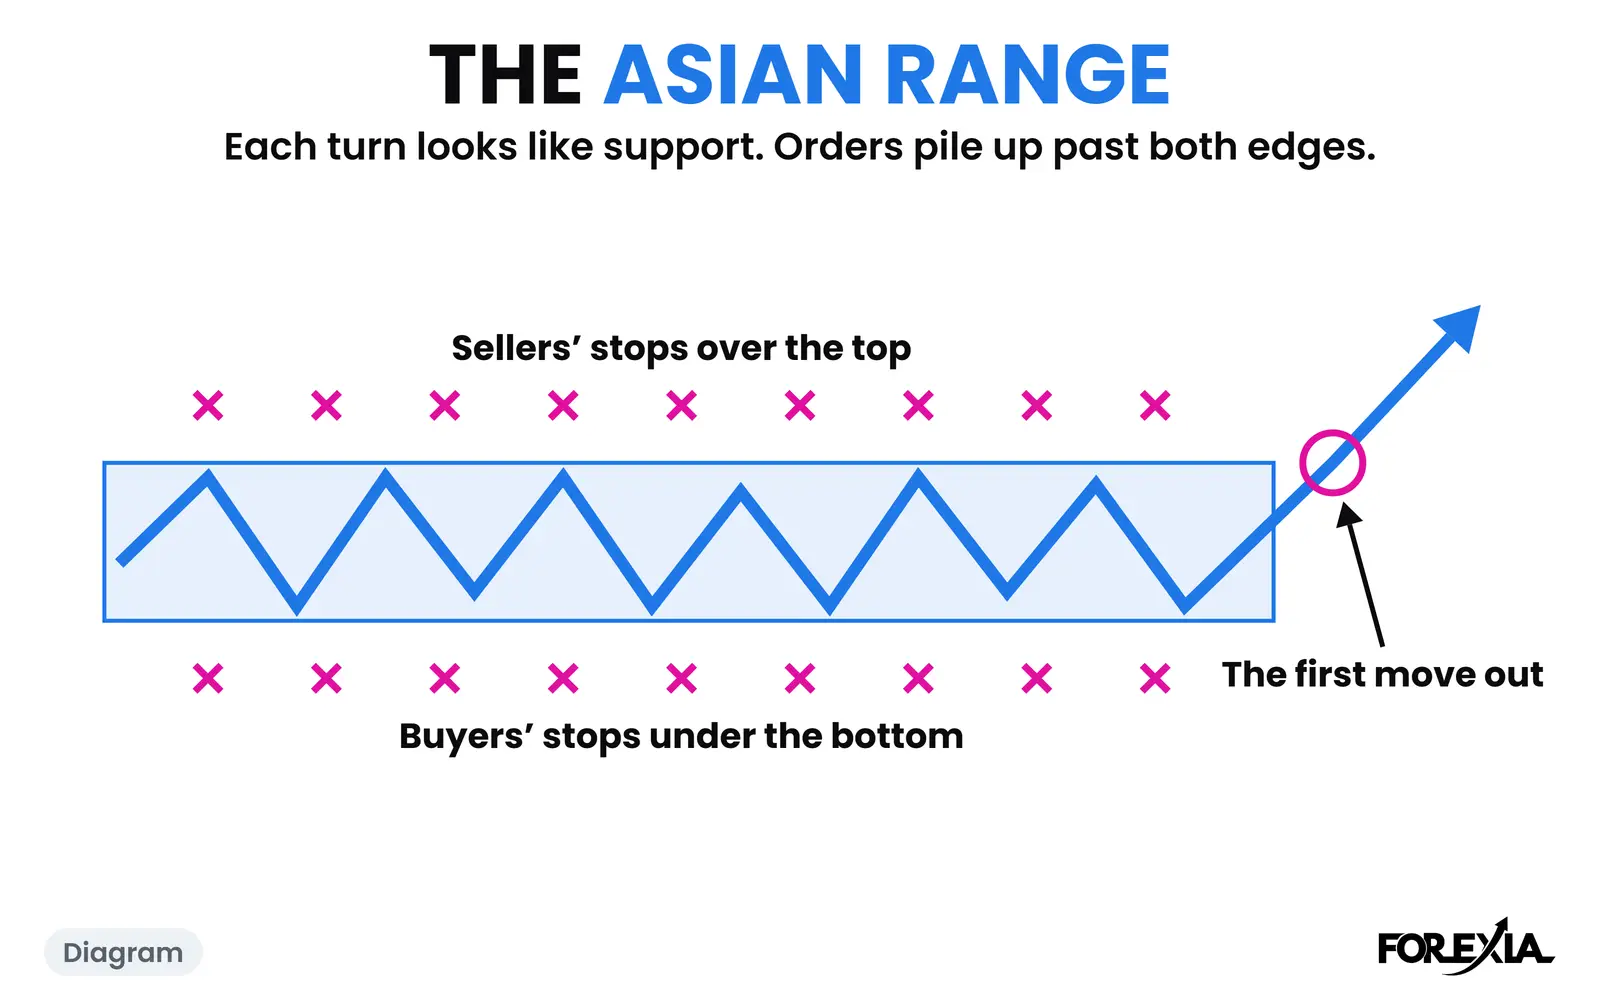
It is the same map as the day's, on a slower clock. Past last week's high and past this week's high sit buy orders: sellers' stops and the entries of anyone waiting for the break. Past the lows sit sell orders. Marking those places is Liquidity Mapping, and a move through them to take the orders is a liquidity sweep.
Why do the week's extremes hold the most stops?
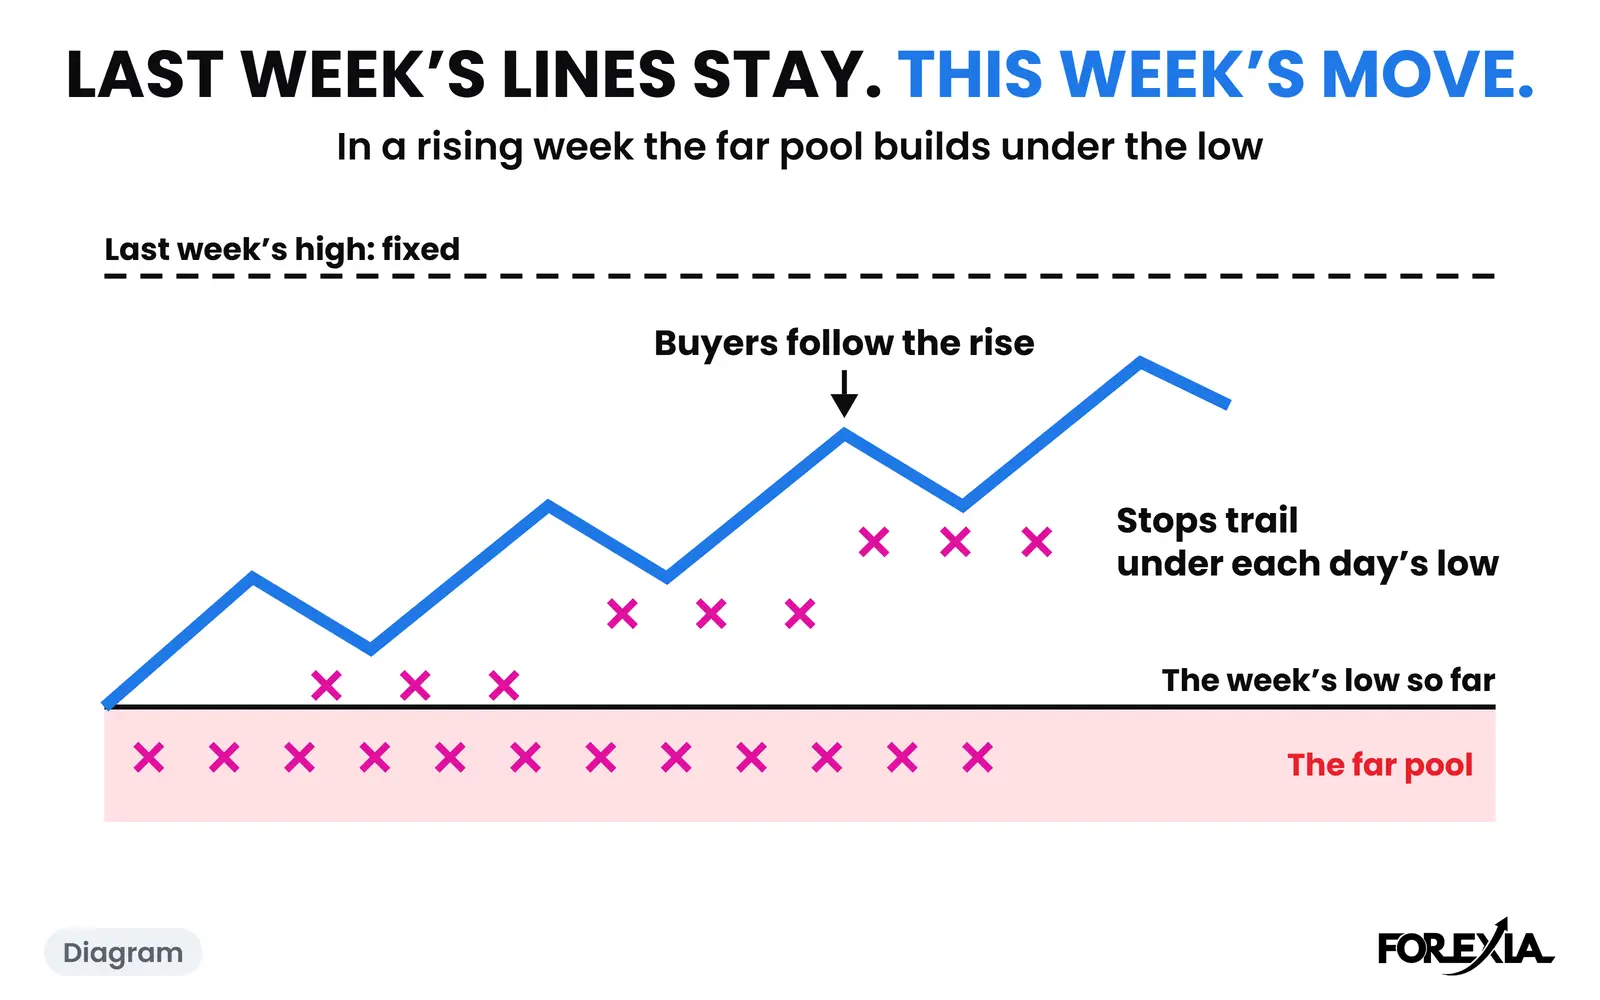
Because more trades sit behind them, on our reading. A day's low holds the stops of that day's trades. In a rising week the traders following the move buy, and their stops trail under each day's low as they go. So the week's low sits behind every buyer since the week opened, and it has been on every chart for days. The longer the trend runs, the more it holds, and in a falling week it is the same thing above the week's high.
That far side of the week we call the far pool, and it is the pool the WTF Reversal runs for. "Biggest" is a reading. Spot forex trades over the counter, so no public book shows a single one of these stops, and nobody can measure the pool.
Last week's lines or this week's?
They are different things, and most weekly liquidity tools draw only the first.
| Last week's high and low | This week's high and low | |
|---|---|---|
| Does it move? | No, it is fixed on Friday | Yes, whenever a new extreme prints |
| Whose stops | Last week's traders, and anyone who marks it | This week's crowd, following the move |
| When you know it | Before the week opens | Only once the week has turned or ended |
| What a chart tool does | Draws it for you | Usually nothing |
What does a week do to last week's high and low?
It usually trades through one, and it ends past it more often than not. We counted 24 whole weeks, 13 April to 25 September 2026, on seven majors and gold: 192 market-weeks on 15-minute candles. A week runs from the Sunday 17:00 New York session break to the Friday 17:00 close, and last week's lines are its wicks, leaving out the lower wick of the first candle after each session break. A line counts as taken when price trades past it by at least 3% of the average daily range, and we left out the 9 lines a week's first candle opened past. A close exactly on the line counts as a close back. The count says nothing about which day anything happened.
| What happened | Count |
|---|---|
| Market-weeks that took neither of last week's lines | 35 |
| Took one | 137 |
| Took both | 20 |
| Lines taken | 177 |
| A candle closed back on the near side by the end of the week | 157 |
| No candle closed back | 20 |
| Of those 157, a later candle went past the wick that week | 131 |
| The week's last candle closed past the line | 100 |
Two things follow.
- A 15-minute close back means little on a weekly line. It happened on 157 of 177 (89%), and after 131 of those (83%) price went further past the line anyway. A week has hundreds of candles, so one closing back proves almost nothing.
- A weekly line is not a wall, and not a magnet. The week ended past the line on 100 of the 177 (56%). Where no candle ever closed back, the median run was about one and a half average days past the line.
These are counts of candles, not trades, and they stop at one question: what the week did to last week's lines. They are not evidence that anyone hunted them.
A rising week: AUD/USD, week of 7 September 2026
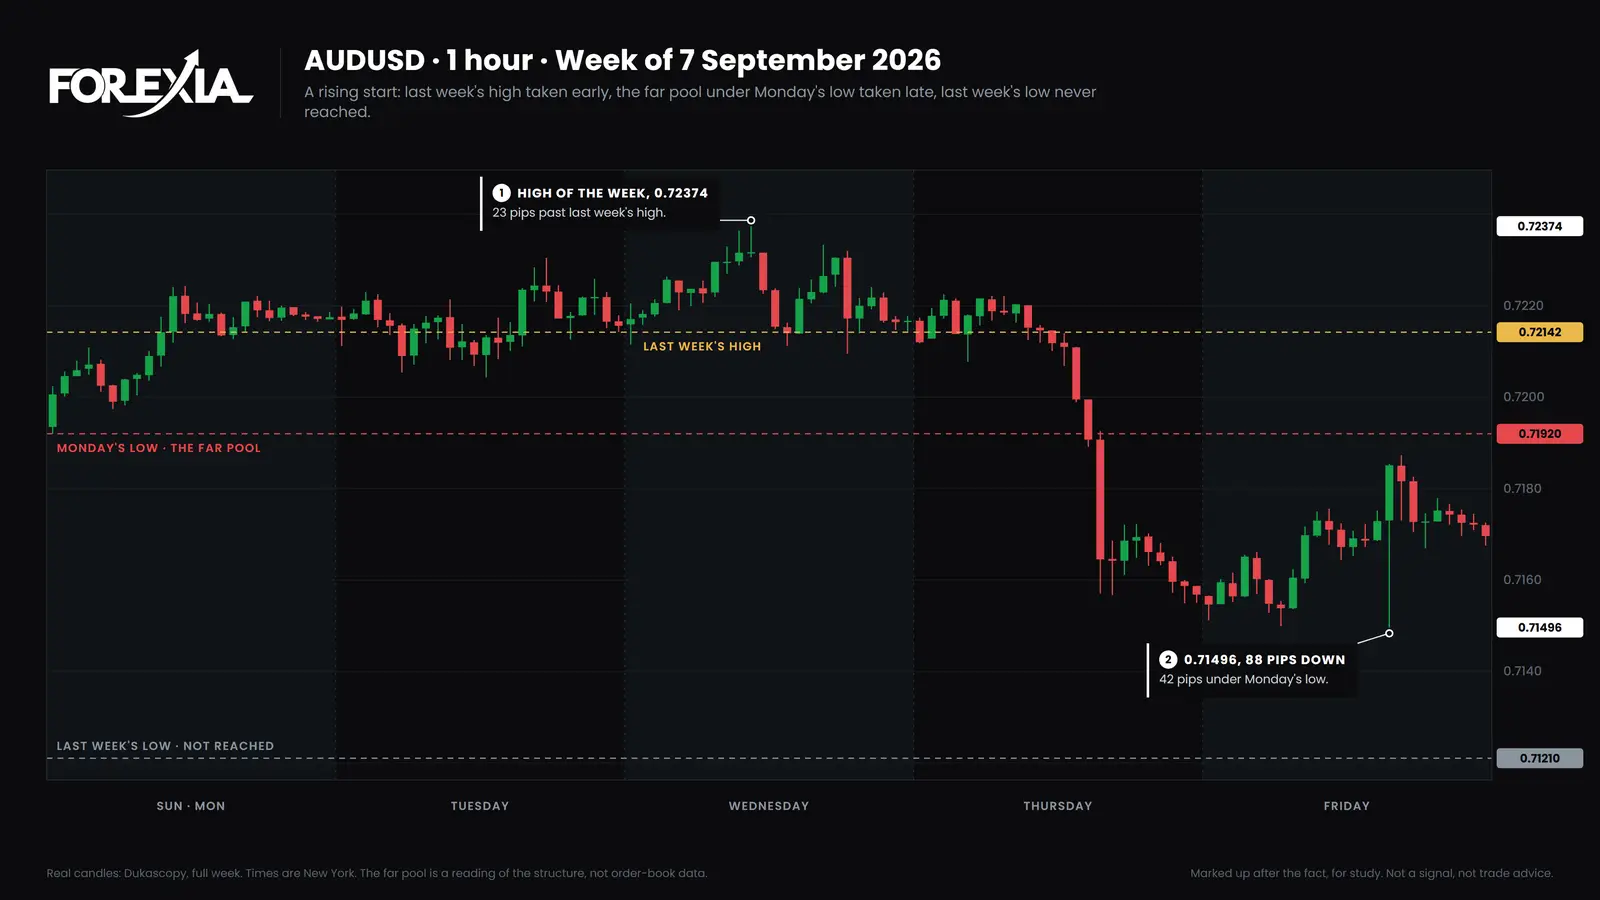
The week opened at 0.71935, 21 pips under last week's high of 0.72142. The 02:30 New York candle on Monday closed over it at 0.72162, and the next candle closed exactly on it. Our count calls that a close back, and it meant nothing: price went on, 23 pips past the line in the end, to 0.72374 on Wednesday at 03:15.
Meanwhile the far pool was building at the other end. Monday's low was 0.71920, printed in the week's first minutes, and Tuesday's low was higher, at 0.72043. In a rising week the buyers' stops trail under those. The 07:45 candle on Thursday closed under Monday's low at 0.71907, and by 08:30 on Friday price was at 0.71496, 88 pips off the high. Two US inflation releases lined up with the last of it, producer prices on Thursday and consumer prices on Friday.
Last week's low, 0.71210, was another 29 pips away and was never reached. The week took one line it had inherited and one pool it had built.
A falling week: gold, week of 31 August 2026
Gold shows why last week's line can be no use at all. Counting $1 as 1 pip, the week opened at 4431.40, already 14 pips under last week's low of 4445.20, so that line was behind price from the first candle. It is one of the 9 we left out. Last week's high, 4696.64, was 265 pips away.
This week's map did the work. Monday's high came at 4471.77 on Sunday evening, and gold fell to 4282.03 by 23:30 New York on Tuesday. In a falling week the sellers' stops sit above each day's high, so we read the far pool as above 4471.77. The 08:45 candle on Thursday closed over it at 4493.40, and by 11:15 gold was at 4510.64, 229 pips off the low and still 186 short of last week's high.
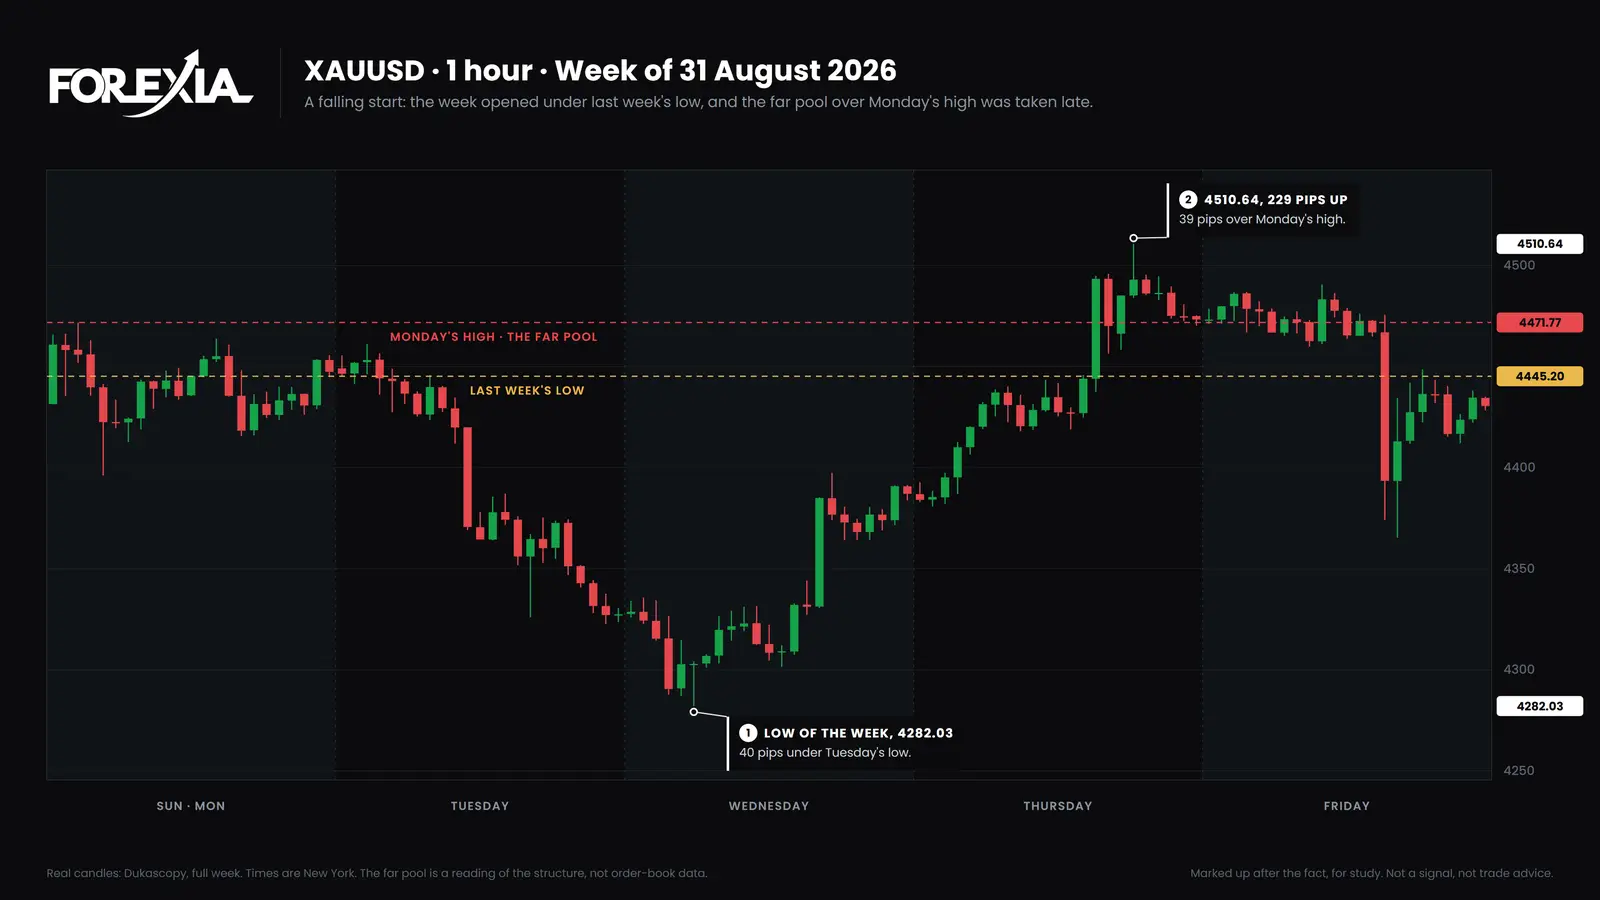
Then look at the end. The jobs report on Friday brought a 97-pip candle, and the week closed at 4430.45, a pip under where it opened. Taking the far pool did not make it a rising week.
A week that never turned: NZD/USD, week of 14 September 2026
This is the week a weekly chart usually leaves out. We only mark up a week that turned, so a page like this one can flatter the idea unless it shows one that did not.
The week opened at 0.58022, and the high of the week, 0.58185, came at 19:00 New York on Sunday. Last week's low, 0.57924, went within hours. The Sunday 22:00 candle closed a shade under it, and the 22:15 candle reached 0.57892 and closed back over at 0.57928. Had you read that as a sweep and a turn, the week would have shown you otherwise: it ended 72 pips under that line.
Sellers followed the fall, and their stops sat above each day's high. Tuesday's high was already 37 pips under Monday's. So the far pool was above 0.58185, and it stayed there. After the Fed's decision on Wednesday price reached 0.57030, and the week closed at 0.57207, 98 pips under the far pool. Nothing went back for those stops.
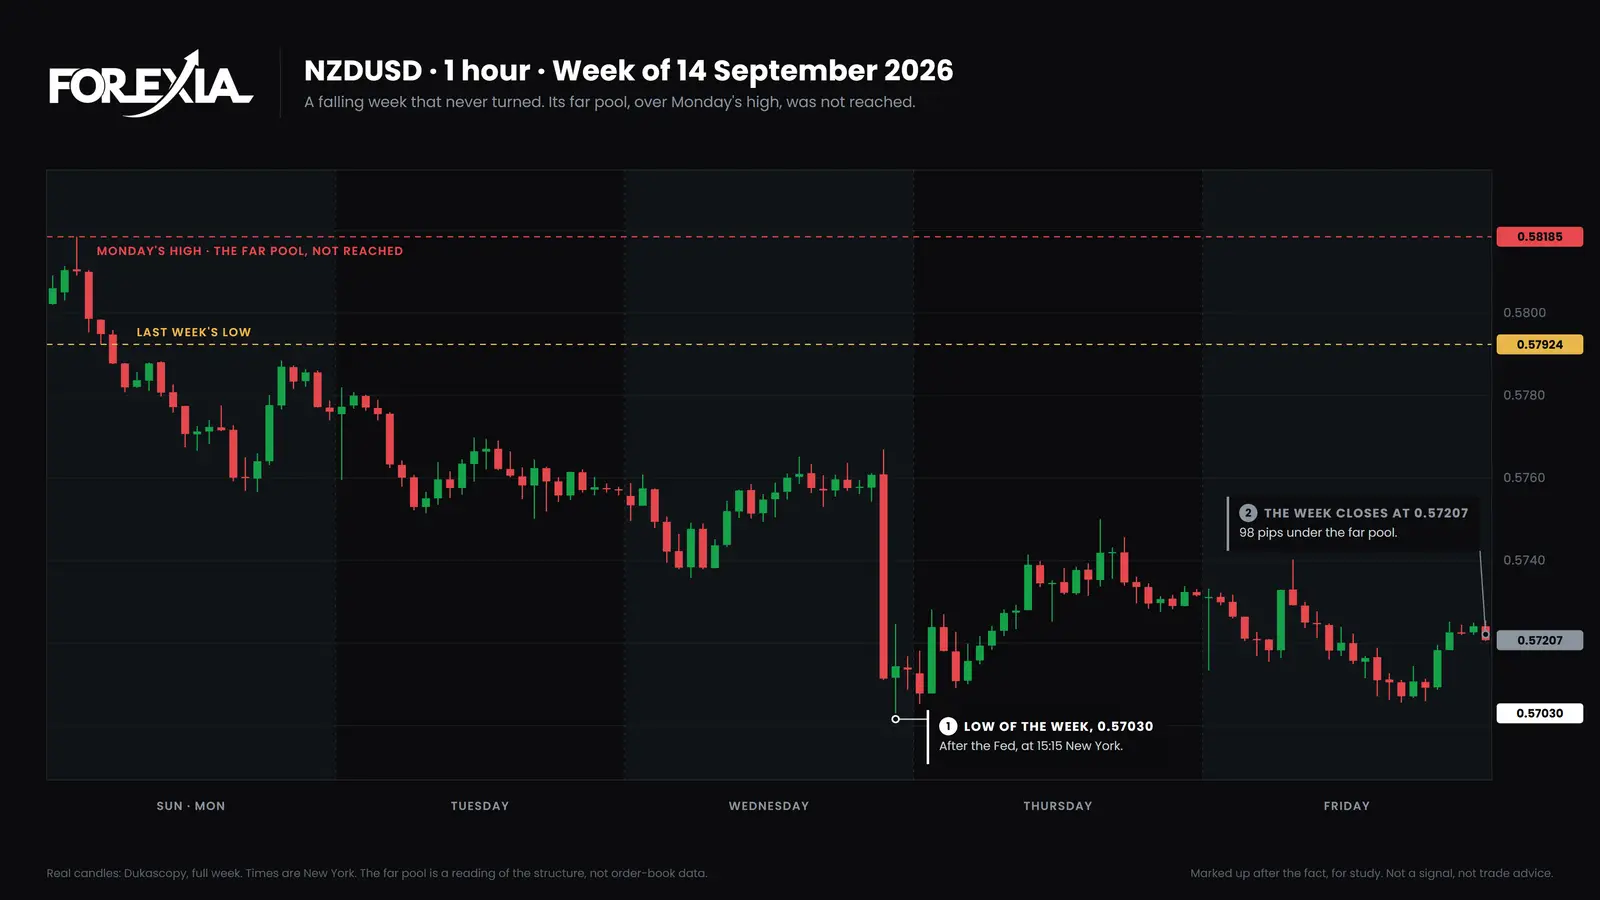
USD/CAD went the other way that same week: last week's high broke on Monday, and no candle closed back all week.
Is this a weekly forex forecast?
No. It is a map of where stops may be, and it has no date on it. A weekly forecast says where price is going, and the far pool cannot say that: NZD/USD left it alone, and gold took it and gave it all back. When a week turns, and how to tell, is not on this page. The weekly cycle has its own page, and Course 4 of ForexiaPRO, The Week, in production, teaches it.
A reversal seen afterwards is not a setup, and our own test of the daily setup as a mechanical rule did not make money. We have no such test of weekly lines.
What did each seat see in these weeks?
The three seats read the week of 7 September on AUD/USD three ways.
- Retail saw an uptrend. Last week's high broke on Monday, and the textbook buys the break and holds, with stops under each new low.
- The market maker, as we read it, saw sell orders building. Every buyer who joined left a stop underneath, and Monday's low had the most behind it.
- The observer saw two maps. One stopped changing on Friday, the other kept changing. The observer can say which line went when, and cannot say who took it.
Common mistakes
All three come from reading a weekly line like a daily one.
- Calling a sweep on one 15-minute candle. On NZD/USD a close back came on the same candle that took the line, and the week then fell 72 pips past it.
- Expecting last week's lines to matter every week. Gold's week opened past one and never got near the other. Everything that mattered happened on lines the week drew itself.
- Studying only weeks that turned. They are the ones with a shape to draw. In our count, 20 lines never saw a close back at all.
Course 1 of ForexiaPRO, Reading the Map, teaches this read step by step in lesson 1.2.4. For the same read a day at a time, see the previous day's high and low.
Frequently asked questions
Does price usually go back after taking last week's high or low?
Less than the word sweep suggests. On eight markets over 24 weeks in 2026, 177 of last week's lines were taken, and a 15-minute candle closed back on 157 of them by the end of the week. But the week still ended past the line on 100 of the 177, so a close back on a weekly line says very little. These are counts of candles, not trades.
Is weekly liquidity the same as last week's high and low?
Most writing means that. We read two things: last week's high and low, which are fixed, and this week's, which keep moving as the days go by. The stops of this week's crowd build behind the second.
Can a far pool be used as a weekly forecast?
No. It says where stops build up, not whether price goes there or when. On NZD/USD in the week of 14 September 2026 the far pool sat above Monday's high, and price never went back to it. The week closed 98 pips under it.
Why do the week's extremes hold more stops than a day's?
That is our reading, and no public book can confirm it. A day's low holds the stops of that day's trades. The week's low sits behind every trade taken since the week began, with stops trailed up by the people who stayed in, and it has been on every chart for days.