
The Forex Weekly Cycle: Reading the Week Day by Day
The weekly cycle in forex is a way of reading the week as three parts in one order: a trend from Sunday to Tuesday that pulls the crowd in, a trap past an earlier day's extreme, then a reversal through the herd's stops. The order is our read. The day of the turn moves, and some weeks never turn at all.
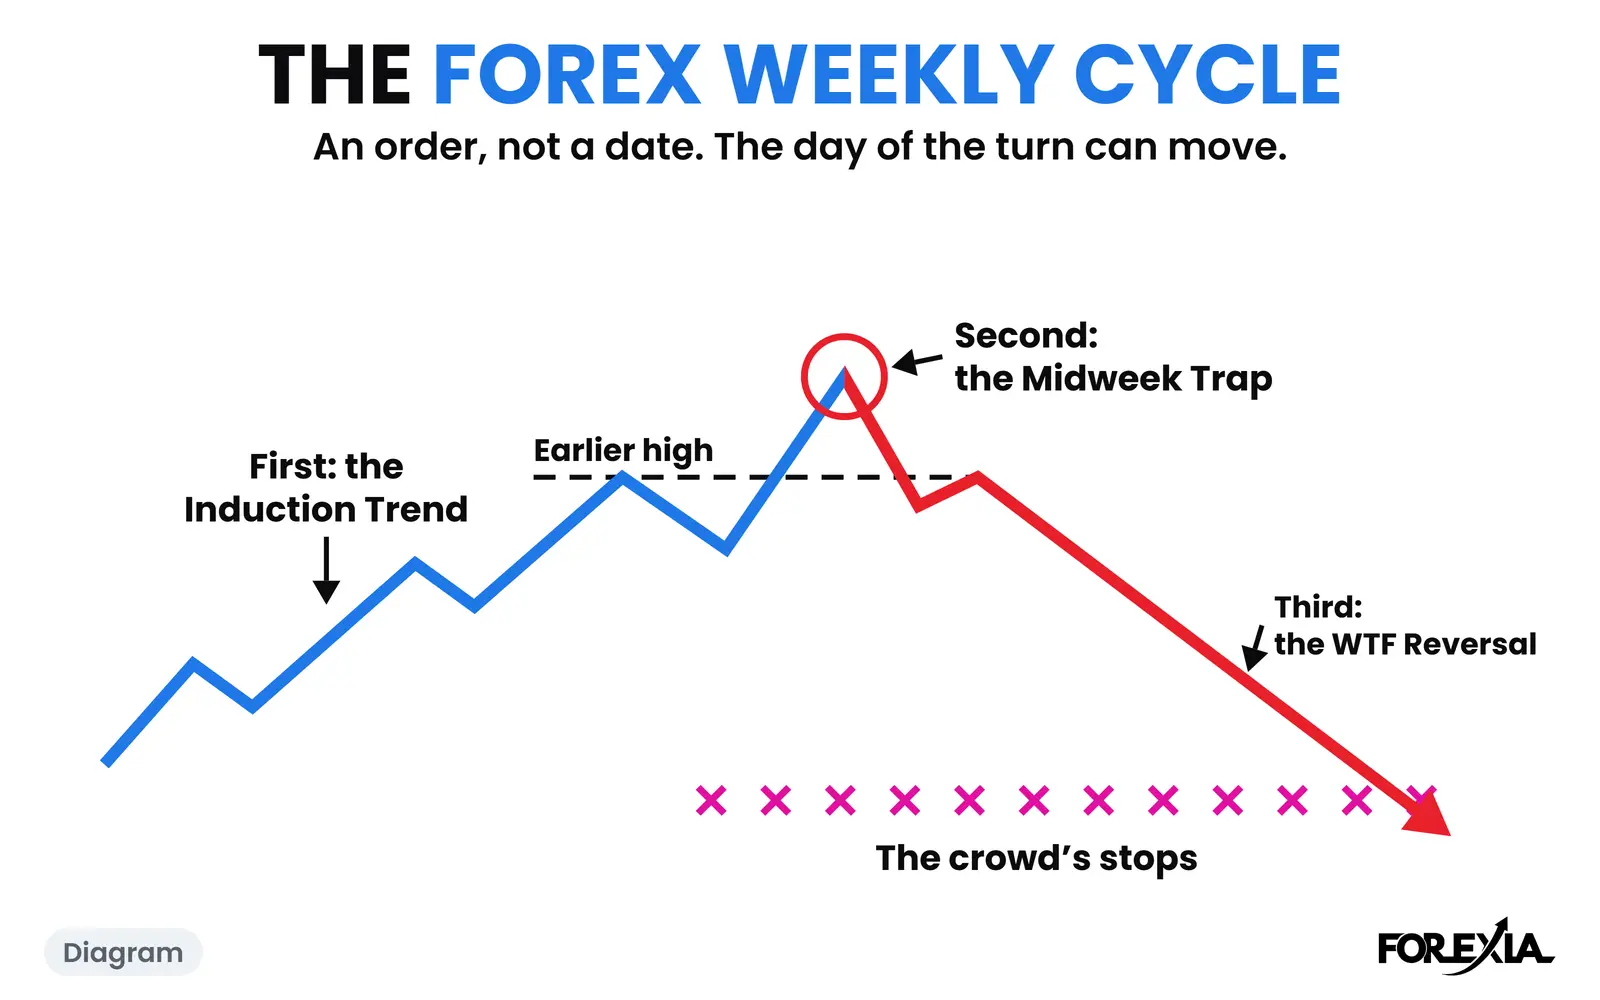
This page reads each part on a real week, then shows a week that turned a day early, one a day late and one that never turned. It also answers the best day of the week to trade forex from our own count, and it says what no chart of a week can tell you.
What is the forex weekly cycle?
The forex weekly cycle is our name for the week read as a sequence, and it is built from three words. The Weekly Script is the reading: the week as a plan the market makers wrote in advance, the induction, the trap, the reversal, always in that order. "Wrote in advance" is our read. Nobody outside can show a plan exists, only the order the candles came in.
The parts have their own names.
- The induction: the Induction Trend, the trend of Sunday, Monday and Tuesday that dumb money follows.
- The trap: the Midweek Trap, a multi-day, multi-session M, and the Mid-Week Reversal, the turn itself.
- The reversal: the WTF Reversal, for Wednesday, Thursday and Friday, through the herd's stops.
The Three Seats split the same week. Retail takes each day as a new trade: the trend, more of the trend, then the breakout. The market maker, on our read, has one plan across the five days: bring the crowd in, take their stops, run the other way. The observer only asks which part the week has reached.
A forex day here runs from the 17:00 New York session break to the next. So Sunday's hours belong to Monday, and Tuesday evening is already Wednesday's session. How to read the forex week takes this further.
Sunday to Tuesday: the induction trend
The first half of the week is where a trend becomes easy to see, and that is what makes it the bait.
AUD/USD opened the week of 27 July 2026 at 0.69975. Monday closed at 0.69885, and Tuesday at 0.69728, 25 pips under the open, with a low of 0.69621. Anyone selling had been right twice by then, and we read their stops as trailing over the days' highs.
It can only be named afterwards. USD/CAD, further down, ran one way to Friday, so it was only ever a trend. And it may not be there at all: GBP/USD in the week of 27 April was only 15 pips from its open by Tuesday's close, a range and not a trend. If you have ever been ahead on Monday and Tuesday and behind by Friday, why you lose money trading a trend is about that seat.
Tuesday: the average daily range
By Tuesday, one number is worth keeping beside the chart: how much of the market's normal day it has used. ADR Met Tuesday is the average daily range used up by Tuesday, one of the confirmations. The test is plain: the session's high minus its low reaches the average of the 20 trading days before it.
It is less common than the name suggests. In our count of seven majors and gold from May to 1 October 2026, Tuesday reached its average on 49 of 176 days (28%), and 8 of those 49 came on one day, US CPI on 14 July. It says the range is used, and we make no claim that it helps or hurts. Average daily range on Tuesday has more.
Tuesday can also carry the turn, as it did on gold below.
Wednesday: the trap and the consolidation
Wednesday is where the method looks for the week to turn, and where it has to wait when the week does not. On AUD/USD the trap was a stop hunt under Tuesday's low, what most traders call a liquidity sweep. Until a candle closed back over that line, the same picture was a plain breakdown.
On AUD/USD the low of the week came at 12:15 New York on Wednesday at 0.69219, 40 pips under Tuesday's low. Tuesday's low had already gone at 21:30 the night before, when Australian CPI landed and that candle fell to 0.69370. The Fed's decision came at 14:00, nearly two hours after the low, and the 14:30 candle closed back over Tuesday's low at 0.69707. Nothing about it was clean: Wednesday still closed back under that line, at 0.69542.
You will read that price consolidates before the turn. Sometimes it does. USD/JPY in the week of 6 July went quiet on both sides of its high, as the Midweek Trap page shows, and AUD/USD spent the three hours before the Fed inside 13 pips. We do not state it as a rule, and two weeks are not a count. Why price consolidates on Wednesday and how to spot a mid-week reversal go further, and our marked-up weeks on EUR/USD, GBP/USD, USD/JPY and USD/CAD are real examples of the midweek reversal.
Wednesday to Friday: the WTF Reversal
The WTF Reversal is the run after the turn, the days most pages skip. It reads as levels going one after another, and that describes a week afterwards. It is not a list to expect.
On AUD/USD it took a day to start. On Thursday the 09:30 candle closed at 0.70043, over Tuesday's high and the week's open. The 09:45 closed over Monday's high at 0.70181. By 12:15 a candle had closed over last week's high of 0.70264. At 05:00 on Friday price reached 0.70442, 122 pips off the low. Then Friday gave some back: 0.69909 at 10:00, and the week closed at 0.70210.
Its run is toward the Week's High and Low, which we read as the biggest pool of stops on the chart. Not every week gets there. EUR/USD in the week of 22 June stopped 5 pips short of Tuesday's high, as the Induction Trend page shows. Late turns have their own page in the Thursday reversal, and the run itself in what is the WTF Reversal.
Which day makes the high or low of the week?
There is no fixed day, and this page gives no count of it. You will see rules of thumb that name a weekday for the week's high or low. Many come with no sample, and even a good count would not tell you about this week. A week's high or low is only known once the week is over, or once it has clearly turned. Until then each is only the furthest price so far.
What we can count is what a week does to last week's lines, because that has no weekday in it. Over 24 whole weeks from 13 April to 25 September 2026, on seven majors and gold, 177 of last week's highs and lows were traded through by at least 3% of the average day. A 15-minute candle closed back on 157 of them by Friday's close. The week still ended past the line on 100. Both lines went in only 20 of the 192 market-weeks, and neither went in 35.
So a weekly high and low is neither a wall nor a magnet. Weekly high and low liquidity has the full count and shows why a close back on a weekly line means little.
A real week, day by day, and three that did not run to plan
These charts were marked up afterwards, for study, on Dukascopy candles in New York time. They are chosen weeks, and one dollar moves several of them. None is a signal.
AUD/USD, week of 27 July 2026: the low came on Wednesday
Here is the week the sections above have been reading, with each day's numbers. Each day runs from the 17:00 break before it.
| Day | High | Low | Close | Its part |
|---|---|---|---|---|
| Sun and Mon | 0.70109 | 0.69850 | 0.69885 | The induction starts |
| Tuesday | 0.69961 | 0.69621 | 0.69728 | More of it, closing 25 pips under the open |
| Wednesday | 0.69884 | 0.69219 | 0.69542 | The trap, around the Fed |
| Thursday | 0.70328 | 0.69458 | 0.70261 | The reversal runs through the week's lines |
| Friday | 0.70442 | 0.69909 | 0.70210 | It goes on, then gives some back |
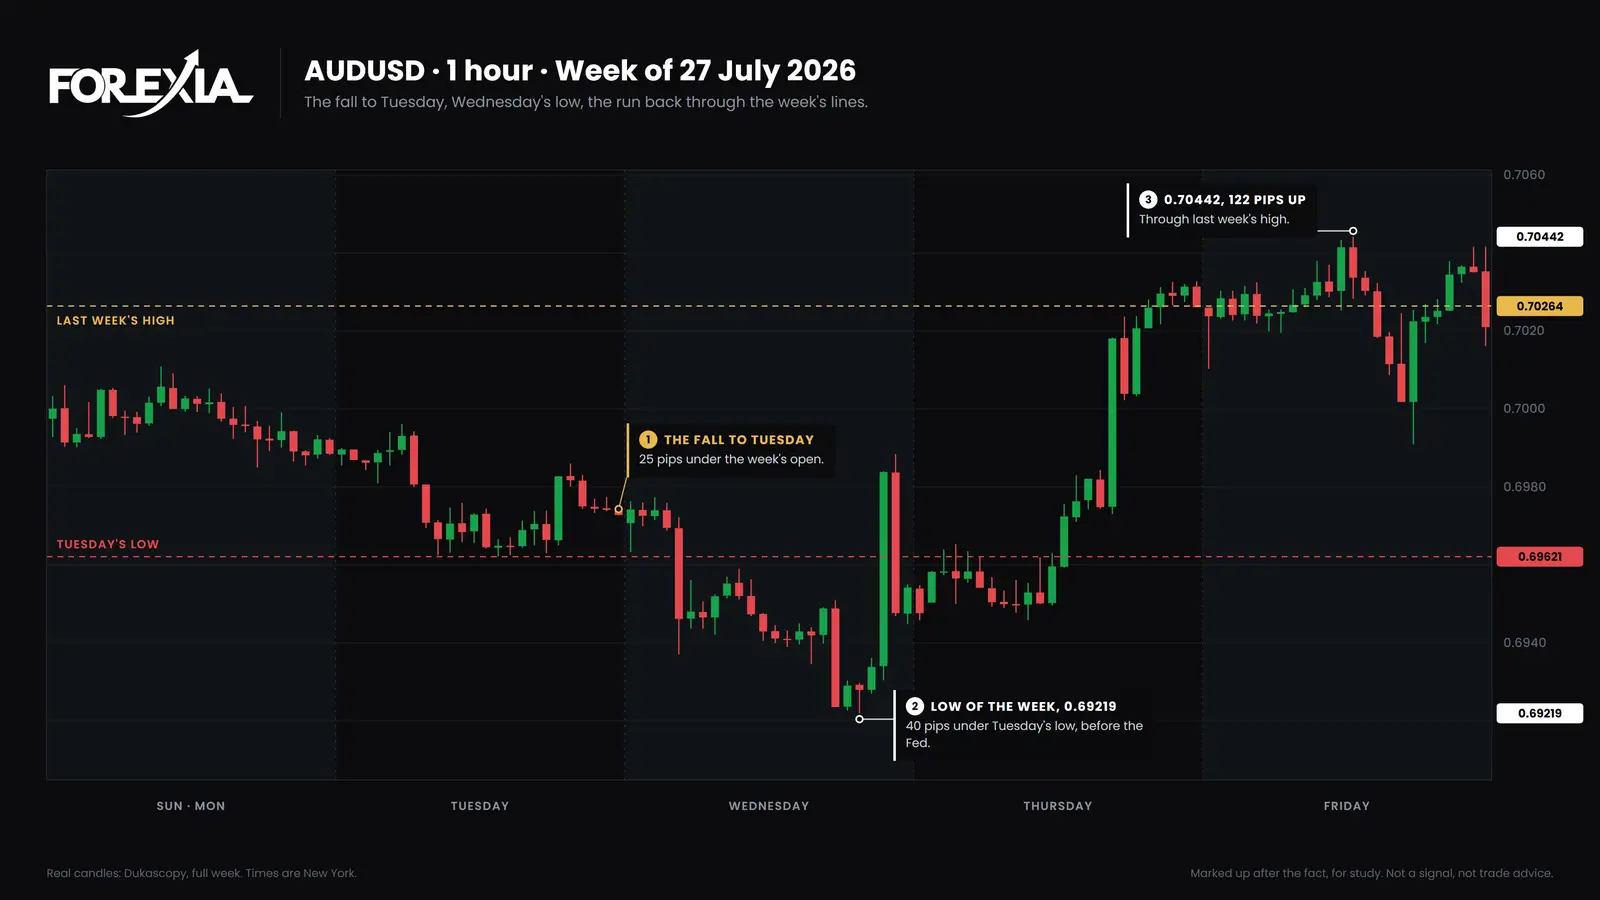
The same week ran differently elsewhere. On the Weekly Script page gold makes its low on Wednesday too, while EUR/USD turned on Tuesday. One dollar moved all three, so that is one week's evidence, not three.
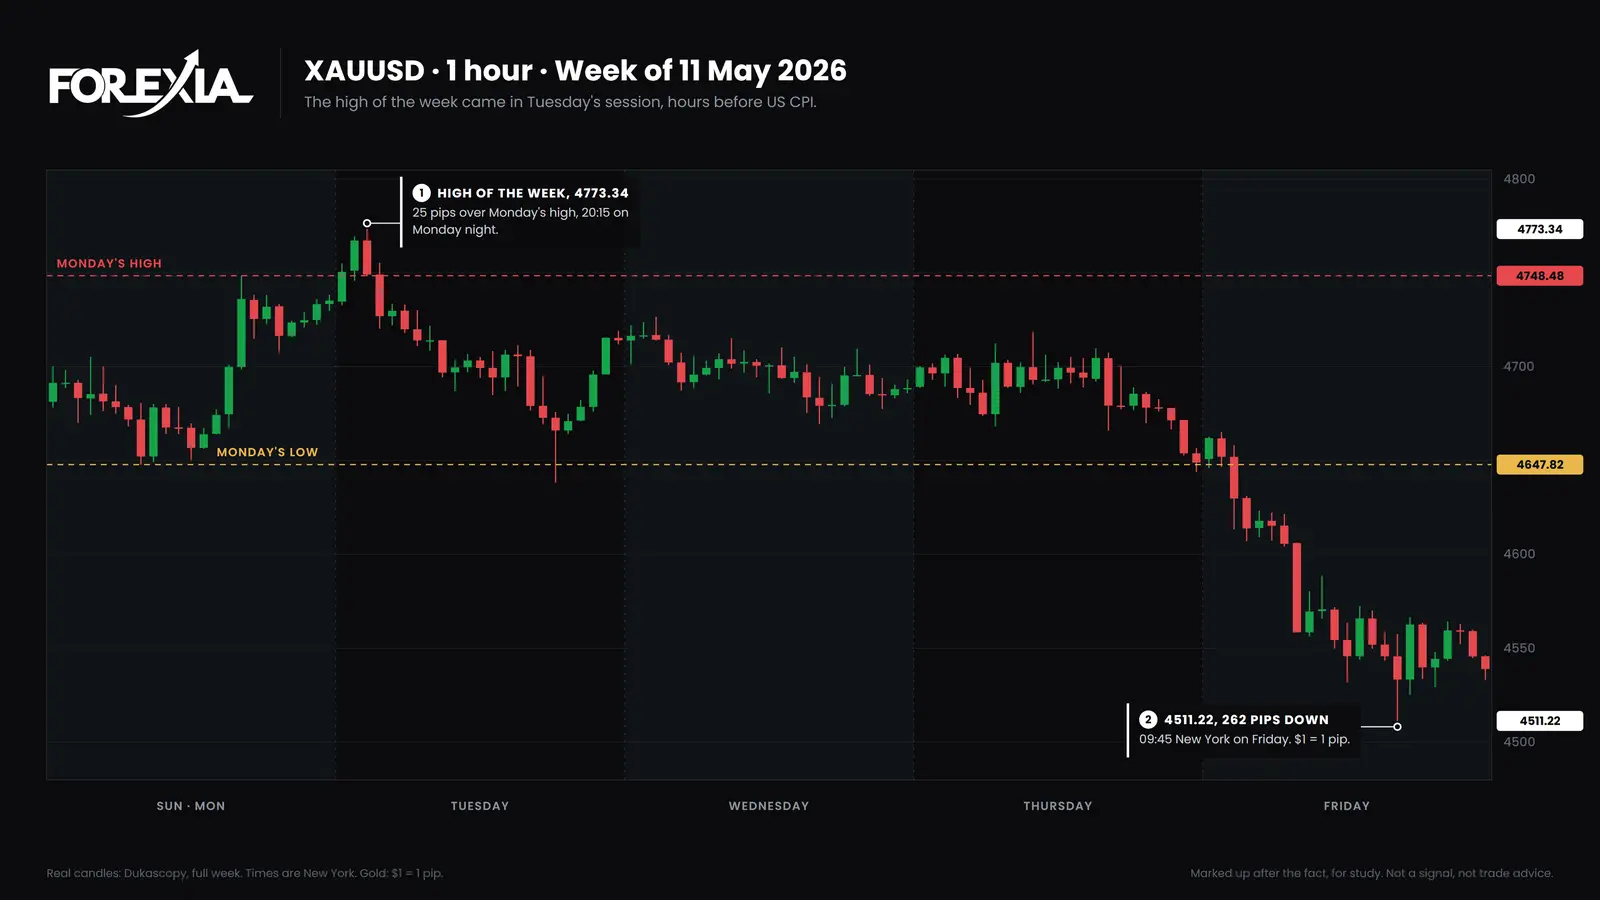
Gold, week of 11 May 2026: the high came in Tuesday's session
Gold opened at 4681.26 and closed Monday at 4735.19, 54 pips higher. We count $1 as 1 pip. Monday's high was 4748.48. At 20:15 that night, already Tuesday's session, gold reached 4773.34, the high of the week, 25 pips over Monday's high. The 21:00 candle closed back under it.
US CPI came at 08:30 on Tuesday, about 12 hours later, and that candle stayed inside 19 pips. Gold fell through the week's open at 09:45 and wicked under Monday's low at 11:15, to 4638.23, then bounced 88 pips by that evening. The first close under Monday's low came late on Thursday, and by 09:45 on Friday gold was at 4511.22, 262 pips off the high.
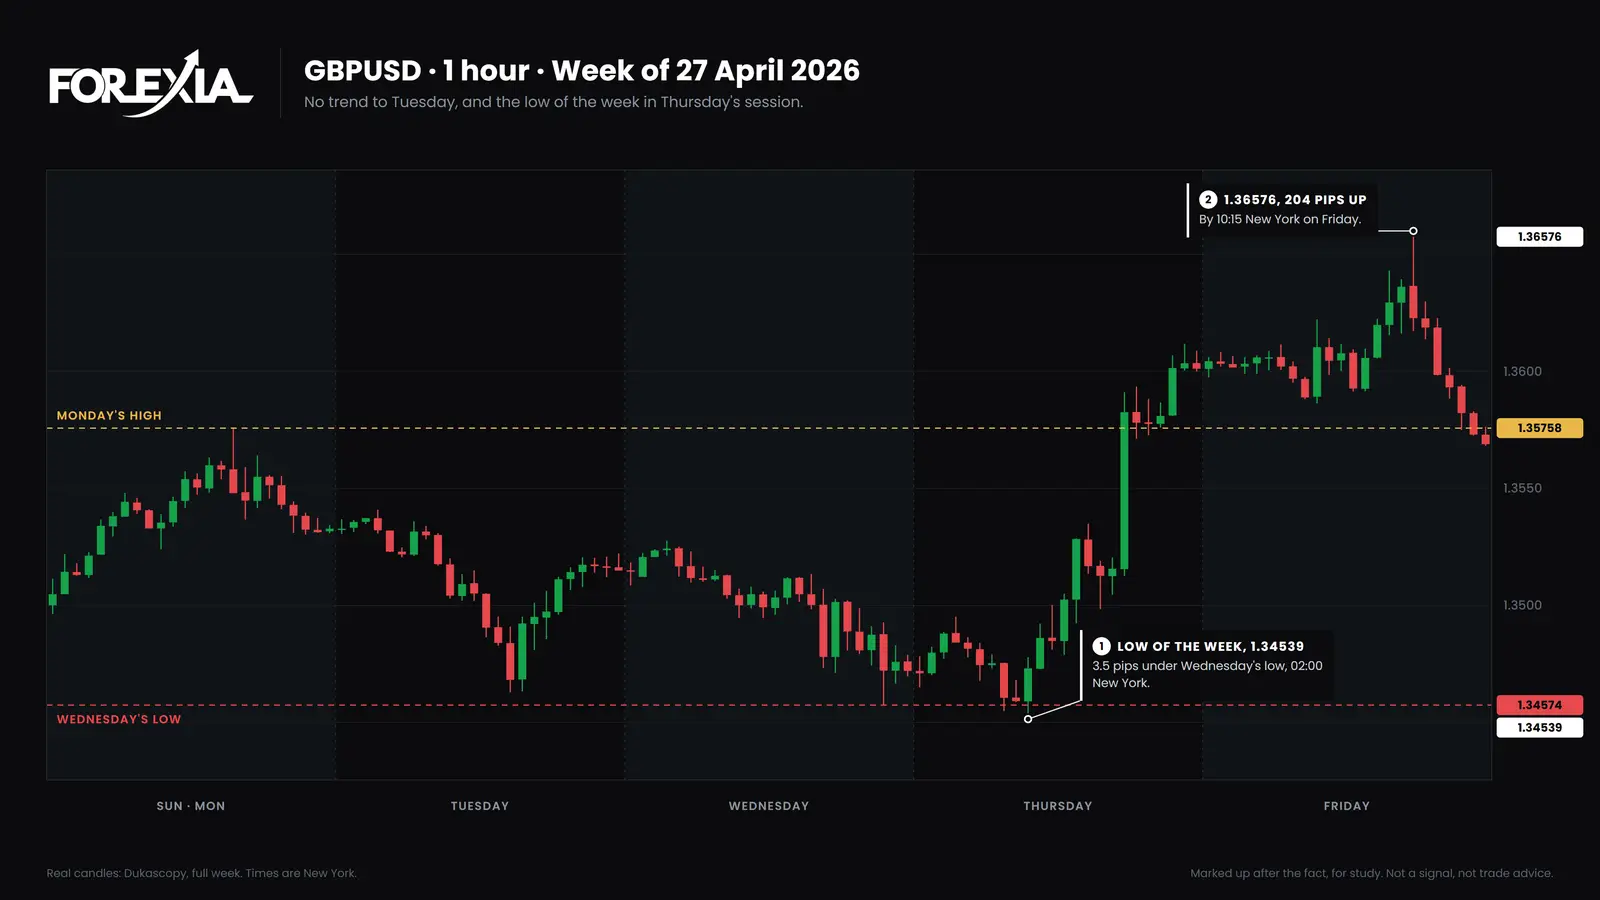
GBP/USD, week of 27 April 2026: the low came on Thursday
There was no induction here. By Tuesday's close the pound was 15 pips from its 1.35001 open, after a range from 1.34628 to 1.35758. Wednesday closed lower and left a low of 1.34574, in the candles after the Fed.
The low of the week came at 02:00 New York on Thursday at 1.34539, 3.5 pips under Wednesday's low, on a candle that closed back over it. A euro retail sales figure landed on that candle. It was hours before the Bank of England, the ECB and US core PCE and GDP, so those releases did not make the low. The pound closed over Wednesday's high at 06:45 and over Monday's at 10:45, and by 10:15 on Friday it was at 1.36576, 204 pips off the low.
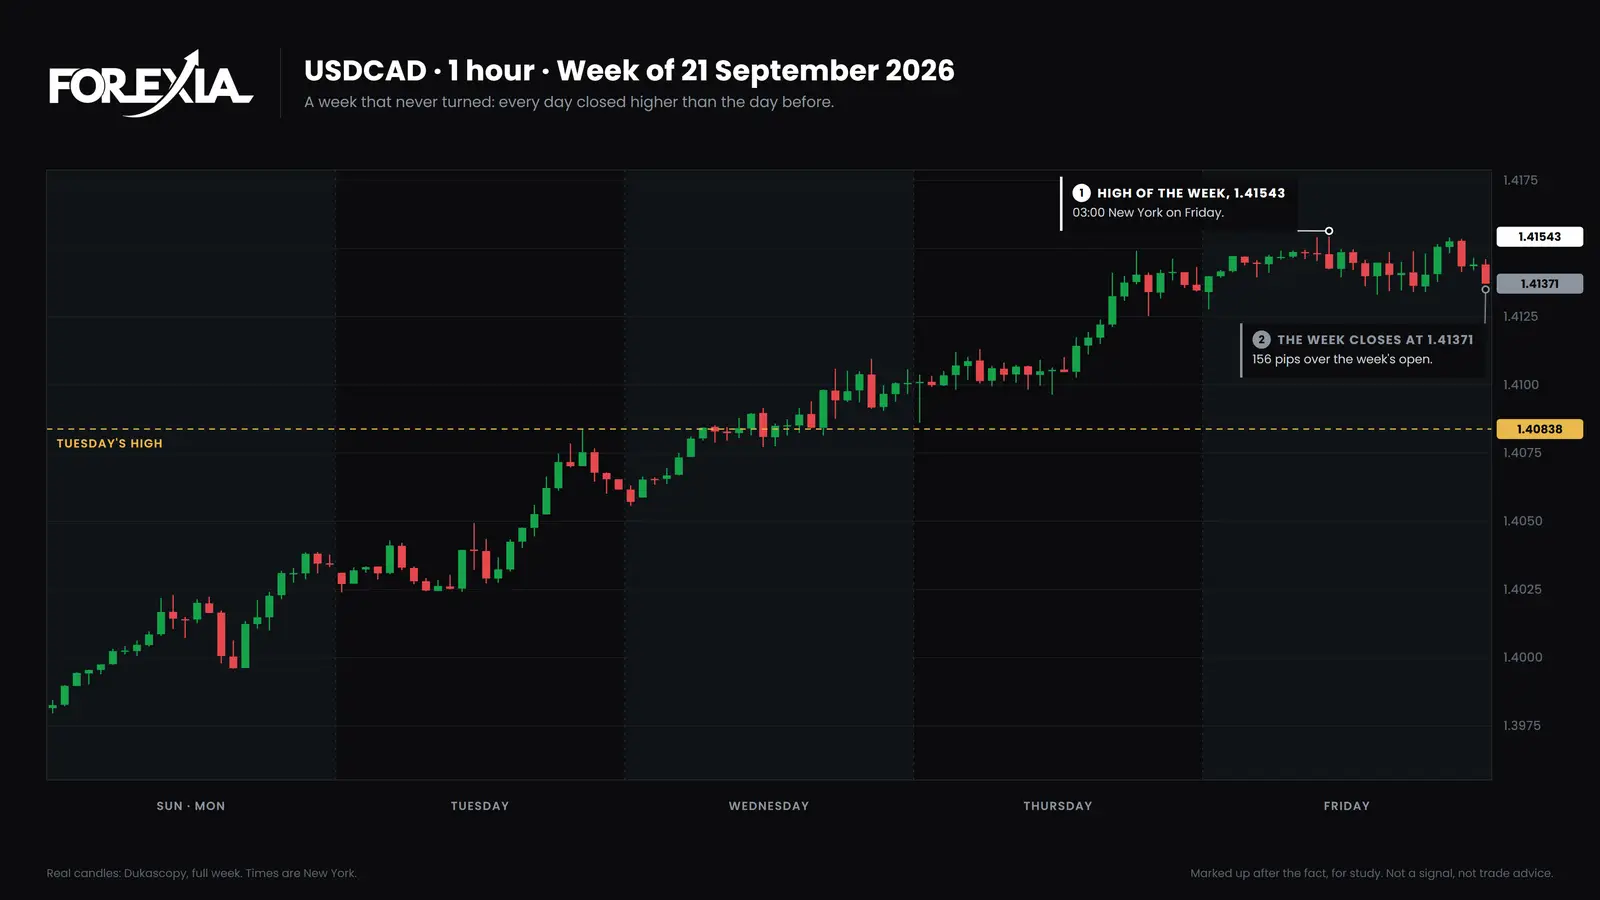
USD/CAD, week of 21 September 2026: no turn
This is the week the cycle does not describe, and our weekly cycle charts never show one, because we only draw them when a week turned. USD/CAD opened at 1.39815 and closed every day higher: 1.40341, 1.40616, 1.41007, 1.41346, 1.41371.
It even offered a trap to point at. In Wednesday's session price edged over Tuesday's high of 1.40838, by about a pip at first and never by more than 10, and 15-minute candles closed back under it on and off until 09:15. That is the same picture as a hunt and a close back. Then it rose for two more days, to a high of 1.41543 at 03:00 on Friday.
In the same week, USD/JPY rose to a high of 159.034 on Thursday and fell 210 pips to 156.938 by Friday. Same dollar, same week, and two different stories, so the calendar could not have told you which one you were in.
Forex weekly cycle examples collects more weeks, and a week marked up in full shows the read on a live chart page.
What is the best day of the week to trade forex?
No day is best in any sense that pays, and most pages that name Tuesday to Thursday show no data for it. We counted the range of every day on seven majors and gold, from 6 April to 1 October 2026: 1,030 market-days, with Friday counted one week fewer. A day's range is its high to its low, break to break, with the rollover spike taken off its first candle. Because pips cannot be pooled across markets, each is a share of that market's own average day.
| Day | Median range, share of the average day | On days with a high-impact US release (market-days) | On days without one (market-days) | Reached its 20-day average |
|---|---|---|---|---|
| Monday | 86% | 101% (32) | 84% (176) | 56 of 176 |
| Tuesday | 83% | 104% (56) | 77% (152) | 49 of 176 |
| Wednesday | 97% | 106% (168) | 63% (40) | 78 of 176 |
| Thursday | 97% | 108% (112) | 87% (96) | 77 of 176 |
| Friday | 89% | 88% (112) | 91% (86) | 70 of 166 |
The last column starts in May, because it needs 20 days of history first. Three things come out of the table.
- Midweek is bigger, and the calendar explains much of it. With a release, Wednesday and Thursday ran 106% and 108%. Without one, Wednesday was the smallest of any row at 63%, on only 40 market-days. In this sample most Wednesdays had one.
- Tuesday was not the big day. It had the smallest median range of the five, which sits badly with "Monday is slow, Tuesday is the real move". A bigger range is not a better trade, so that is no mark against it. Why Monday is slow takes that up.
- Friday is not small. It was bigger than Monday and Tuesday. A release made no difference to it here, and we have no reason to offer for that. Is Friday a bad day to trade forex has real Fridays.
A bigger range is not a better trade. A big day needs a wider stop for the same read, and the spread can widen around the release that made it big. Our fixed test of the daily setup lost money after costs on each weekday, in all four periods. So the honest answer is that the best day is whichever your own method's log says. These are 25 weeks and four days, on markets that often move on one dollar, and a count of candles and not of trades.
Weekly forex forecast: what could be seen on one Sunday
A weekly forex forecast usually names a direction. We draw a map, which says where stops are likely to rest and leaves the direction open. Take the Sunday of that AUD/USD week.
The week before had ended with a high of 0.70264 and, once a rollover print is left out, a low of 0.69618, 65 pips apart. The week opened at 0.69975, 19 pips over Friday's close and closer to the high than to the low. The COT report, published by the CFTC each Friday, showed where the crowd stood, and the calendar held Australian CPI and a Fed decision, both in Wednesday's session.
That is all that Sunday could say. Nothing there said the low would go first, or that it would go at all. Both lines went that week, the low on Wednesday's session and the high on Thursday, which is less usual than one going: the count above has both going in 20 of 192. The lines said where stops were likely to rest, and nothing about when. The forex weekly outlook goes further, and how to review a forex trading week covers the other end of it.
What can this read not tell you?
It cannot tell you that this week will turn, or on which day. The weekly cycle is a way of describing weeks, and every example on this page was chosen after it finished. Most of them came from weekly charts we only draw when a week has already turned.
We also have no test that says it pays. This page reports no test of the weekly read as a rule, and our test of the daily setup did not make money. A reversal seen afterwards is not a setup. A week can slip a day, and it can also fail to turn, as USD/CAD did.
Course 4 of ForexiaPRO, The Week, in production, follows the week day by day from the Induction Trend to the WTF Reversal.
The words
- ADR Met Tuesday: When the Average Daily Range Is Used Up, and How Often It Is
ADR Met Tuesday is the average daily range used up by Tuesday. How to measure it, a count of 176 Tuesdays, and two real days that read differently.
- Mid-Week Reversal: How to Spot the Turn on the Hourly Chart
The Mid-Week Reversal is the turn itself, after the trap. Read hour by hour on USD/JPY, week of 31 August 2026, and what one chosen week cannot show.
- The Induction Trend: Why I Lose Money Trading the Trend the Week Starts With
The Induction Trend is the Sunday to Tuesday trend the crowd follows. One answer to why I lose money trading, on EUR/USD, week of 22 June 2026.
- The Midweek Trap: A Multi-Day M on One Real Week, Read Candle by Candle
The Midweek Trap is Wednesday's trap, a multi-day, multi-session M. What it looked like on USD/JPY in the week of 6 July 2026, read candle by candle.
- The Weekly Script: Forex Weekly Analysis as a Plan in Three Parts
The Weekly Script reads the week in order: induction, trap, reversal. Forex weekly analysis on gold, 27 July 2026, and a week whose turn came a day late.
- The WTF Reversal: the Midweek Reversal in Forex, Through Wednesday, Thursday and Friday
The WTF Reversal is the run through the herd's stops, Wednesday to Friday. Midweek reversal forex on gold, week of 15 June 2026, read day by day.
Frequently asked questions
What is the weekly cycle in forex?
It is a way of reading the week as three parts in one order: a trend from Sunday to Tuesday that pulls the crowd in, a trap past an earlier day's extreme, then a reversal through the herd's stops. The order is our read. Some weeks never play it, and the day of the turn can move.
Does forex reverse in the middle of the week?
Some weeks do and some do not. AUD/USD turned on Wednesday in the week of 27 July 2026, gold a day early in the week of 11 May, GBP/USD a day late in the week of 27 April, and USD/CAD not at all in the week of 21 September. Midweek is where the method looks, not a rule, and this page gives no rate for it.
What is the best day of the week to trade forex?
No day is best in any sense that pays. Wednesday and Thursday had the biggest median range in our count of 1,030 market-days, and much of that gap followed the releases. A bigger range is not a better trade: our fixed test lost money after costs on every weekday. Pick the day your method needs and your calendar allows.
Which day is the high of the week in forex?
There is no fixed day, and this page gives no count of it. A week's high or low is only known once the week is over, or once it has clearly turned. On the four weeks here the turn came in three different sessions, and one week simply kept rising. Be wary of any rule of thumb that names a weekday without its sample.
Why is Monday slow and Tuesday the real move?
Monday often looks slow because little is scheduled, and its median range was below the market's average day in our count. Tuesday was not bigger, though. Its median range was the smallest of the five days, at 83% of the market's average against 86% for Monday, and a bigger range is not a better trade anyway. On days with no high-impact US release both were smaller still.
Is Friday a bad day to trade forex?
It is not a small day. Friday's median range was 89% of the market's average, more than Monday's or Tuesday's, and it reached its 20-day average on 42% of days. What sets it apart is the weekend: a gap can follow, and nothing can be done about it until Sunday's open. Whether that suits you is a question about your method, not the day.
How do I do a weekly forex forecast?
We do not make one. We draw a map, which says where stops are likely to rest and not where price will go. On the Sunday of the week of 27 July 2026, AUD/USD's last-week high and low sat 65 pips apart and the week opened nearer the high, with Australian CPI and a Fed decision ahead. None of that said which line would go first, and both went.
What is the weekly high and low?
It is the highest and lowest price of a week. Most writing means last week's finished lines, which are fixed, while this week's keep moving until the week is over. We read both as places where stops build. On 177 of last week's lines that were traded through, the week still ended past the line on 100.
Does every week follow the weekly cycle?
No. USD/CAD closed higher on every day of the week of 21 September 2026 and never turned. We only draw a weekly cycle chart when the week turned, so those charts are chosen examples, not a sample. A reversal seen afterwards is not a setup.