
ADR Met Tuesday: When the Average Daily Range Is Used Up, and How Often It Is
ADR Met Tuesday is the average daily range used up by Tuesday, and it is one of the confirmations. The test is plain: Tuesday's own range, from its high to its low, reaches the average of the 20 trading days before it. It tells you the range is used, and we make no claim that it helps or hurts.
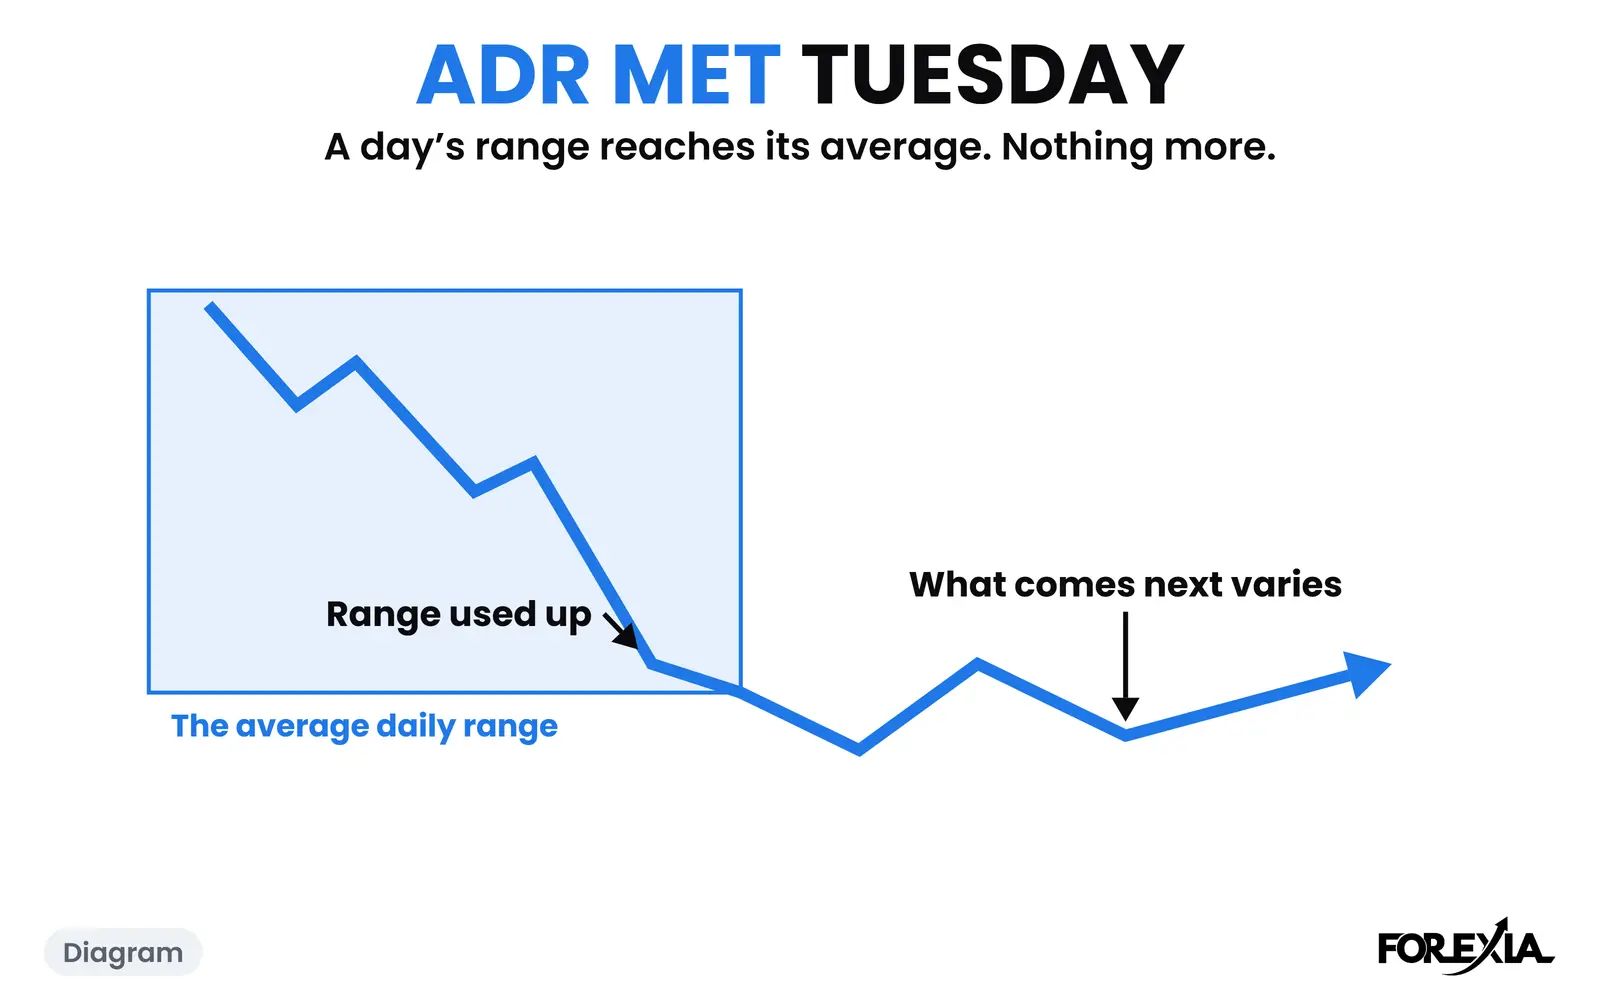
What does ADR Met Tuesday look like on a chart?
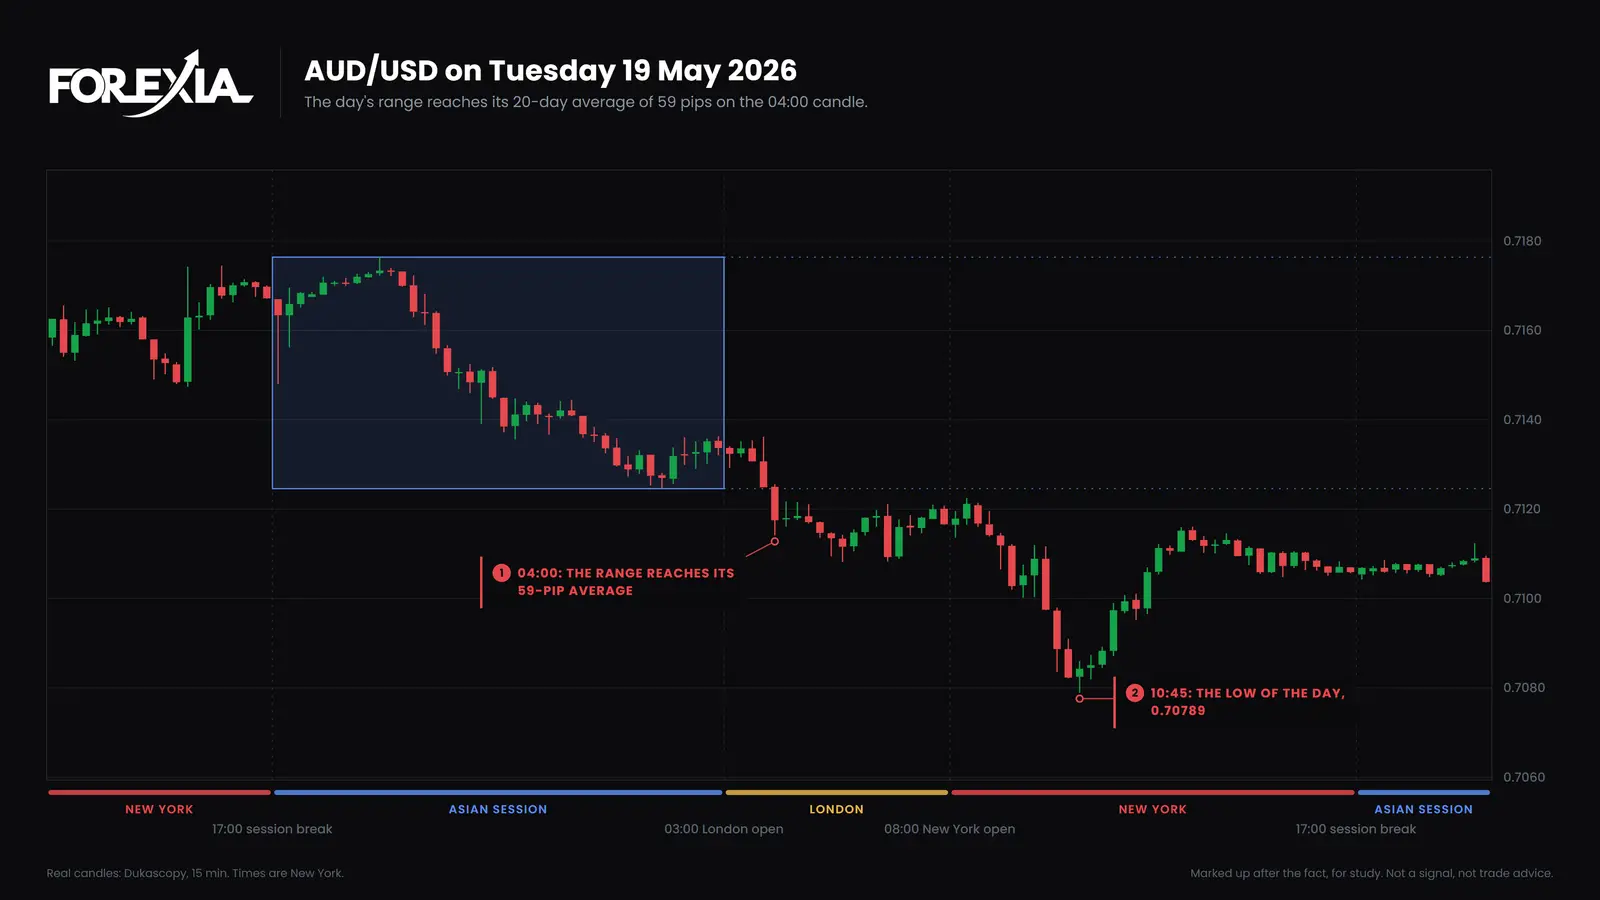
It looks like a Tuesday that has already done a full day's work with hours to go. On AUD/USD on Tuesday 19 May 2026 the 20-day average was 59 pips. That session opened at 17:00 New York on Monday and had covered 62 pips by the 04:00 candle, when price was at 0.71141.
Price kept going. The low came at 10:45 at 0.70789, 35 pips under that candle's low. Tuesday's range finished at 98 pips, on a day that also carried the RBA's minutes. By 11:15 on Wednesday price was at 0.71739, 95 pips off that low.
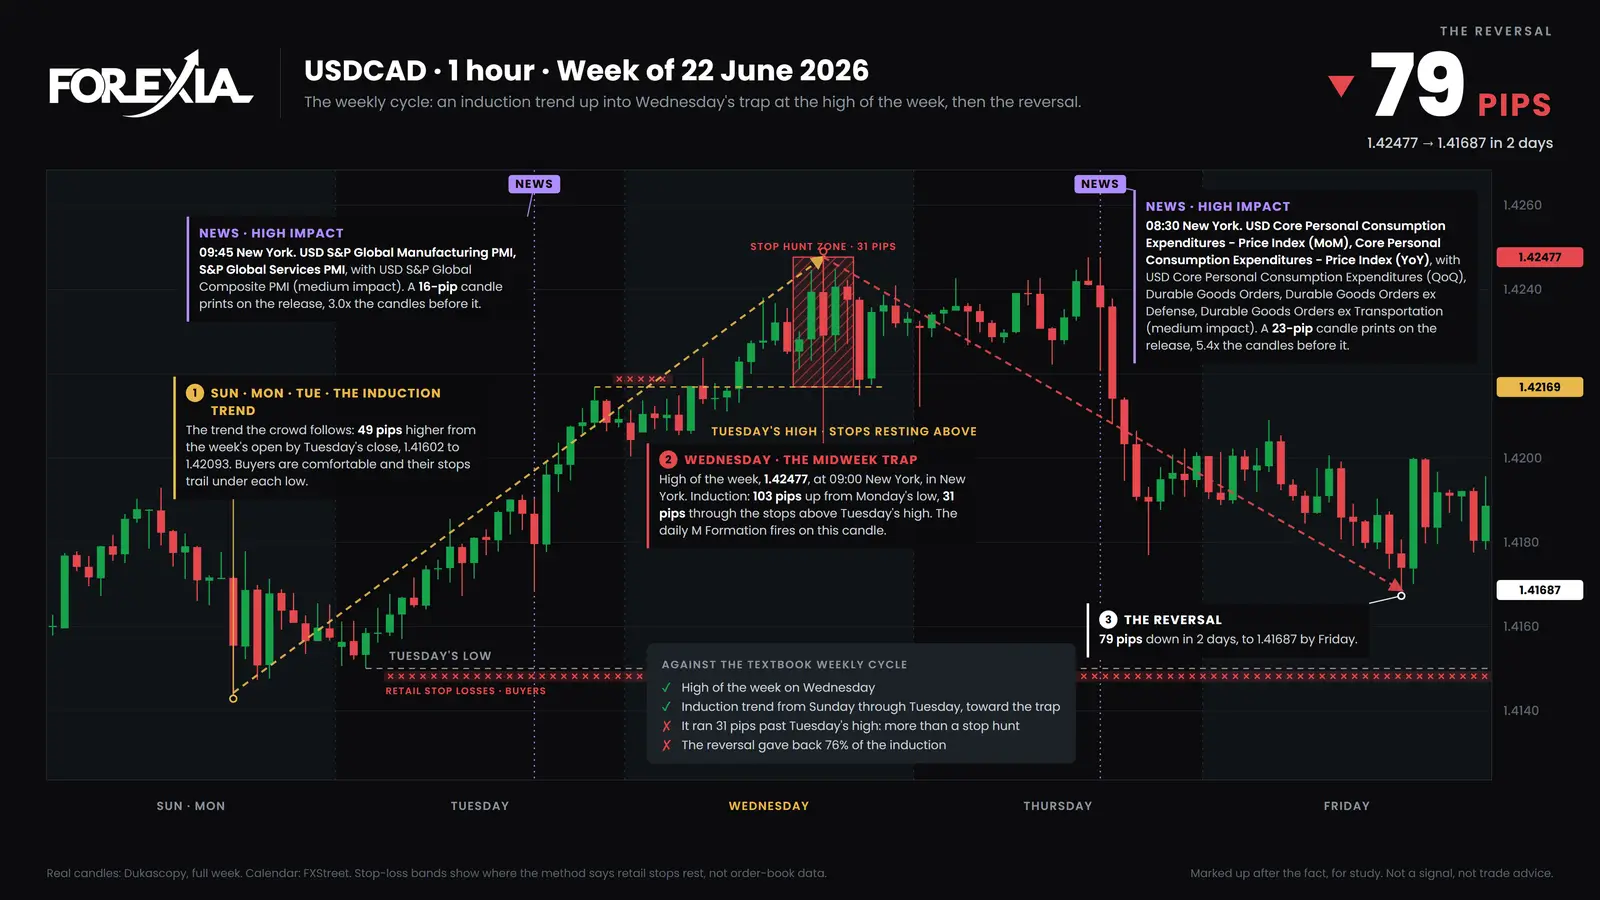
The second day went the other way. On USD/CAD on Tuesday 23 June 2026 the average was 60 pips, and Tuesday's range reached it on the 13:00 candle. It finished at 67 pips, with the high at 1.42169. A reader who took that as the end was early: at 09:00 on Wednesday price reached 1.42477, 31 pips higher. It touched the same price again on Thursday, and by 09:15 on Friday it was at 1.41687, 79 pips off the high.
ADR Met Tuesday and the average daily range: what is the difference?
The average daily range is a measurement. ADR Met Tuesday is one reading of it, on one day, in one place in the week. Add up the high-to-low range of the last 20 trading days and divide by 20. Tools often use 14 or 20 days, and they call a market "exhausted" at a threshold of their own, 90% in one script and the full average in another. Those thresholds are conventions, not findings.
Our word differs in two ways. It asks only about Tuesday, because Sunday to Tuesday is where the Weekly Script places the Induction Trend. And it is one piece of a read, never a reason to act alone. The midweek reversal guide shows what comes after it.
How often does Tuesday reach its average daily range?
Less often than the days after it. We counted seven majors and gold on 15-minute candles. A day runs from the 17:00 New York session break to the next, and its first candle's low is cut to its body, because that wick is often only the spread. Met means the day's range reached the average of the 20 market-days before it. The first day tested on each market is in May 2026, and the last is Thursday 1 October, so Friday has a week fewer than the other days. The 20 days here are the course's; the Asian Box page's share of an average day takes the markup tool's 15, so the two averages differ.
| Day | Days counted | Reached the average | Share |
|---|---|---|---|
| Monday | 176 | 56 | 32% |
| Tuesday | 176 | 49 | 28% |
| Wednesday | 176 | 78 | 44% |
| Thursday | 176 | 77 | 44% |
| Friday | 166 | 70 | 42% |
Read it with care. That is 22 Tuesdays on each of eight markets that often move on the same dollar, and 8 of the 49 came on one day, US CPI on 14 July 2026. It counts ranges and says nothing about what price did next. We make no claim that a Tuesday that met it turned more or less often than one that did not.
How do you spot ADR Met Tuesday?
The count keeps two numbers on Tuesday: the market's 20-day average, and the session's high minus its low so far. When the second reaches the first, the average is met.
Use the same market only. An average of 59 pips means something on AUD/USD and nothing on gold.
What do traders get wrong about ADR Met Tuesday?
Three readings cost the most.
- Reading met as finished. AUD/USD fell another 35 pips after its average was used.
- Reading it as a turn on the day. USD/CAD made its high the next day, 31 pips over Tuesday's.
- Treating it as a rare event. More than one Tuesday in four reached it, and 8 of the 49 came on one release. It is a common measure, not a signal. A reversal seen afterwards is not a setup, and our own test of the daily setup as a mechanical rule did not make money.
Which words does ADR Met Tuesday lead into?
Two sit next to it.
- The Induction Trend: the trend of Sunday, Monday and Tuesday that dumb money follows.
- The Midweek Trap: the trap after it, a multi-day, multi-session M.
Where is ADR Met Tuesday taught?
ADR Met Tuesday is taught in Course 4 of ForexiaPRO, The Week, in production.
Related words
Frequently asked questions
What does ADR met mean in forex?
It means a day's range, from its high to its low, has reached the market's average daily range. We use the average of the 20 trading days before it. ADR Met Tuesday is that test on a Tuesday, read as one of the confirmations. We make no claim that it helps or hurts.
How often does Tuesday reach its average daily range?
On 49 of 176 Tuesdays (28%), in our count of seven majors and gold from May to 1 October 2026. Eight of those 49 came on one day, US CPI on 14 July. Wednesday, Thursday and Friday each reached it on 42 to 44% of days in the same count. This says how often a range was used, not what price did next.
Does price reverse once the average daily range is met?
We make no such claim. On AUD/USD on 19 May 2026 Tuesday used up its average by 04:00 New York, and price fell another 35 pips that morning. On USD/CAD on 23 June 2026 price went 31 pips past Tuesday's high the next day. A used-up range is a reading, not a signal.
How do you calculate the average daily range?
Add up the high-to-low range of each of the last 20 trading days and divide by 20. Tools often use 14 or 20 days. Pick one and keep it. Compare the result only with the same market, because a normal day on gold is many times a normal day on EUR/USD.