COT Report Gold: Reading the Week Published 16 October 2026
Dylan Forexia7 min read
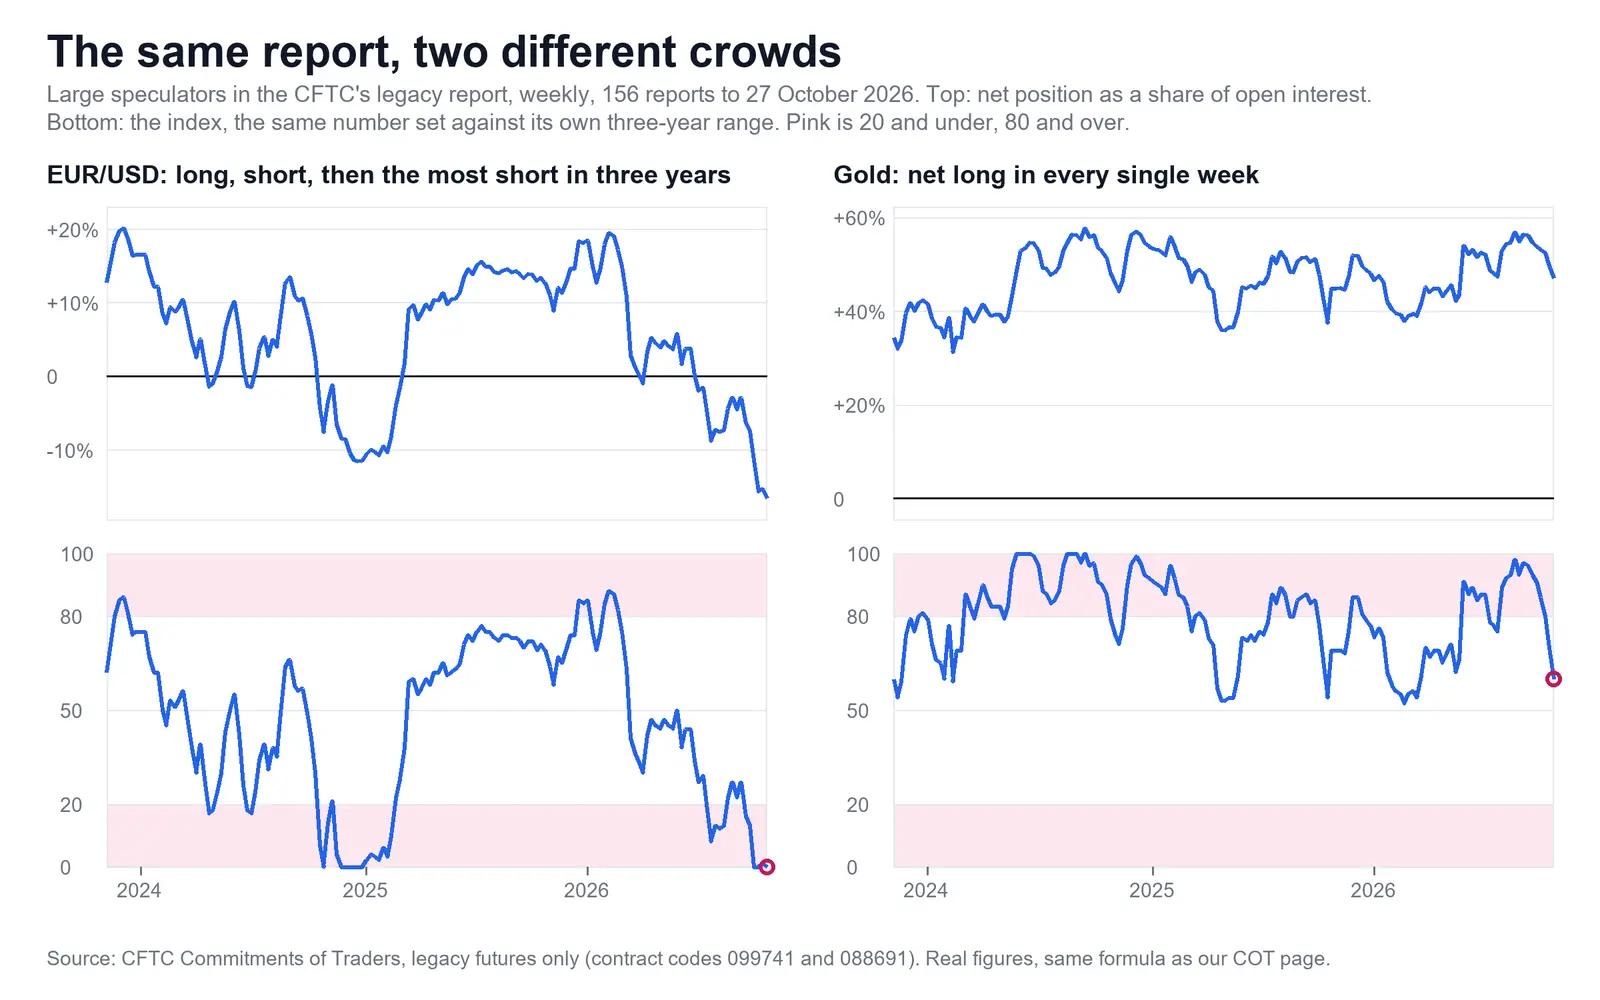
The COT report for gold counted on Tuesday 13 October 2026 and published on Friday 16 October had large speculators net long 207,879 contracts, index 80: crowded long, just, and long in every one of the last 156 reports. This page reads that report part by part, then sets it against what gold did in the two weeks after.
It is one dated week, not today's position. The Commitment of Traders report guide explains the report itself. For how to trade gold, as opposed to reading its positioning, that guide is the place.
How do you read the COT report for gold?
Start with which column you mean, because gold has two speculator series. The contract is GOLD on COMEX, code 088691, 100 troy ounces, and it needs no turning round. On our charts $1 counts as 1 pip. Gold is in the legacy and disaggregated reports and not in Traders in Financial Futures.
Here is one Tuesday, from the CFTC's public figures, with open interest of 396,345 contracts.
| Group | Report | Long | Short | Net | Share | Index |
|---|---|---|---|---|---|---|
| Large speculators (non-commercial) | Legacy | 245,300 | 37,421 | +207,879 | +52.4% | 80 |
| Managed money | Disaggregated | 124,747 | 17,658 | +107,089 | +27.0% | 58 |
| Commercials | Legacy | 54,419 | 296,950 | −242,531 | −61.2% | 15 |
The first and second rows do not disagree. Managed money is the funds and trading advisers, a narrower group than the first. It is why two gold pages can show different crowds on one Friday: on our lines the first row is crowded and the second is not. We use legacy so that one group means the same on all eight markets, and we say that it is a choice. Never compare a legacy week with a managed money week.
The commercials' short is ordinary. Producers, merchants and swap desks hedge. A big commercial short in gold is the other side of the long, and it does not show them betting against the price.
What did the COT report for gold say that week?
It said crowded long, by a hair, with the crowd already leaving. The index had been at 96 four weeks earlier. In those four weeks net long fell by 22,459 contracts and gold fell 3.0%. It was the eleventh week in a row at 80 or over.
| Report counted | Net long | Share | Index | Gold at Tuesday's close |
|---|---|---|---|---|
| 18 August | 222,189 | 54.7% | 93 | 4330.14 |
| 25 August | 243,334 | 56.9% | 98 | 4656.63 |
| 1 September | 228,124 | 54.9% | 93 | 4327.43 |
| 8 September | 231,960 | 56.4% | 97 | 4355.51 |
| 15 September | 230,338 | 56.2% | 96 | 4289.39 |
| 22 September | 225,853 | 54.7% | 93 | 4356.56 |
| 29 September | 218,632 | 53.8% | 91 | 4181.72 |
| 6 October | 210,335 | 53.1% | 86 | 4164.28 |
| 13 October | 207,879 | 52.4% | 80 | 4161.16 |
| 20 October | 199,865 | 49.7% | 70 | 4124.39 |
| 27 October | 186,451 | 47.0% | 60 | 4059.94 |
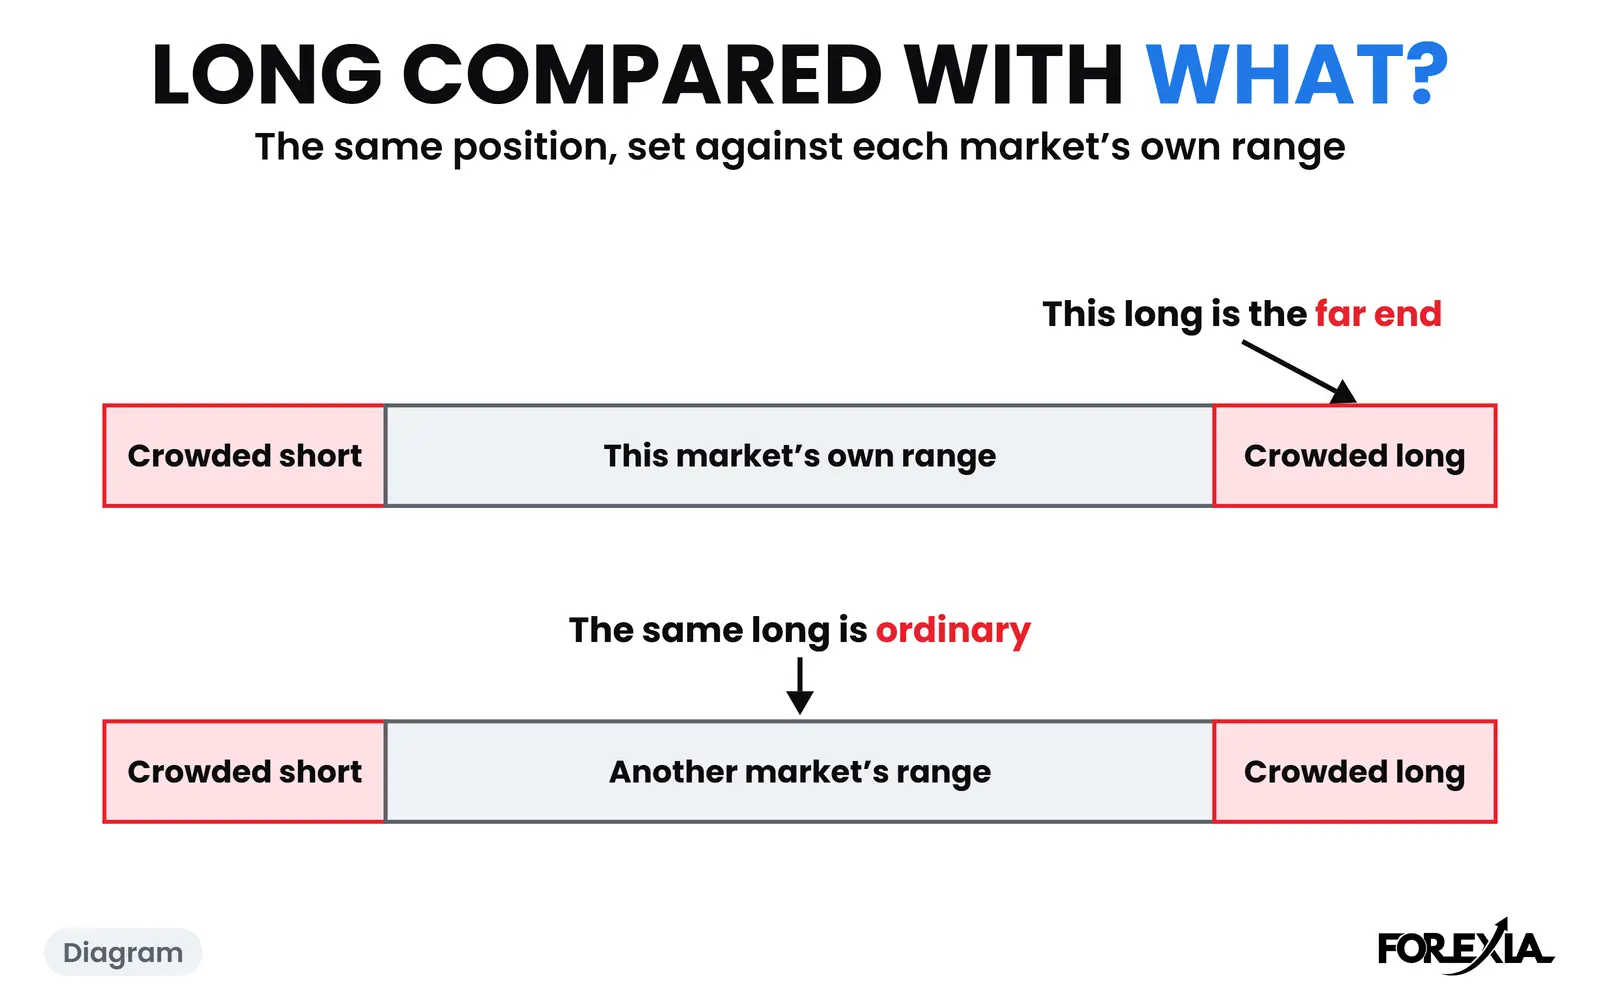
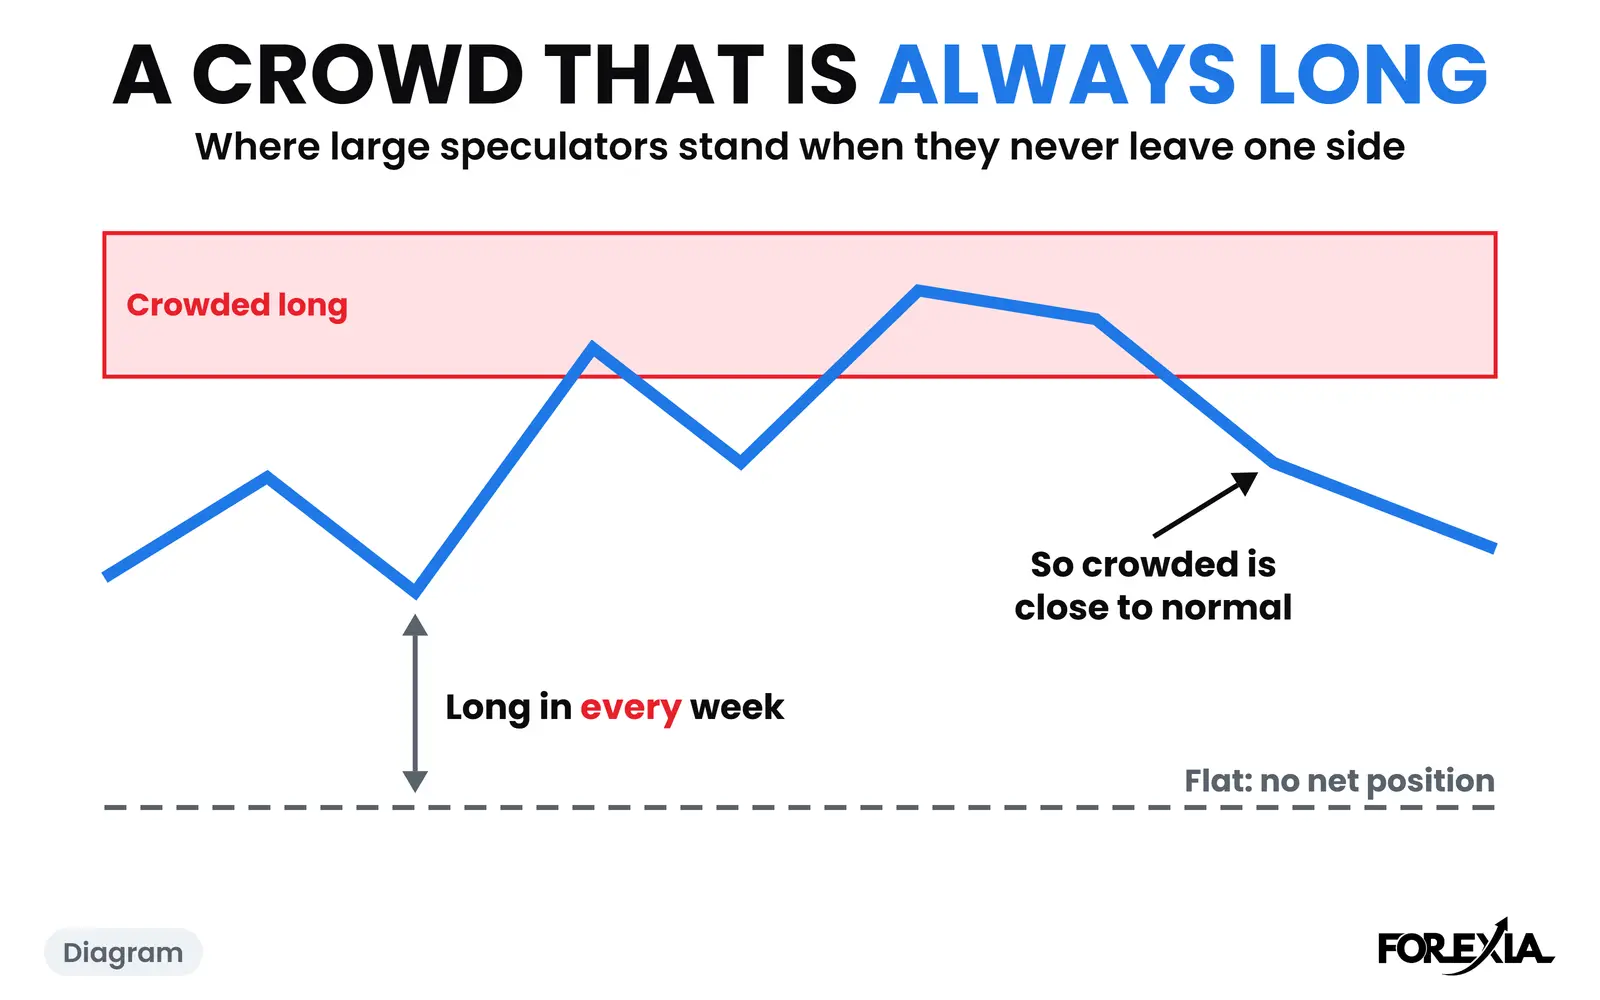
Two cautions sit under that table. Gold's crowd has been net long in every report we read, and it was crowded long in 80 of the 156 reports to 29 September 2026, so a reading of 80 here says less than an 80 on the euro. And part of the slide from 96 to 80 was the ruler: old weeks left the three-year window in early October and raised its low, a point that what the COT index means works through.
At 80 on 13 October we read this crowd as the side not to join, which is Fade the Crowd. That report ruled out joining the buyers. It did not say the next move was down, and it said nothing about when.
Which levels mattered on gold that Friday?
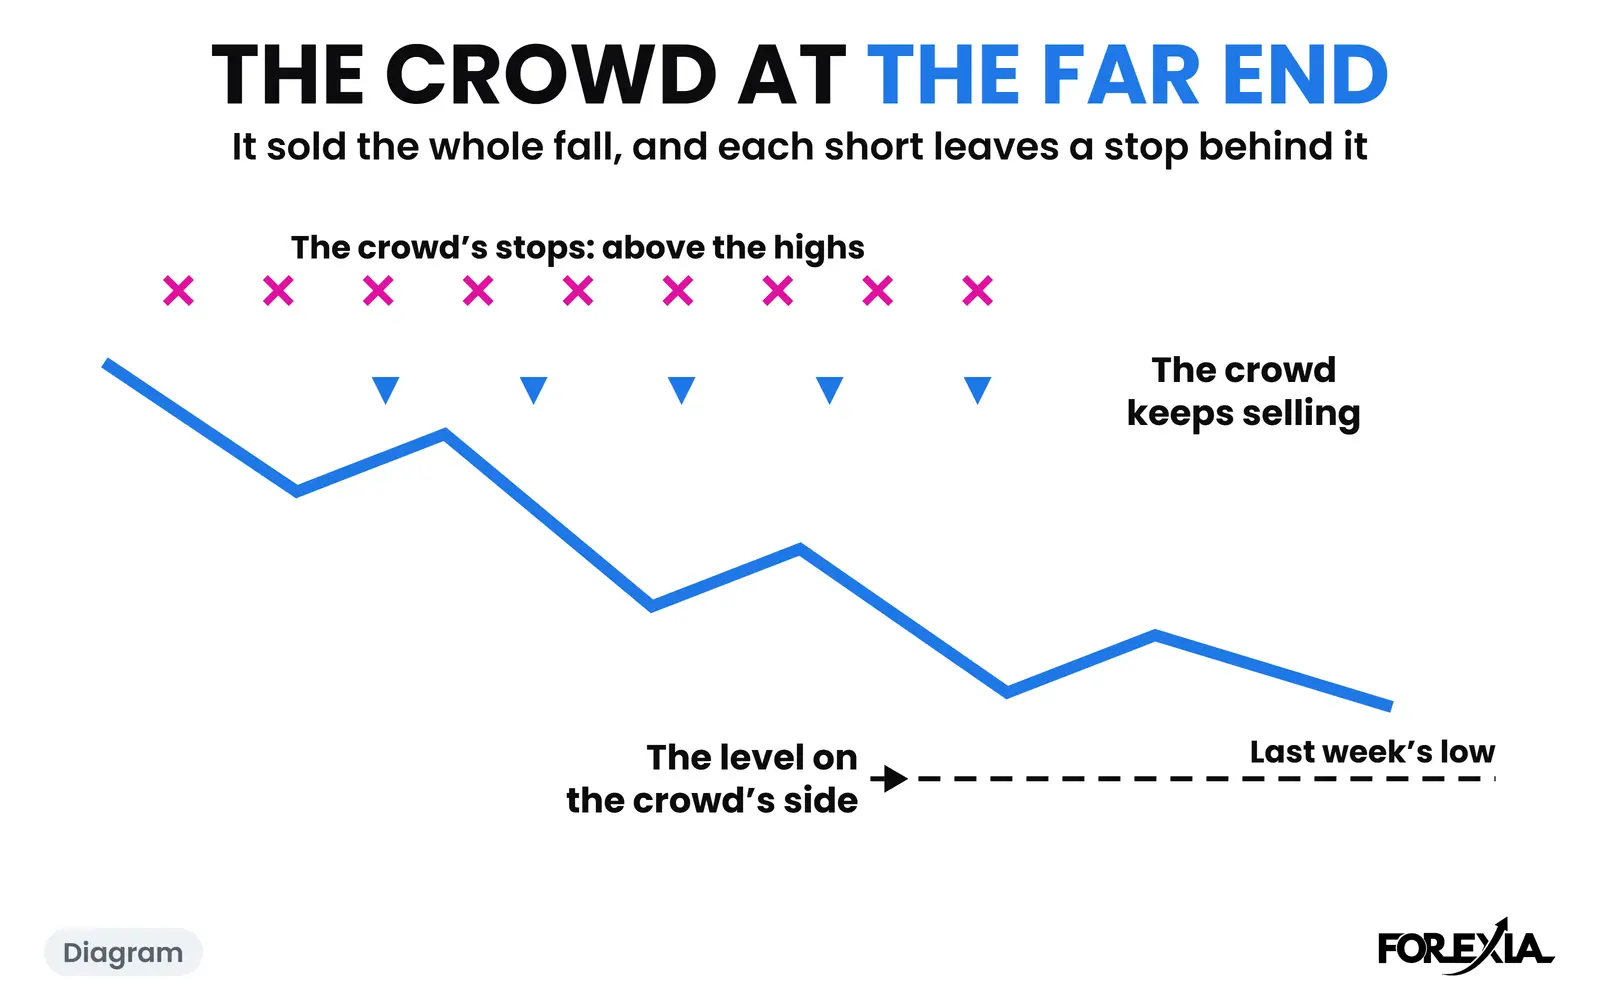
The ones the whole crowd could see, because our read of a crowded long puts its stops under the lows. At Friday's close gold was at 4165.27. Last week's high, the top of the week just ended, was 4216.89, printed on the Sunday evening. The low of the week before was 4065.55, from Wednesday 7 October.
Those are the week's high and low, which we read as the biggest pools on a chart. Over the high sit the orders of anyone waiting to buy a breakout, on the crowded side. Under the lows sit the stops of the crowd itself. Nobody outside can see either. It is a reading of the structure, and the report holds no stop orders.
What we do with those lines stays in the course. What follows is only what gold did.
What did gold do after the report?
It fell, and it never went over that high first. Gold's first session after the report, Monday 19 October, reached 4190.31 at 03:30 New York, $27 short of 4216.89, and ended at 4140.56. The high of the week was that one candle. No high- or medium-impact US release came that day.
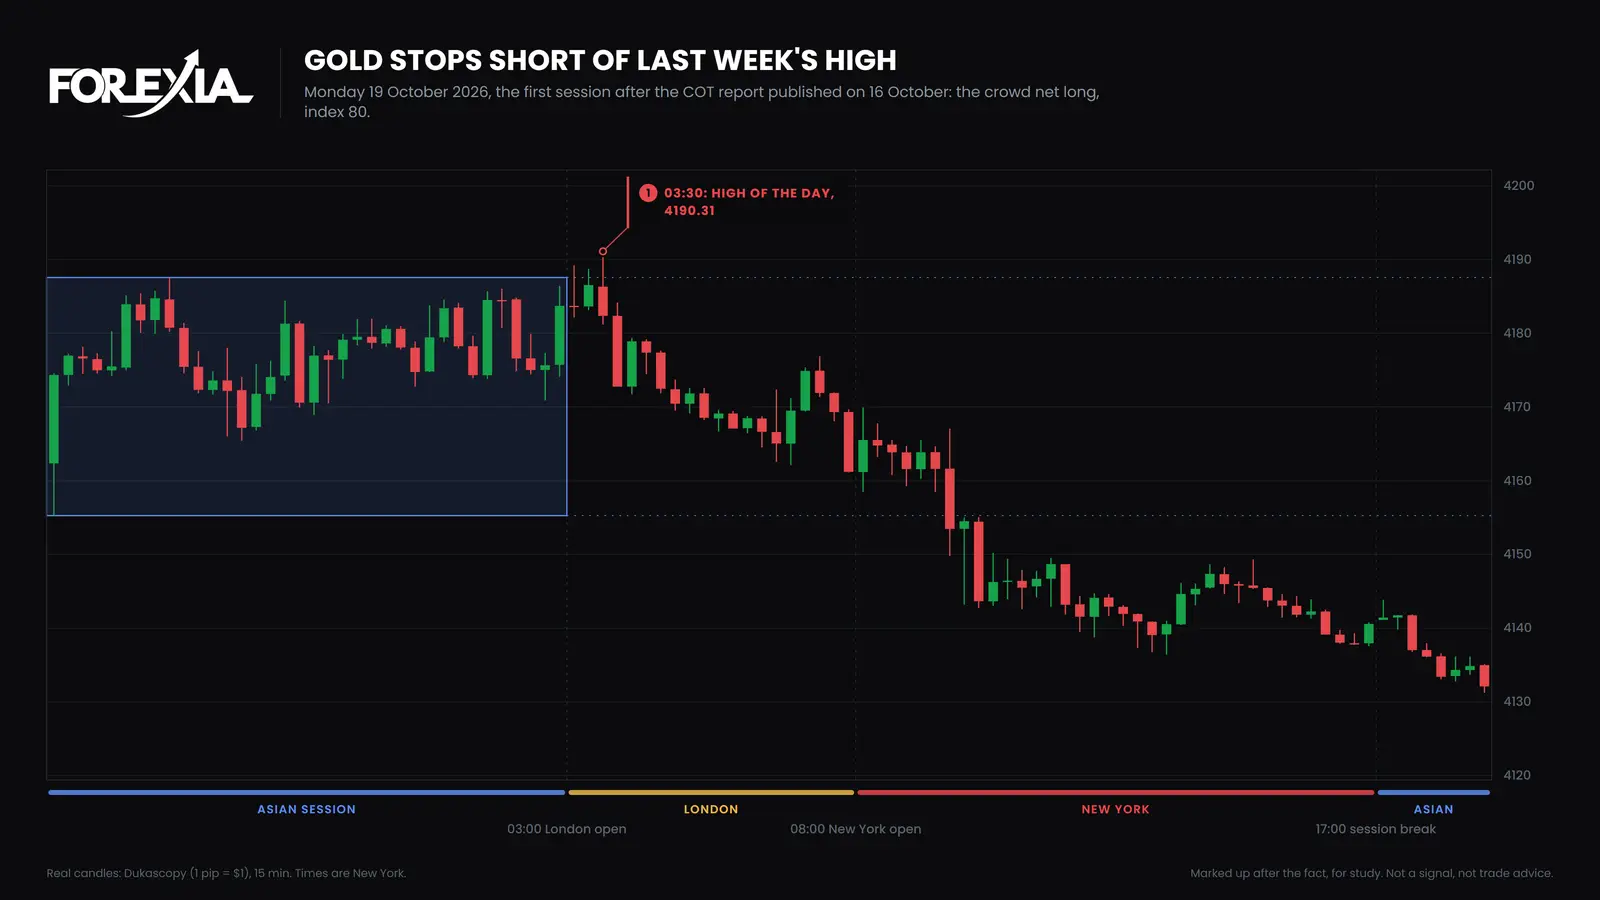
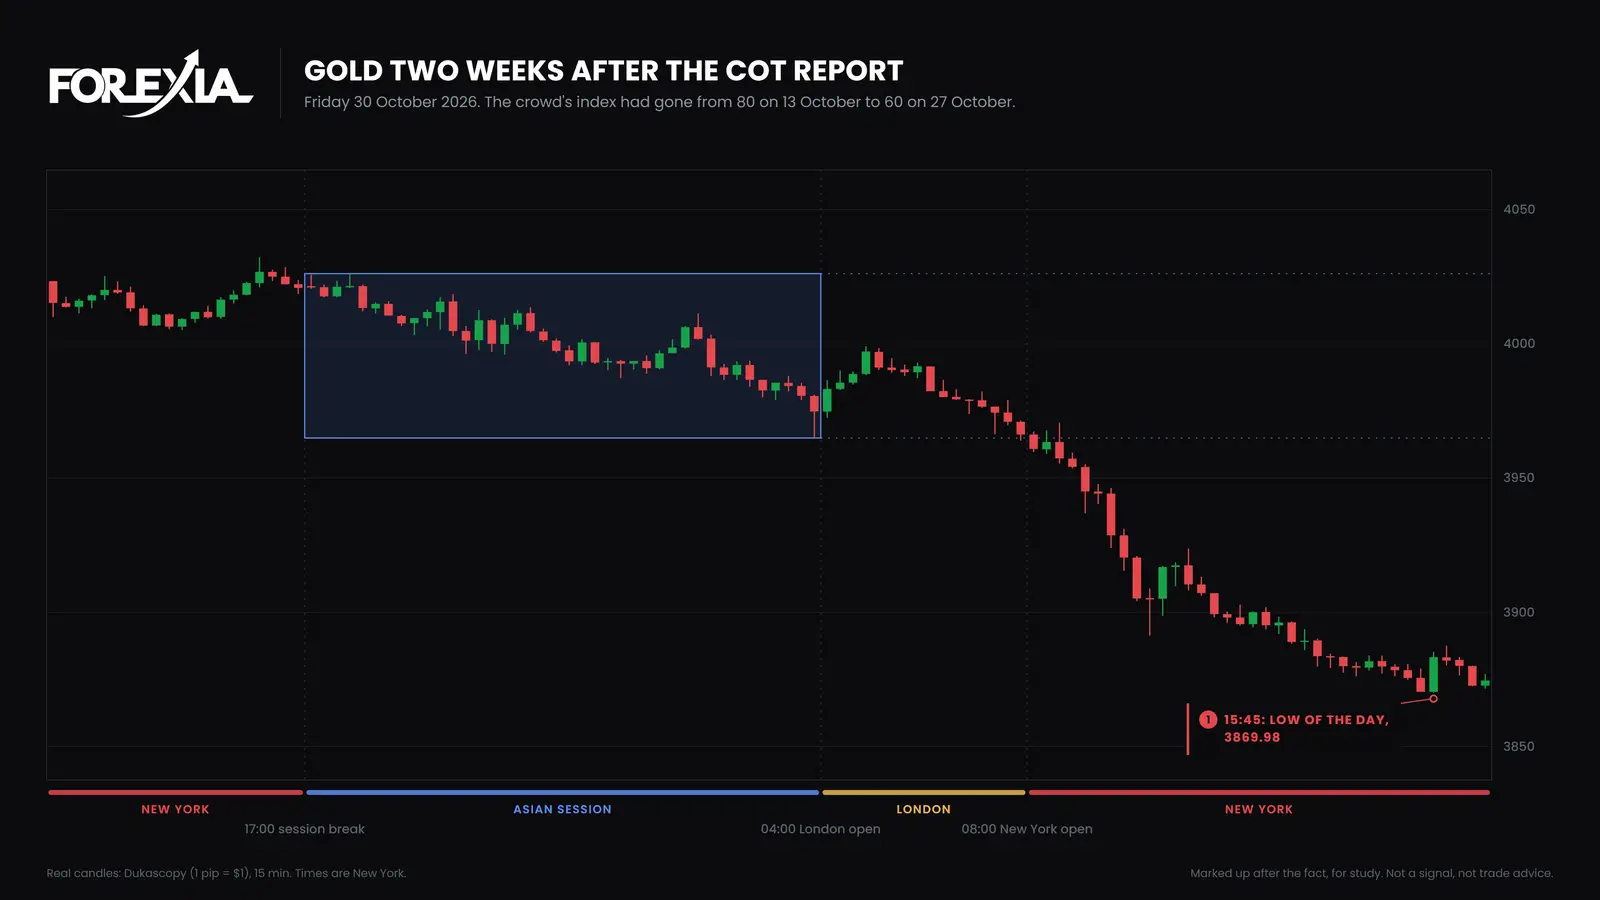
On Thursday 22 October gold went from 4145.64 to 4020.91, through the 4065.55 low, and on Friday 23 October it reached 3975.33. The week after brought a bounce to 4081.96 on Wednesday 28 October. Then on Friday 30 October it fell all day, from 4026.18 to 3869.98 at 15:45, and ended at 3874.59. The BLS had the Employment Cost Index down for 08:30 that day, the only US release our calendar rates high or medium, and it rates that one medium.
In the fortnight after the count the crowd let go of 21,576 long contracts, from 245,300 to 223,724, and left our crowded zone with its first report, at an index of 70 on 20 October.
Read that with care. Nobody was shown a push over the high, so this was no reversal off a level. It was a fall with a crowded long behind it, seen afterwards, on one market. Most reports are followed by nothing so clear, and the same reading in August was followed by gold running higher for days first. What moves gold on a given day is another question, and why gold fell after a weak jobs report is one example.
What did each seat read in the gold report?
The same row reads three ways, from the three seats.
- Retail sees 52.4% of all contracts long and concludes that gold's strong, or that the top is in. Neither follows.
- The market maker, as we read it, sees longs who must sell to get out, with stops under the lows, and hedgers already on the other side.
- The observer sees a crowd at the line, thinning, on a market where it is always long. So the read is weaker here, and it stops at which side not to join.
What do traders get wrong about the gold COT report?
Four errors cost the most on this market.
- Calling the net extreme by its size. 207,879 contracts sounds huge. It is ordinary for gold's crowd to be long, and 47.0% of open interest two weeks later was an index of 60.
- Mixing the series. Legacy said 80 and managed money 58 on the same day. A rule written for one does not apply to the other.
- Reading 80 as a sell. It rules out joining the buyers. Our test of the report shows why that is far from a trade: joining a crowded side lost, and fading it is promising and not proven.
- Reading the futures as spot. The report counts COMEX positions. Gold also trades in a large over-the-counter market centred on London, so this row is a sample of big traders in one venue.
To see how it works on a market where the crowd changes sides, read the euro's report from the same week.
Course 1 of ForexiaPRO, Reading the Map, teaches this read step by step in lesson 1.3.4, Reading This Week's Report.
Frequently asked questions
Where do I find the COT report for gold?
On the CFTC's site and its public data feed, under contract code 088691, GOLD on the Commodity Exchange. It appears in the legacy and disaggregated reports and not in Traders in Financial Futures. A contract is 100 troy ounces. Unlike the yen or the franc, gold's future needs no turning round.
What is the difference between non-commercial and managed money in gold?
Non-commercial is the legacy report's whole speculative group. Managed money is a narrower group in the disaggregated report: commodity funds and trading advisers. On 13 October 2026 non-commercial was net long 207,879 contracts at an index of 80, and managed money was net long 107,089 at an index of 58 on the same formula.
Why are commercials always short gold?
They hedge. Producers, merchants and swap dealers hold large short futures against gold or exposure they already have. On 13 October 2026 the legacy commercial group was net short 242,531 contracts, 61.2% of open interest. Their short is the other side of the speculators' long, and it is not by itself a bet on the price.
Is gold crowded on the COT report right now?
This page is dated. In the report counted on 27 October 2026 the large speculators were net long 186,451 contracts, 47.0% of open interest, at an index of 60, which is not crowded on our lines. Members read each week on our COT Report page, and the CFTC's feed serves the figures.