COT Index Meaning: What a Crowded Side at 20 or 80 Tells You
Dylan Forexia8 min read
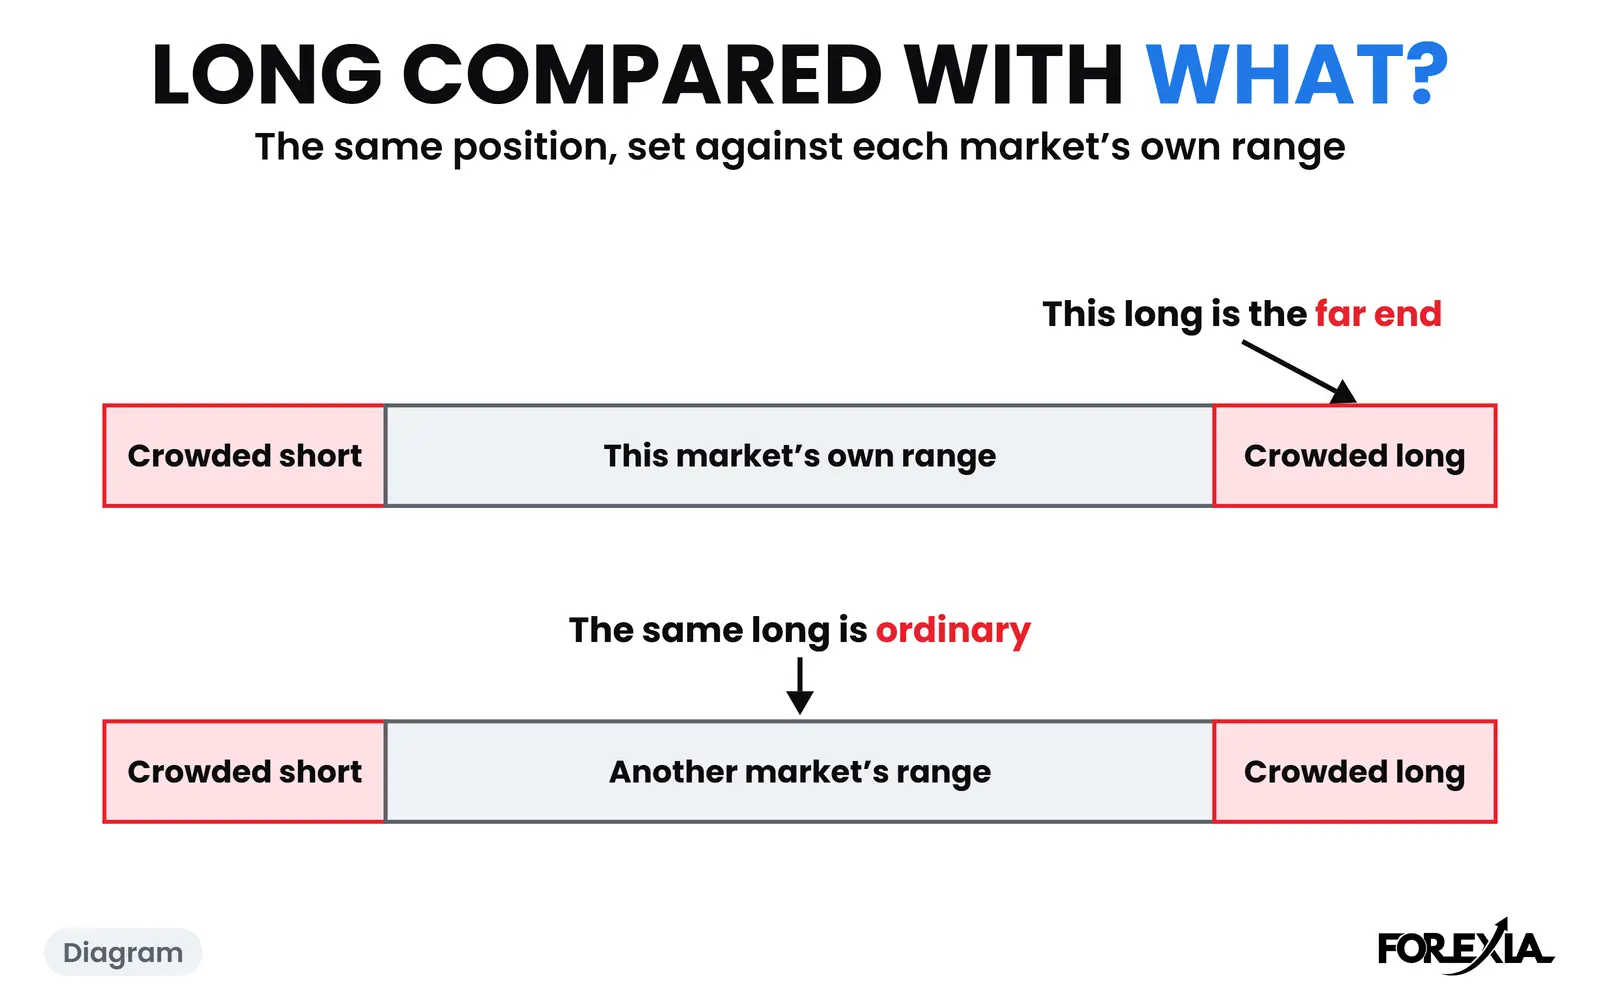
The COT index meaning in one line: it scores where a group of traders stands against its own past, from 0, the most short they have been in the window, to 100, the most long. It answers one question a net position cannot: long compared with what? It is not a forecast, and the CFTC does not publish it.
We follow the large speculators in the COT report. At 20 or under we call them crowded short, and at 80 or over crowded long. The rest of this page shows how the number is built, how much it depends on who built it, and what it does and does not do on a real chart.
COT index meaning: what does the number measure?
It measures position against range, and nothing else. We take the large speculators' net position as a share of open interest, then ask where that share sits in the market's own last 156 weeks:
Index = (this week's share − lowest share) ÷ (highest share − lowest share) × 100
Take USD/JPY in the report counted on Tuesday 13 October 2026. The yen future runs opposite to the pair, so the 191,256 contracts long and 141,049 short turn into a net short of 50,207 on USD/JPY. Open interest was 373,502, so that is −13.4%. Over three years the share ran from −50.7% to +53.5%. So 37.3 points above the low, out of a range of 104.2, gives an index of 36.
Three things follow from that sum.
- 50 does not mean flat. It means the middle of that group's range. This USD/JPY reading of 36 was a net short, and on 13 October USD/CAD read 55 with its crowd net long 94,765.
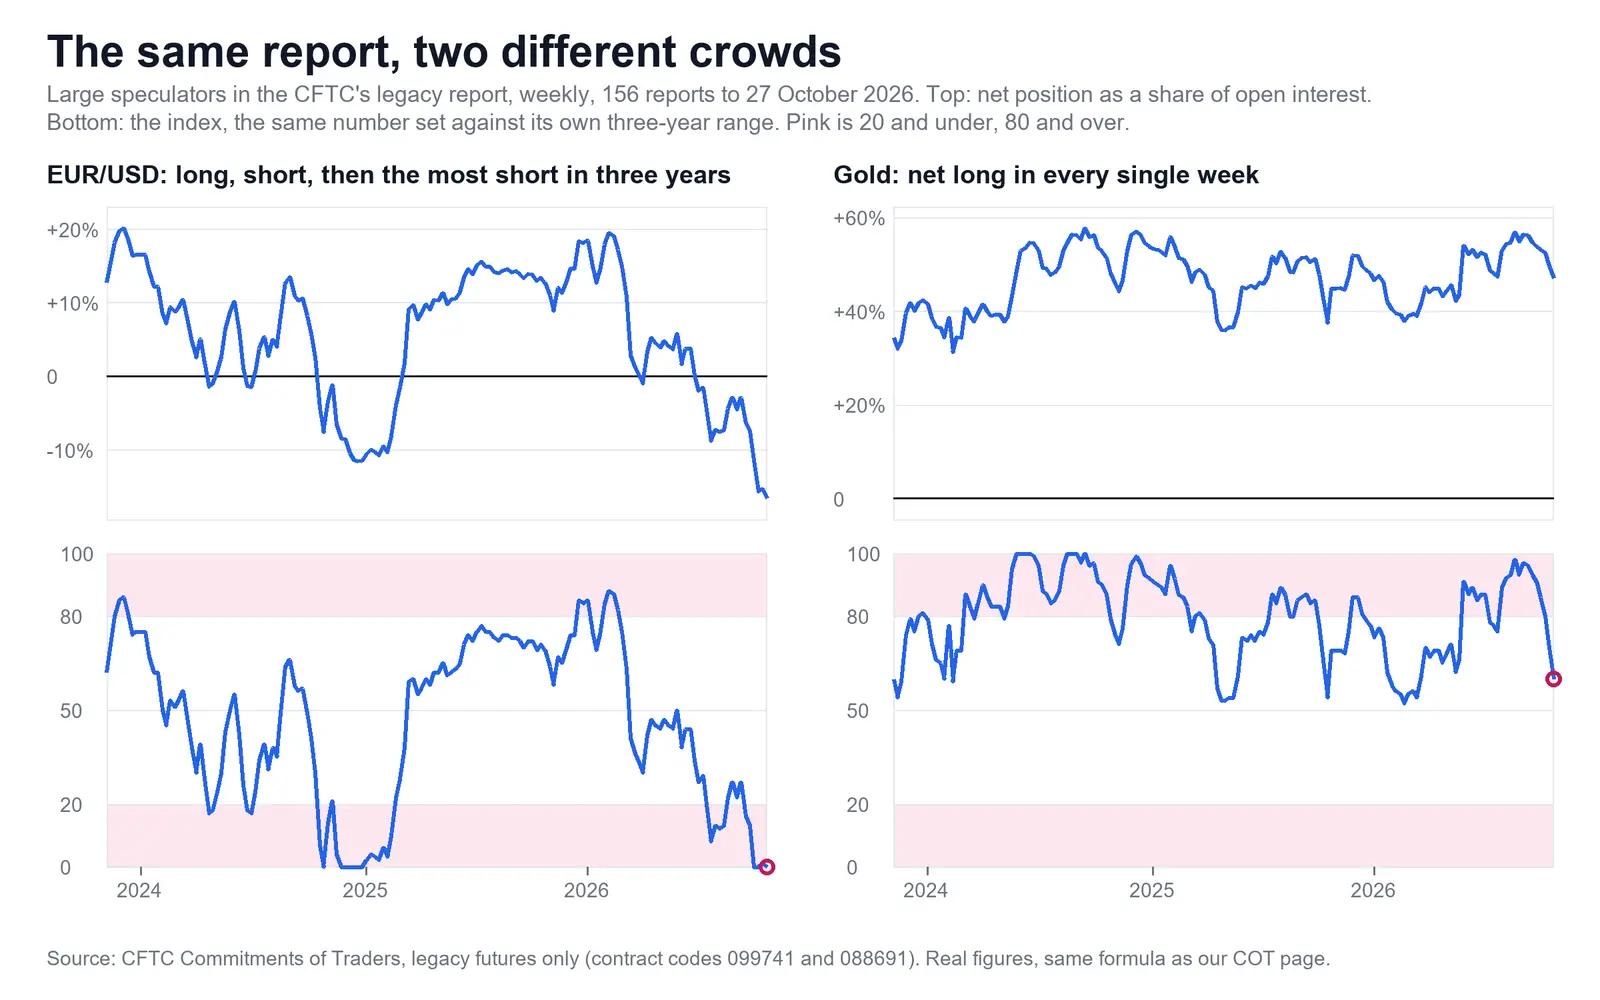
- 100 does not mean long. On that same Tuesday the euro's dealers, in the Traders in Financial Futures report, were net short 164,763 contracts at an index of 100. As a share of open interest, they were the least short they had been in three years.
- It compares a market with itself. A 20 on the pound and a 20 on the kiwi are not the same size of position. The full COT guide works the euro and gold side by side.
Why does one week give different COT index numbers?
Because nobody owns the formula, and small choices move it a long way. Here is one report, counted on 13 October 2026, on all eight markets. The first index column is ours. The other three change one thing: a one-year window, a six-month window, or raw contracts in place of the share.
| Market | Share of open interest | 156 weeks, share (ours) | 52 weeks | 26 weeks | 156 weeks, raw contracts |
|---|---|---|---|---|---|
| EUR/USD | −15.7% | 0 | 0 | 0 | 0 |
| GBP/USD | −39.8% | 0 | 0 | 0 | 0 |
| USD/JPY | −13.4% | 36 | 16 | 15 | 35 |
| USD/CHF | +16.1% | 20 | 0 | 0 | 40 |
| AUD/USD | −34.6% | 22 | 12 | 0 | 0 |
| USD/CAD | +25.1% | 55 | 56 | 44 | 56 |
| NZD/USD | −37.6% | 20 | 32 | 32 | 19 |
| Gold | +52.4% | 80 | 77 | 70 | 42 |
Only two rows agree. USD/JPY is ordinary on ours and crowded on a shorter window. NZD/USD is crowded on ours and ordinary on a shorter one. Gold is the widest: 80 on the share and 42 on raw contracts.
Gold's gap has a plain reason. Its largest net position in those three years was 315,390 contracts, on 24 September 2024, with open interest of 564,640. In October 2026 open interest was 396,345. The market had shrunk, so the same share of it is fewer contracts. Raw contracts call that a middling position. The share calls it near the top. We use the share for that reason, and it is a choice. To try the sum on other numbers, there is a COT index calculator among our tools.
The window moves too, with nobody trading. Gold's lowest share was 16.4% in every report that summer, up to 29 September 2026. Then old weeks dropped out of the 156, and by 13 October the lowest was 31.2%. The share that week gives 80. Against the old low, it would have read about 87. So seven points of the slide to 80 came from the ruler.
So a line is only as good as the number under it. Keep to one formula, and read any single index as that formula's answer.
What does crowded at 20 and 80 mean?
It means the crowd is near the end of its own range, and we read that as the side not to join. Our word for the read is Fade the Crowd. The lines are ours and no law: other readers use 10 and 90, and what is a COT extreme compares them.
In that report five of the eight were at a line or past it. The euro, the pound, USD/CHF and the kiwi were crowded short, and gold was crowded long. AUD/USD at 22 was close to the line and not on it.
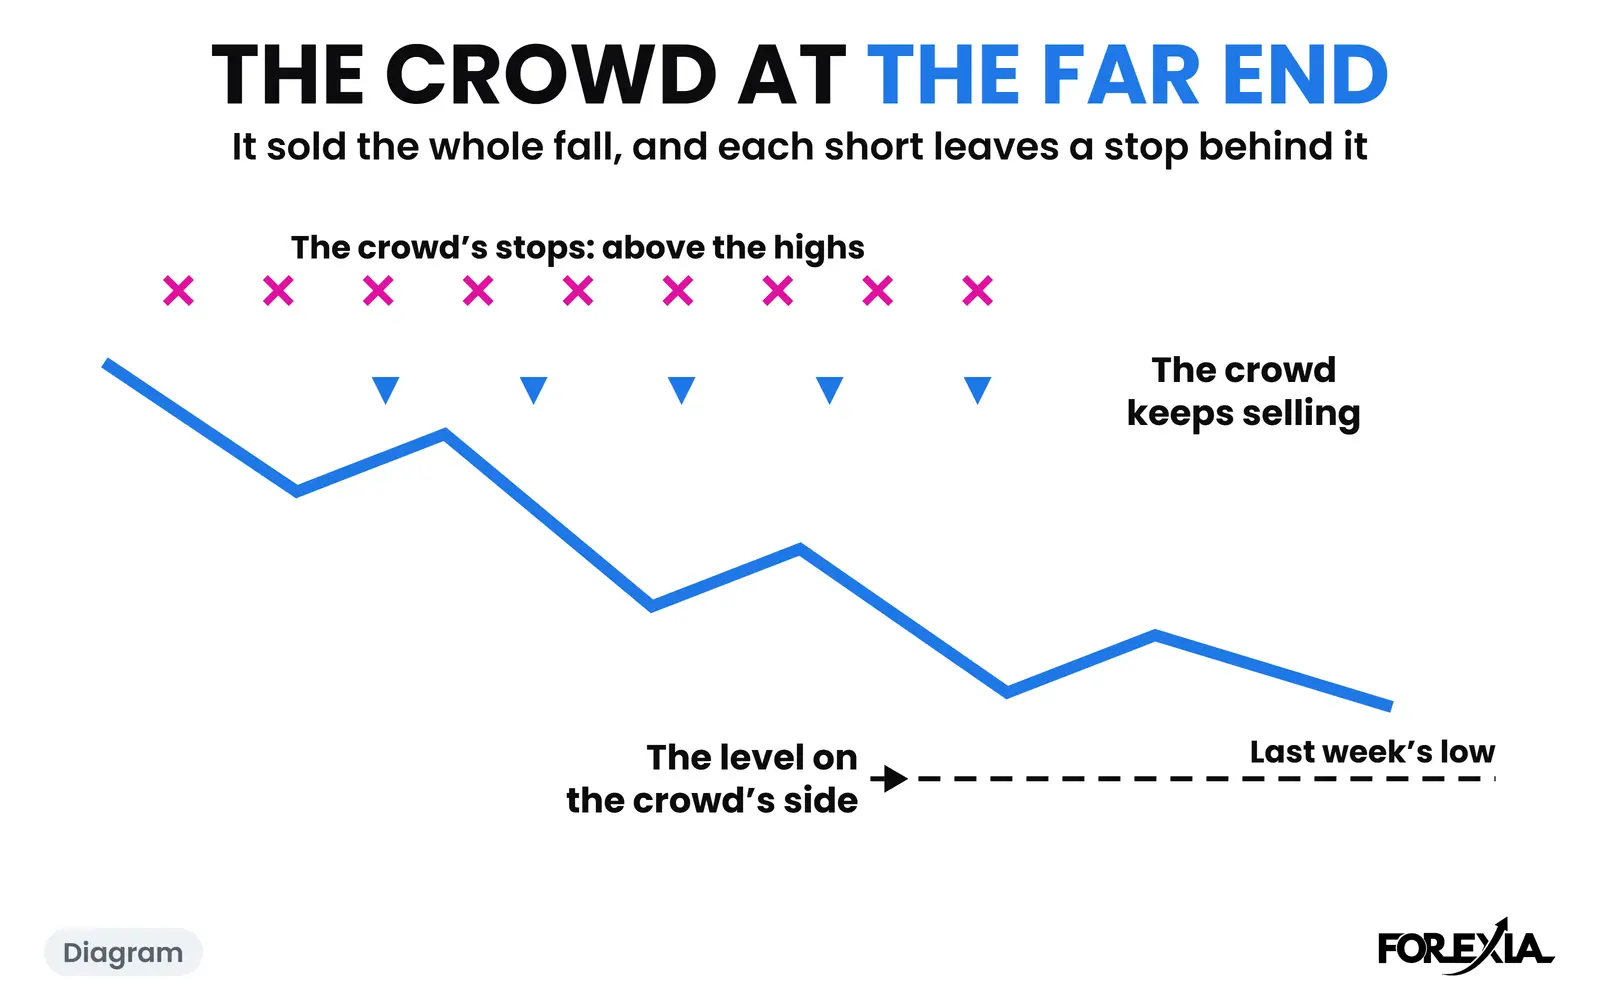
From the three seats, one reading gives three pictures. Retail sees conviction: everyone is short, so short must be right. The market maker, as we read it, sees fuel: a crowded short is a pile of buy orders above the highs. The observer sees which side is ruled out, not which side wins. Large speculators are funds, not Dumb Money, though at the ends of their range we read them as trading much the same way.
What does an index of 0 look like on a chart? GBP/USD
It looks like nothing, until price has already moved. The pound's crowd was at index 0 in the report counted on 6 October 2026, net short 97,611 contracts, 36.7% of open interest. The full COT guide tells the Wednesday that followed. The next count, on 13 October, was deeper: net short 106,964, 39.8%, still 0, with the pound closing that Tuesday at 1.32544.
On Friday 16 October the pound went through last week's high, 1.32854, and the high of the week before, 1.33109, both before London opened. It reached 1.33714 at 10:30 New York and ended the day at 1.33276. Our calendar lists no high-impact data for either currency on the Friday, but it marks two speeches as high impact on the Thursday evening: the Bank of England's governor at 22:00 and the Fed's chair at 23:30. The first level went in the candle opening at 23:45, right after the second speech, and the other in the candle opening at 02:30.
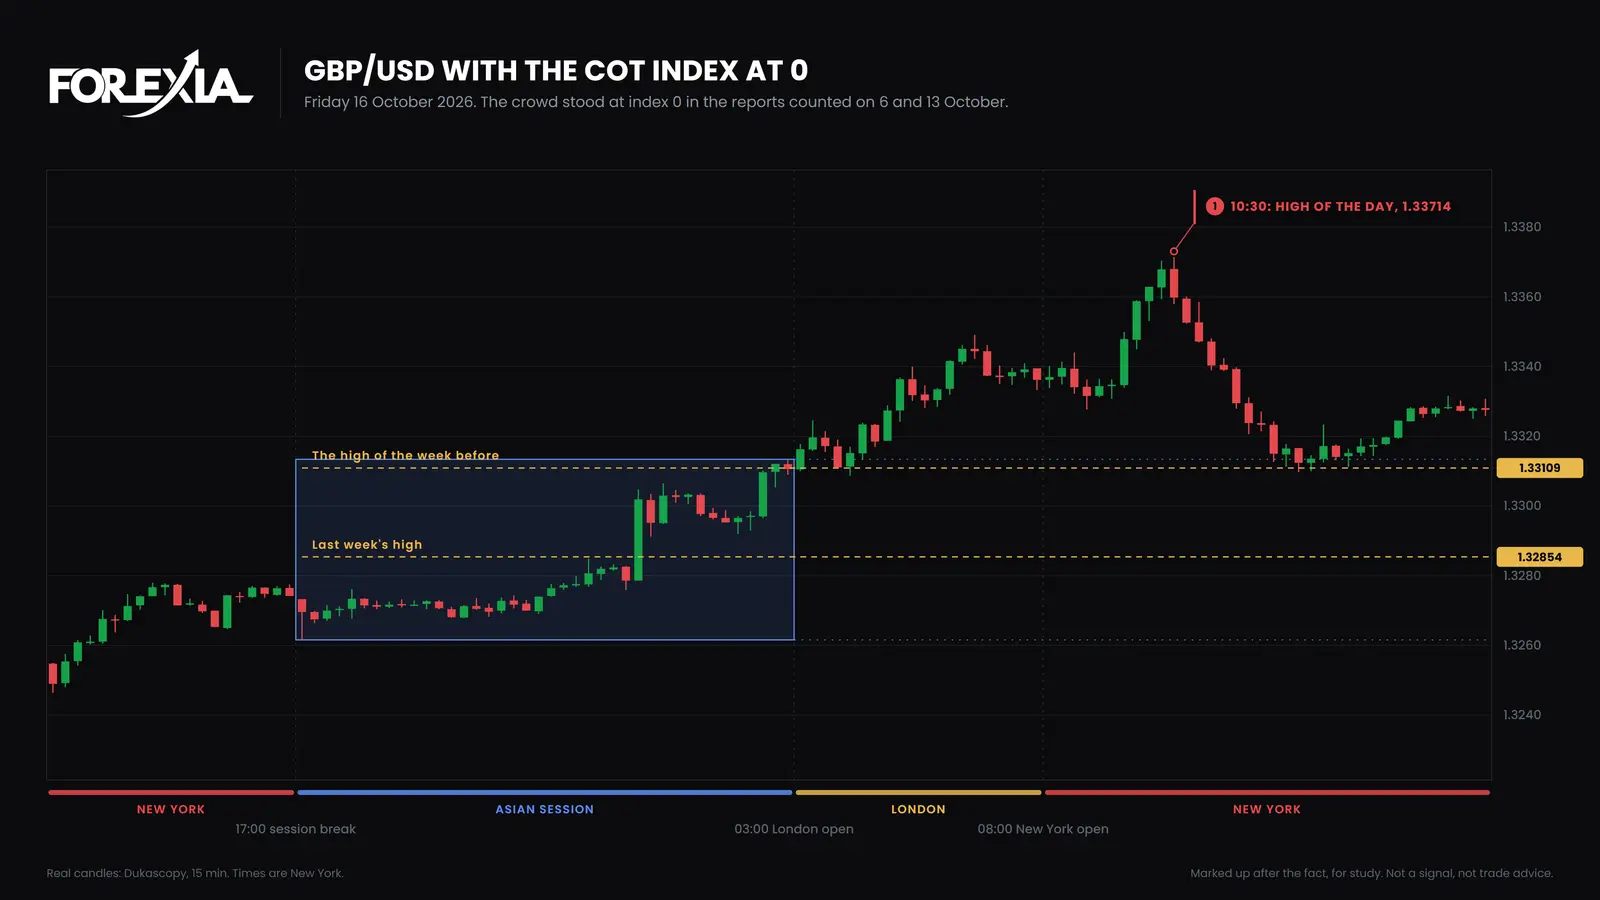
Now watch how slowly the number answers. The count of Tuesday 20 October caught the crowd with 16,501 fewer shorts and 10,043 more longs, net short 80,420. The pound closed that day at 1.33786, 124 pips above the Tuesday before. The index went from 0 to 9. It still read crowded short.
This is one week, picked afterwards. In the five weeks before it, the same crowded reading sat through a fall. A move seen afterwards is not a setup, and the index did not say which week was which.
What does no read look like? USD/JPY at 36
It looks like an ordinary market, and it can still move hard. At 36 on 13 October and 31 on 20 October, USD/JPY's crowd was neither crowded short nor crowded long, so our read says nothing about it. That reading had a history. The same crowd was at 85 on 28 July and 27 on 15 September, having gone from net long 163,412 to net short 120,359 in seven weeks. The long had already gone.
On Thursday 22 October USD/JPY fell from 158.251, at 20:30 New York the evening before, to 156.687 at 07:15, which is 156 pips. No high- or medium-impact dollar or yen release came before that low. The day ended at 156.763.
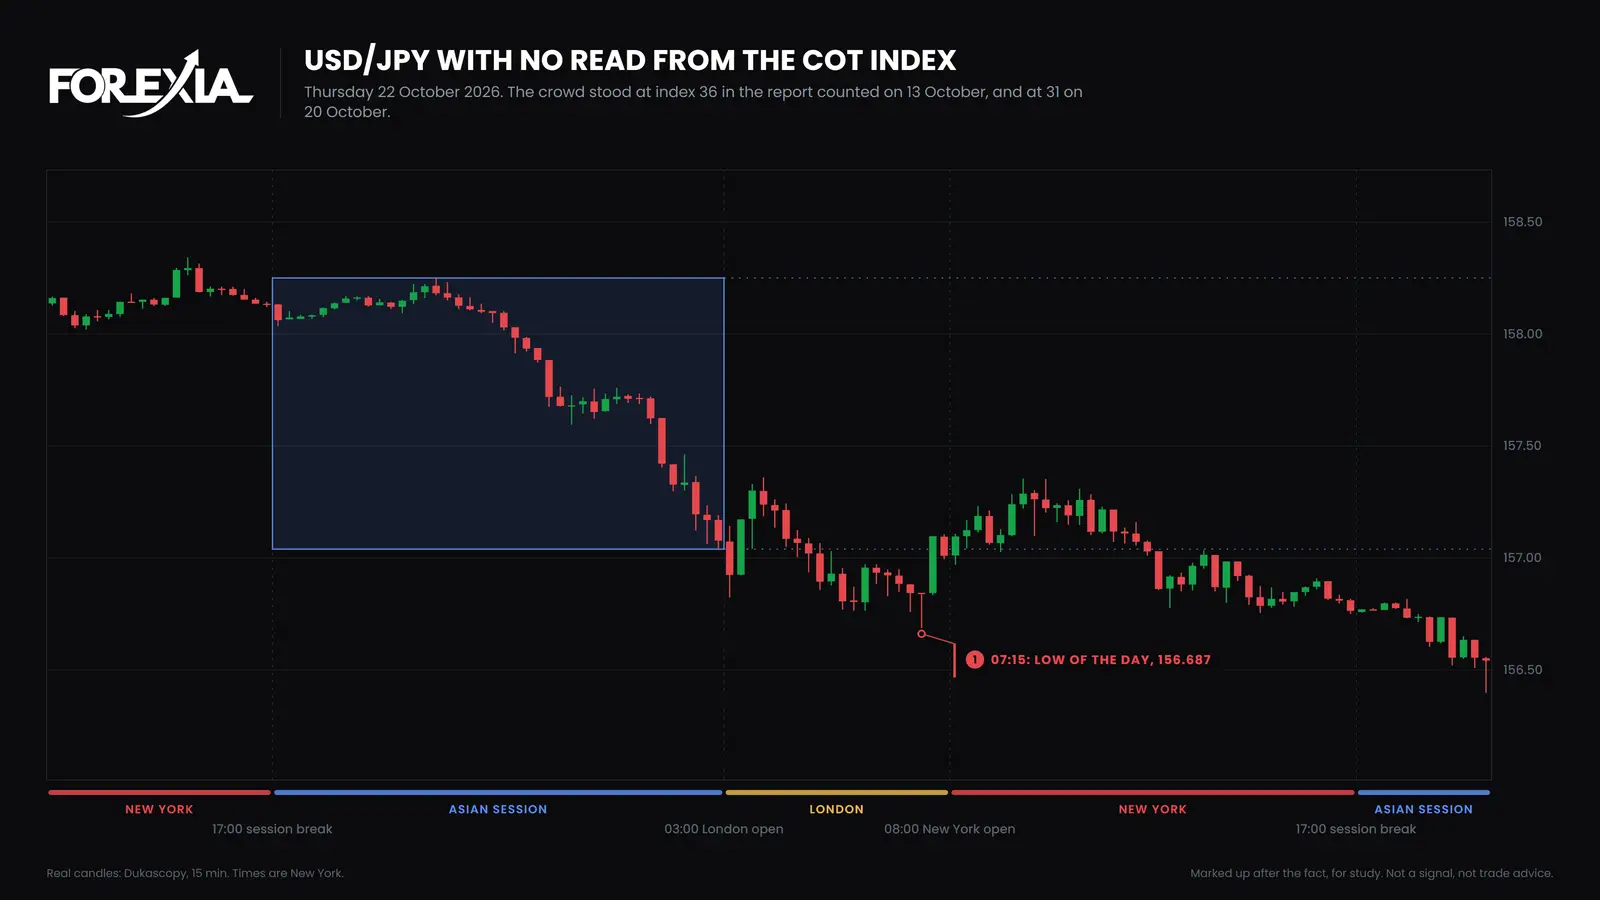
No read does not mean no move. It means the report has nothing to add. By the count of 27 October that index was 23, near the line and still not on it.
What do traders get wrong about the COT index?
Five readings cost the most.
- Reading gold's 80 as strength. On 13 October that number meant the crowd was already long, in a market that had fallen 3.0% in four weeks.
- Forgetting whose formula said so. That week AUD/USD read 22 on ours, 12 on a one-year window and 0 on raw contracts. Each answer belongs to its own formula.
- Reading it as direction. USD/CHF sat at 20, crowded short on our line, while its crowd was net long 22,078 contracts. That was close to the least long it had been. It was not a short position.
- Ignoring the market's habit. Gold's crowd has been net long in every report we read, and it was crowded long in 80 of the 156 reports to 29 September 2026. A high reading there says less, as the COT report for gold shows.
- Expecting it to time anything. Gold was at 93 on 18 August and 98 a week later, with price rising, before the fall that the full guide follows. For how the report starts, see what the COT report is in forex.
In our tests, joining a crowded side lost, and fading it on a level hunt is promising and not proven.
Course 1 of ForexiaPRO, Reading the Map, teaches this read step by step in lesson 1.3.2, Crowded: 20 and Under, 80 and Over.
Frequently asked questions
What is a high COT index?
A reading near 100 means a group is close to the most long it has been in the window. On our page 80 or over is crowded long. The CFTC publishes no index and these lines are our choice, so check which formula and window a tool uses before you compare its number with ours.
Can a COT index of 100 still mean net short?
Yes. The index compares a group with its own range, not with zero. On 13 October 2026 the euro's dealers were net short 164,763 contracts and their index was 100, because that was the least short they had been in three years as a share of open interest. Always read the net and the index together.
What lookback should the COT index use?
There is no correct one. We use 156 weeks, which is three years. Shorter windows react faster and call more weeks extreme. On 13 October 2026 USD/JPY read 36 over 156 weeks and 16 over 52, so the same position was ordinary on one and crowded on the other.
Does a COT index at an extreme mean price will reverse?
No. It describes a position and has no clock. The pound's crowd sat at or near an extreme for weeks in 2026 while the pound kept falling.