
News-Induced Liquidity: Why Price Spikes Both Ways on a Release
News-Induced Liquidity is the extra orders that a scheduled release brings in at one known minute. Because the minute is known, we read the morning around it as consolidation, then an induction against the intended move, then a reversal. Forexia's shorthand: "Our only concern is the timing of this event." It is a read of when, not a forecast of which way.
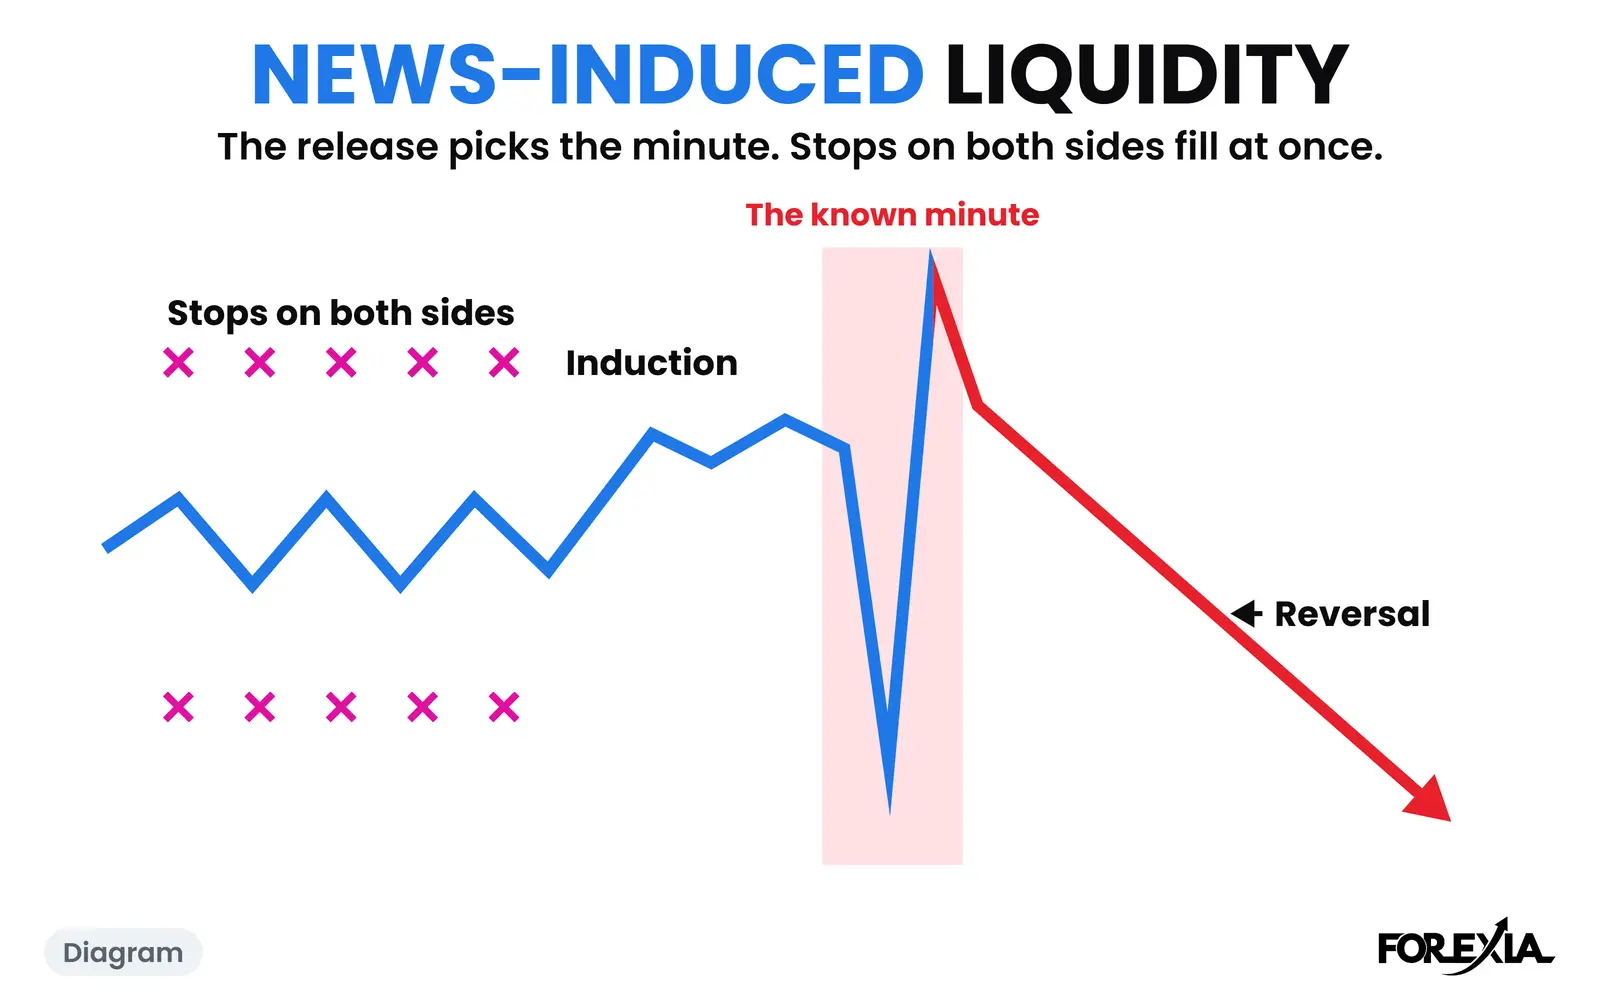
What does News-Induced Liquidity look like on a chart?
It looks like a quiet morning that ends in one candle running both ways. On GBP/USD on Wednesday 12 August 2026, US inflation was on the calendar for 08:30 New York.
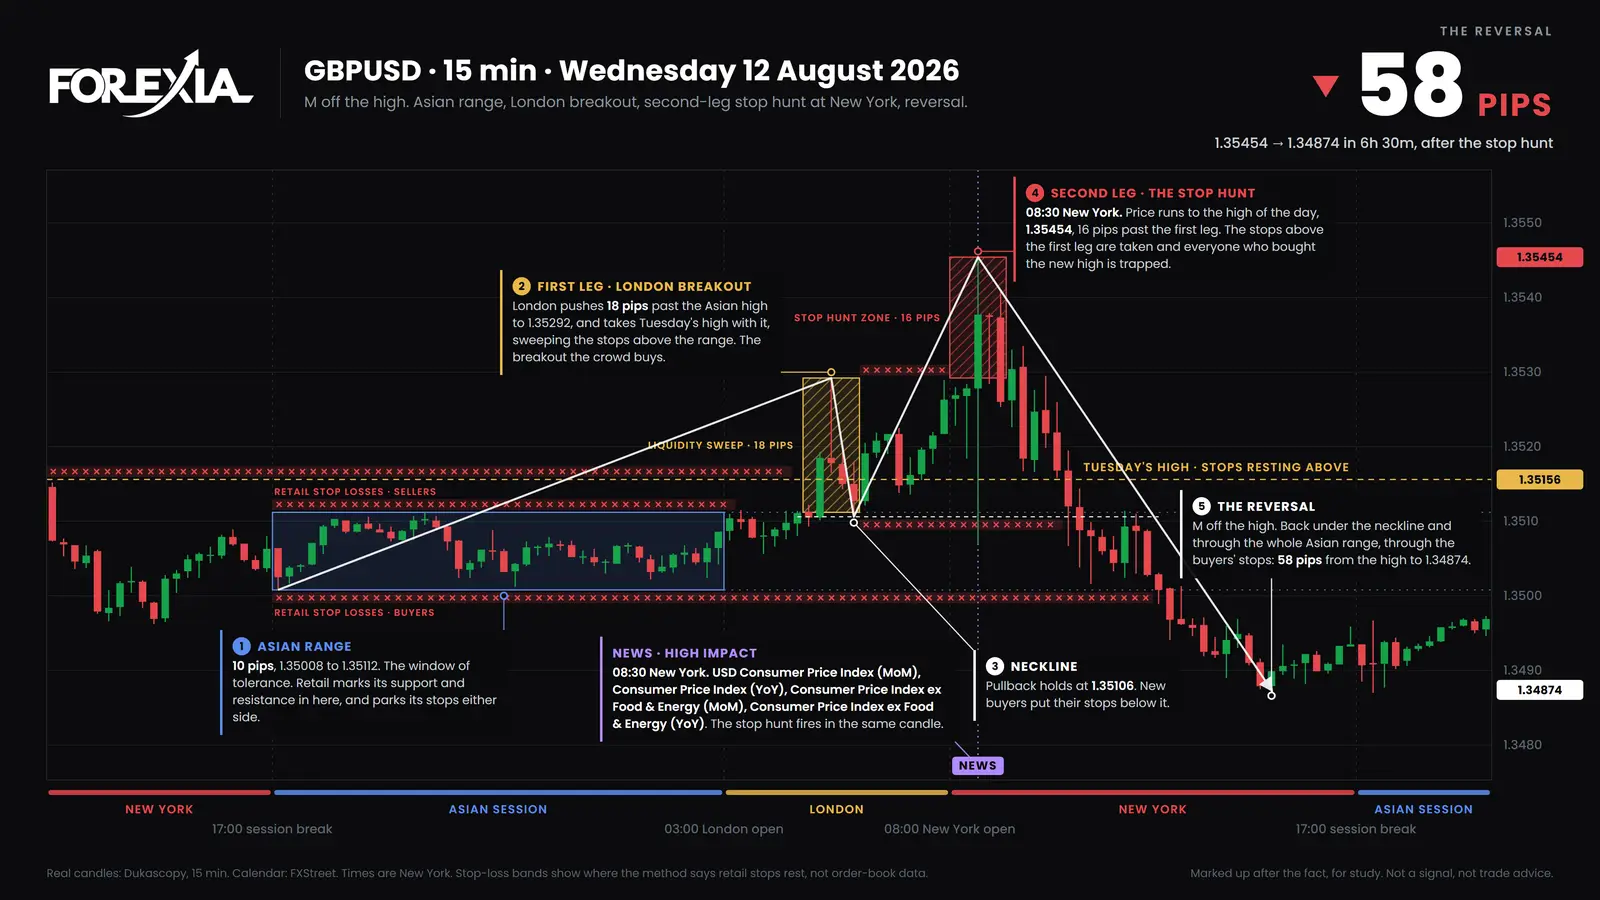
- Consolidation. The Asian Box was 10 pips, 1.35008 to 1.35112.
- The induction. London broke over it to 1.35292 at 05:15, 18 pips over the box and through Tuesday's high of 1.35156. That is the breakout the crowd buys.
- The minute. The 08:30 candle opened at 1.35278, ran to 1.35070 and to 1.35454, and closed at 1.35377. Both ends printed inside its first minute: 21 pips under the open and 18 over it. Which came first, our data cannot say. The high was 16 pips past London's high, and the top of the day.
- The reversal. The 09:00 candle closed at 1.35260, 3 pips back under London's high: the Close Back. By 15:00 price was at 1.34874, 58 pips off the high and through the whole box.
The Three Seats read that minute differently. From the first seat it is a number to forecast: better, buy; worse, sell. From the market maker's seat it is a time when everyone acts at once, and every stop near price can fill in one candle. The observer leaves the number alone and reads which stops the candle took.
News-Induced Liquidity and forex news manipulation: are they the same?
No. "Forex news manipulation" says someone moved price on purpose. News-Induced Liquidity says when the orders arrive and reads what that minute is used for. So separate what can be shown from what cannot.
What can be shown: the time is published in advance, the candle ran both ways, and a triggered stop becomes a market order. Spreads also widen around the minute, which NFP spread widening takes up.
What cannot: who was behind that candle, or why. No chart shows the orders. Stops firing on both sides of thin quotes could print the same shape with nobody aiming at anything. We read market makers as using the minute, and that is our reading, not a proof. It is no claim about any broker. Forex news manipulation tests the claim itself, and the guide to news trading forex covers the release calendar and the rest.
How often does a release candle hold the high or low of the day?
Far more often than an ordinary candle, and still a minority. We counted seven majors and gold on 15-minute candles from 6 April to 1 October 2026, on the 30 mornings with a high-impact US item at 08:30 on our calendar. A candle holds when its high is the day's high or its low the day's low, session break to session break, leaving out the spread spike on the day's first candle.
- With a release: the 08:30 candle held on 43 of 240 market-days (18%).
- Without one: on 14 of 790 (under 2%).
That is about ten times as often, and still not on roughly five release market-days in six. The 43 split into 18 highs and 25 lows, so it says when to look, never which way.
The limits sit beside the figure. Thirty mornings, one feed, and eight markets that move together on one dollar, so those market-days are not independent. It counts candles, not trades. A reversal seen afterwards is not a setup, and our own test of the setup as a mechanical rule did not make money.
How do you spot News-Induced Liquidity?
On 12 August the minute was on the calendar and the morning had done its building: a 10-pip box, then London's move to 1.35292 with the crowd behind it. Set the 08:30 candle against those. It went 16 pips past London's high, and its low stopped inside the box. The 09:00 candle then closed back under London's high. None of that needs the headline.
What do traders get wrong about News-Induced Liquidity?
Three things cost the crowd most that day.
- Trading the number. Inside one minute on 12 August the pound went 21 pips under its open and 18 over it. Both sides were run.
- Buying the green close. The candle closed at 1.35377, over London's high. By 15:00 price was 50 pips under that close.
- Expecting every release to do this. Most release candles hold neither end. Why price spikes, then reverses after news looks at the days it did and did not, and should you trade the news is a separate question.
Which words does News-Induced Liquidity lead into?
Five sit next to it.
- On NFP: the same read on the jobs report. On CPI and On FOMC do the same for inflation and the Fed.
- Second Leg Climax: the volatile second leg that hunts the high or low of the day and confirms the M or W.
- The Reversal Candle: one huge candle through the stops, straight after the crowd gets in.
- The Chaos Pattern: the daily cycle. Asia sets the scene, London breaks it, New York reverses it.
- The Close Back: the spike that closes back inside the level. The sweep has happened.
Where is News-Induced Liquidity taught?
Course 2 of ForexiaPRO, The Chaos Pattern, teaches this read step by step in lesson 2.3.1, Only the Timing Matters.
Related words
- On NFP: Reading the Jobs Report Candle, Not the Number
- Second Leg Climax: the Second Leg Reversal Pattern Behind the M and W
- The Reversal Candle: One Huge Candle Through the Stops, Not a Signal
- The Chaos Pattern: The Daily Cycle Behind Every Asian Session Strategy
- The Close Back: How a Liquidity Sweep Is Confirmed, Candle by Candle
Frequently asked questions
Why does price spike both ways on a news release?
We read it as the minute when orders on both sides arrive together. Everyone knows the time, stops rest on both sides of price, and a triggered stop becomes a market order. On GBP/USD on 12 August 2026, on US CPI, one minute ran 21 pips under its open and 18 over it. Who was behind either end, no chart can show.
Is forex news manipulated?
Separate what can be shown from what cannot. Release times are published, candles do run both ways, and in our count the 08:30 candle held the day's high or low on 43 of 240 release market-days against 14 of 790 without a release. That shows the minute matters. It does not show anyone aimed that candle at anyone, and our view that market makers use the minute is a reading, not a proof.
Does the news decide which way price goes?
Our read is that a release decides when, not which way. Of the 43 release candles in our count that held an end of the day, 18 held the high and 25 the low. On 12 August 2026 the pound's release candle closed green and its high was the top of the day, 58 pips over where price stood by the afternoon.
Does every release candle mark the turn?
No. On about five release market-days in six the 08:30 candle held neither the high nor the low of the day. It is a count of candles over 30 mornings on one feed, not a strategy, and Forexia's own test of the setup as a mechanical rule did not make money.