Why Does Price Spike, Then Reverse, After a News Release?
Dylan Forexia8 min read
Price spikes and then reverses after news because a scheduled release brings orders in at one known minute. The candle runs to the nearest stops, those stops fire once, and nothing is left to push it. That is our read, and the release sets the minute, not the direction. Often price does not reverse at all, as one day below shows.
Our word for the orders that minute brings in is News-Induced Liquidity. This page takes the question on four real days: one where the release did London's job, one where it ran both ways, one with no release at all, and one where the spike stayed. All times are New York, and a candle is named by the time it opens.
Why does price spike, then reverse, after news?
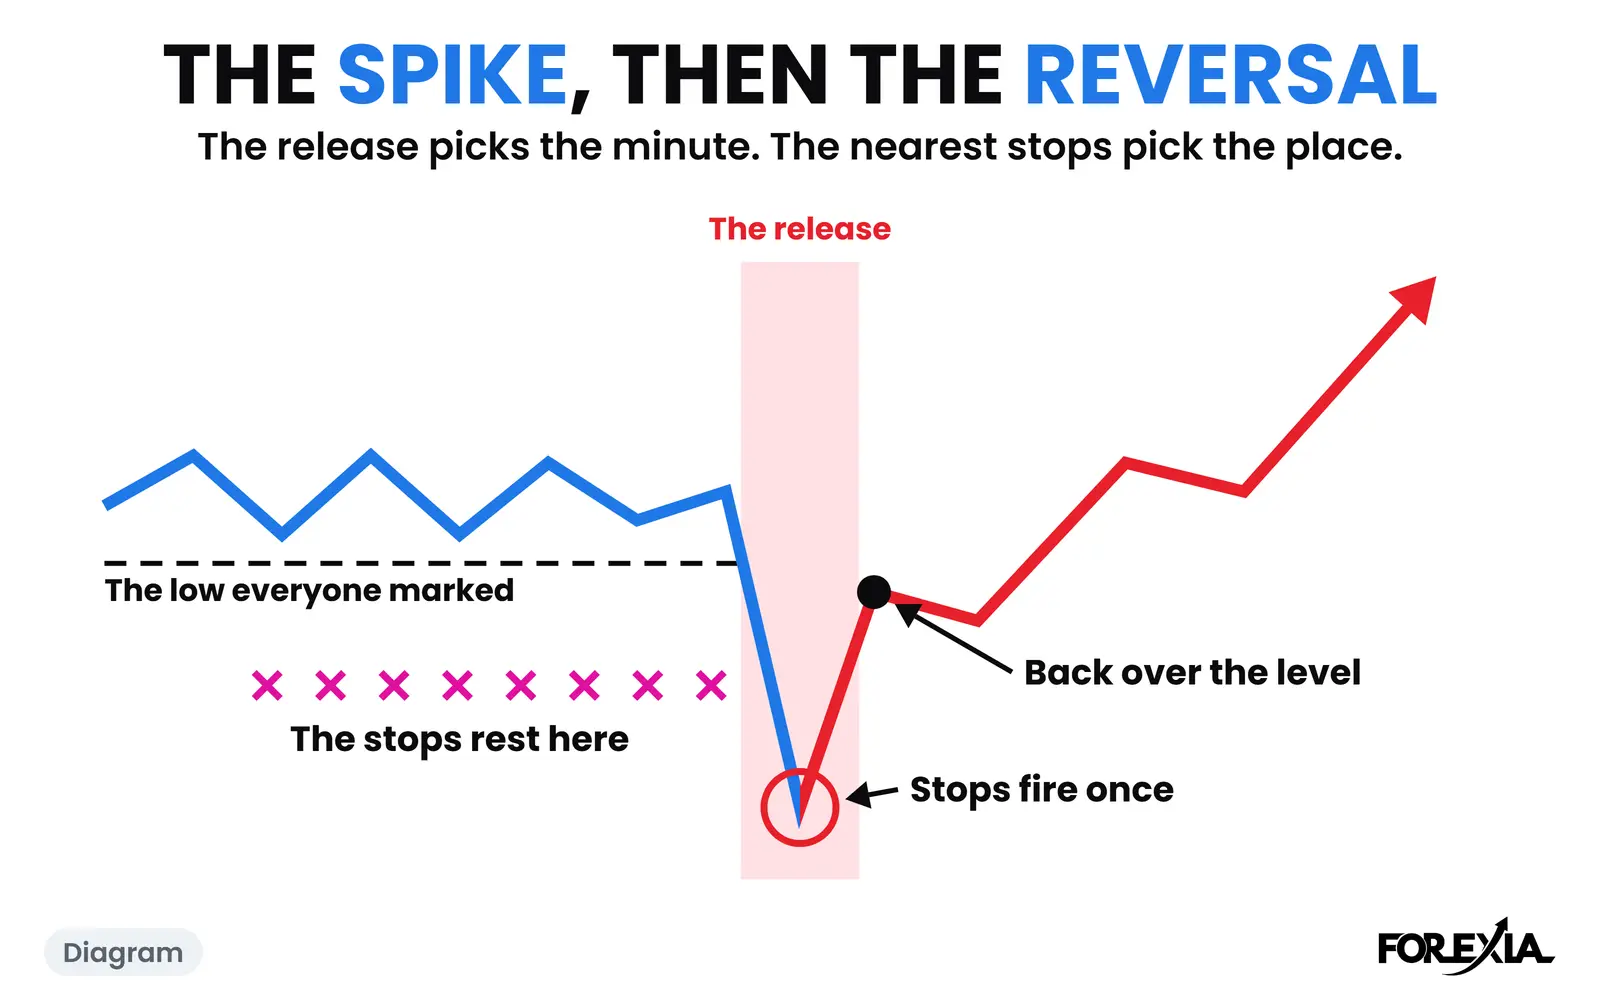
Three things stack up in that minute. Everyone knows the time, so everyone acts together. Stops rest on both sides of price, and each one becomes a market order when it fires. And the quotes around the minute are thin, on our reading, so a smaller order travels further.
The spike is that chain running. The reversal is what comes when the chain runs out. A stop can only fire once, so when the ones nearest price have gone, the orders that drove the last few pips have gone with them. Anyone who chased the spike now holds a losing trade, with a stop of their own on the other side.
Page one offers other explanations, and they deserve a hearing. The market overreacts and corrects. Traders read the headline first and the details a minute later. Those fit the same candles, and nobody outside can separate them, because spot forex has no public order book. What we can do is show what the candle went through, and when.
A release that did London's job: USD/CAD, 30 September 2026
USD/CAD's Asian range was 25 pips, 1.41747 to 1.41996. Drawn on the chart, that is the Asian Box. London never left it: its whole session ran from 1.41753 to 1.41897. So by New York the morning had no break, no crowd committed, and two sets of stops untouched below, under the box and under Tuesday's low at 1.41602. That low is a wick on Tuesday's first candle after the session break, where the spread can widen, so the second set is the less certain.
Core PCE prices and final GDP were on the calendar for 08:30 New York. The candle opened at 1.41809. Its first minute went through the bottom of the box to 1.41688. Three minutes later, at 08:33, it printed 1.41541, 21 pips under the box and 6 through Tuesday's low. That was the low of the day, and it took four minutes, not one.
The candle closed at 1.41616, still 13 pips under the box. Seen at that moment, this was a clean breakdown on the news. The next candle closed at 1.41753, back inside the box by under a pip. The 11:30 candle closed over the top of the box, and at 15:45 price reached 1.42367, 83 pips off the low. In our words the first candle was the stop hunt, a liquidity sweep of both sets of stops, and the next one was the Close Back.
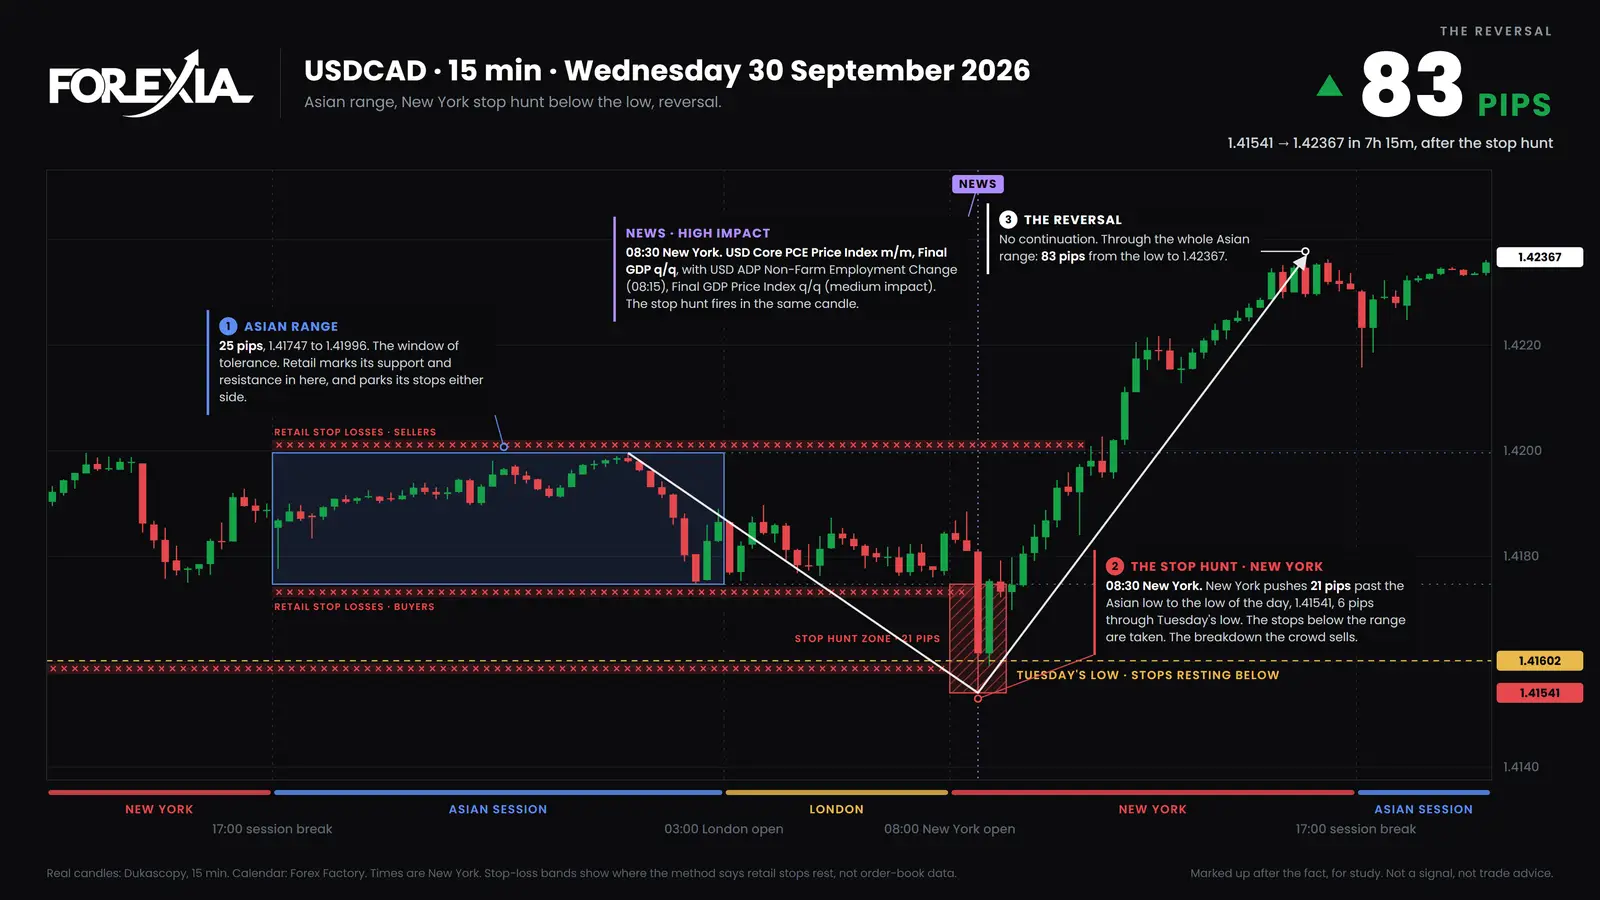
With London quiet, the release did London's usual work in one candle. In the Chaos Pattern London makes the break and New York turns it. This morning shows why we do not treat that order as fixed.
The first minute can lie twice: GBP/USD, 12 August 2026
The pound's CPI morning is on our News-Induced Liquidity page, with the box, London's move and the candle's two ends. Look here at something that page leaves out: where the first minute finished.
The 08:30 minute opened at 1.35278, printed both 1.35454 and 1.35070, and closed at 1.35115. So a trader glancing at the end of that minute saw a red candle, 16 pips under its open and near its low. By 08:34 price was back at 1.35306, and the 15-minute candle closed green at 1.35377. By then the same screen said buy. The 09:00 candle closed 3 pips under London's high, and at 15:00 price stood at 1.34874, 58 pips under the top of the day.
That is three different answers from one release inside 45 minutes, and none of them needed anyone to read the number. US CPI has its own read on the inflation minute, and when one candle does all the damage at once we call it the Reversal Candle.
Can price spike and reverse with no news?
Yes, so the shape does not need news. USD/CHF on Friday 18 September 2026 had no high-impact release for either currency. The items nearest the morning's high were a Fed speech at 03:30 and industrial production at 09:15, both medium impact.
The box was 27 pips, 0.82254 to 0.82521. London pushed 3 pips over it to 0.82549 at 06:45, the breakout the crowd buys, and pulled back to 0.82464. New York's second candle, at 08:15, reached 0.82596, 5 pips past that first high. It was the high of the day. The 08:45 candle closed back inside the box at 0.82481, and by 16:00 price had reached 0.82157, 44 pips lower and through the whole box.
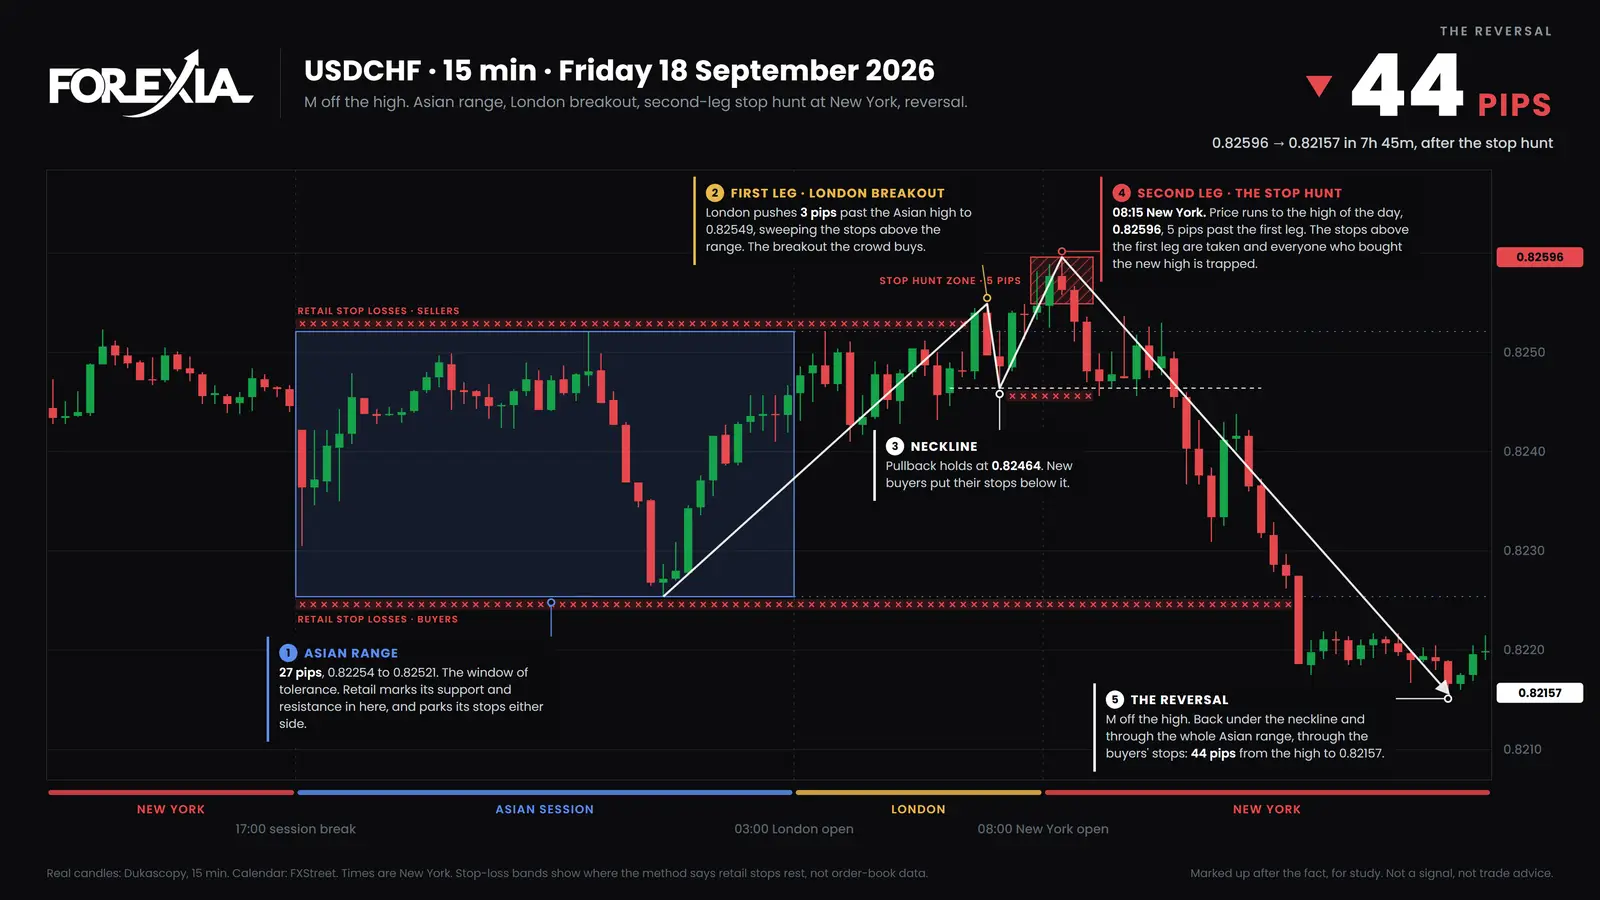
Same order, with the New York open choosing the time. Most mornings have no high-impact release at 08:30, and the day still turns on some of them. A release moves the turn onto a known minute. It does not create the need for one.
When the spike does not reverse: USD/CAD, 7 August 2026
Same pair as 30 September, on a Friday this time, and the opposite result. The US jobs report and Canada's employment figures both landed at 08:30, so this was news for both sides of the pair. The box was 21 pips, 1.40066 to 1.40278, and Thursday's low sat under it at 1.39901.
The candle opened at 1.40012 and fell to 1.39462, 55 pips from end to end and 44 through Thursday's low. It closed at 1.39562, which looks just like USD/CAD's candle of 30 September. But the next candle did not close back. Nothing did. The highest price for the rest of the day was 1.39584, still 32 pips under Thursday's low, and the low came at 11:15, at 1.39252, 21 pips under the release candle's own low.
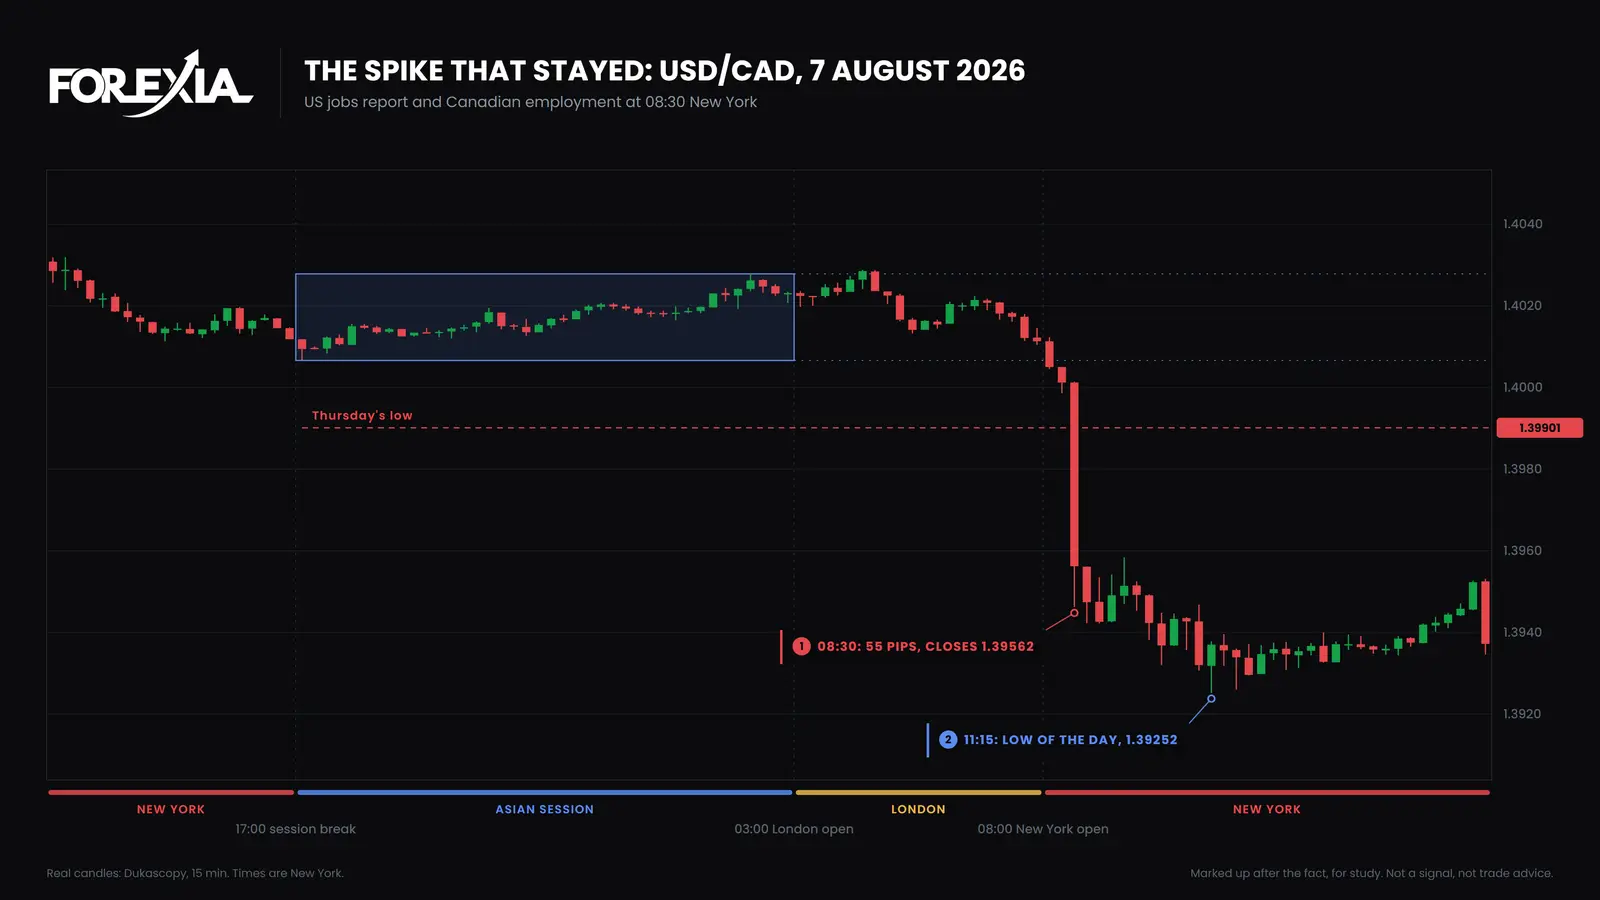
Anyone who sold that break was right. The two candles looked alike when they closed. Only what came next told them apart, and that is why "the spike always reverses" is wrong in the same way as "the spike is the direction".
How often does a release candle mark the turn? We counted seven majors and gold on 15-minute candles from 6 April to 1 October 2026, on the 30 mornings with a high-impact US item at 08:30. A candle holds when its high is the day's high or its low the day's low, session break to session break. It held on 43 of 240 market-days, against 14 of 790 on days with no such item. So it holds far more often than a quiet candle, and still on only about one release market-day in six. Those are eight markets moving on one dollar, over one feed, and it counts candles, not trades. It also counts the candle holding an end of the day, which is not the same as every first move reversing. The guide to news trading forex has the full table by release.
What did each seat see?
The Three Seats read the same morning three ways.
- Retail saw a forecast. Better number, buy. Worse number, sell. On 30 September that seat sold the 15-minute close at 1.41616, 13 pips under the box.
- The market maker, as we read it, saw a minute. Everyone acts at once, and every stop near price can fill in one candle. Who was actually behind that candle no chart can show.
- The observer saw the order of events. Which level went, how far past it, and whether a candle closed back. On 30 September the answer came 15 minutes later. On 7 August it never came.
Whether any of this amounts to someone moving price on purpose is a separate question, and forex news manipulation takes it on with the count. What one huge candle does to the trader on the wrong side of it is in the trap candle.
Common mistakes
Four readings went wrong on these days.
- Acting on the pound's first minute. Price went 21 pips under its open and 18 over it inside sixty seconds, and both sides were run.
- Selling USD/CAD's close on 30 September. It sat 13 pips under the box, was back inside one candle later, and price reached 83 pips off the low.
- Fading USD/CAD's close on 7 August. It closed 34 pips through the level and stayed through it. Trading against the spike is a plan with its own record: our own fixed rule of fading hunts on a high-impact release lost money after costs, and the news trading guide gives the figures and the limits.
- Calling USD/CHF on 18 September a quiet day. Nothing high-impact was on the calendar for either currency, and it still made a 44-pip move.
These days were picked afterwards to show the shape, so they flatter it. A reversal seen afterwards is not a setup.
Course 2 of ForexiaPRO, The Chaos Pattern, teaches this read step by step in lesson 2.3.1, Only the Timing Matters.
Frequently asked questions
Why does price spike and then reverse after news?
Our read is that a known minute brings orders in together, the candle runs to the nearest stops, and once those have fired nothing is left to push it. Thin quotes and traders rereading the number could print the same shape. On USD/CAD on 30 September 2026 the release candle ran 21 pips under the Asian range, and price then rose 83 pips.
Does price always reverse after a news spike?
No. On USD/CAD on 7 August 2026 the jobs candle ran 55 pips, closed 34 pips through Thursday's low and no candle closed back above that low all day. On our count the 08:30 candle held the day's high or low on 43 of 240 release market-days, so most release candles sit somewhere inside the day.
Can price spike and reverse with no news at all?
Yes. USD/CHF on 18 September 2026 had no high-impact release for either currency. London went 3 pips over the Asian range, a second leg made the high of the day at 08:15 New York, and price fell 44 pips by 16:00. A release chooses the minute. The shape does not depend on one.
Should you fade a news spike?
We cannot show that it pays. Our own fixed rule of trading against hunts printed on a high-impact release lost money after costs. That is one rule and says nothing about a person reading the chart, but a reversal seen afterwards is not a setup, and these days were picked afterwards.