
The Reversal Candle: One Huge Candle Through the Stops, Not a Signal
The Reversal Candle is one huge candle through the stops, straight after the crowd gets in. Most guides use "reversal candle" for a small signal such as a pin bar, a doji or an engulfing candle, something to act on after it prints. Ours is the candle that already did the damage, read from the wrong side of it. The turn, when it comes, comes around it.
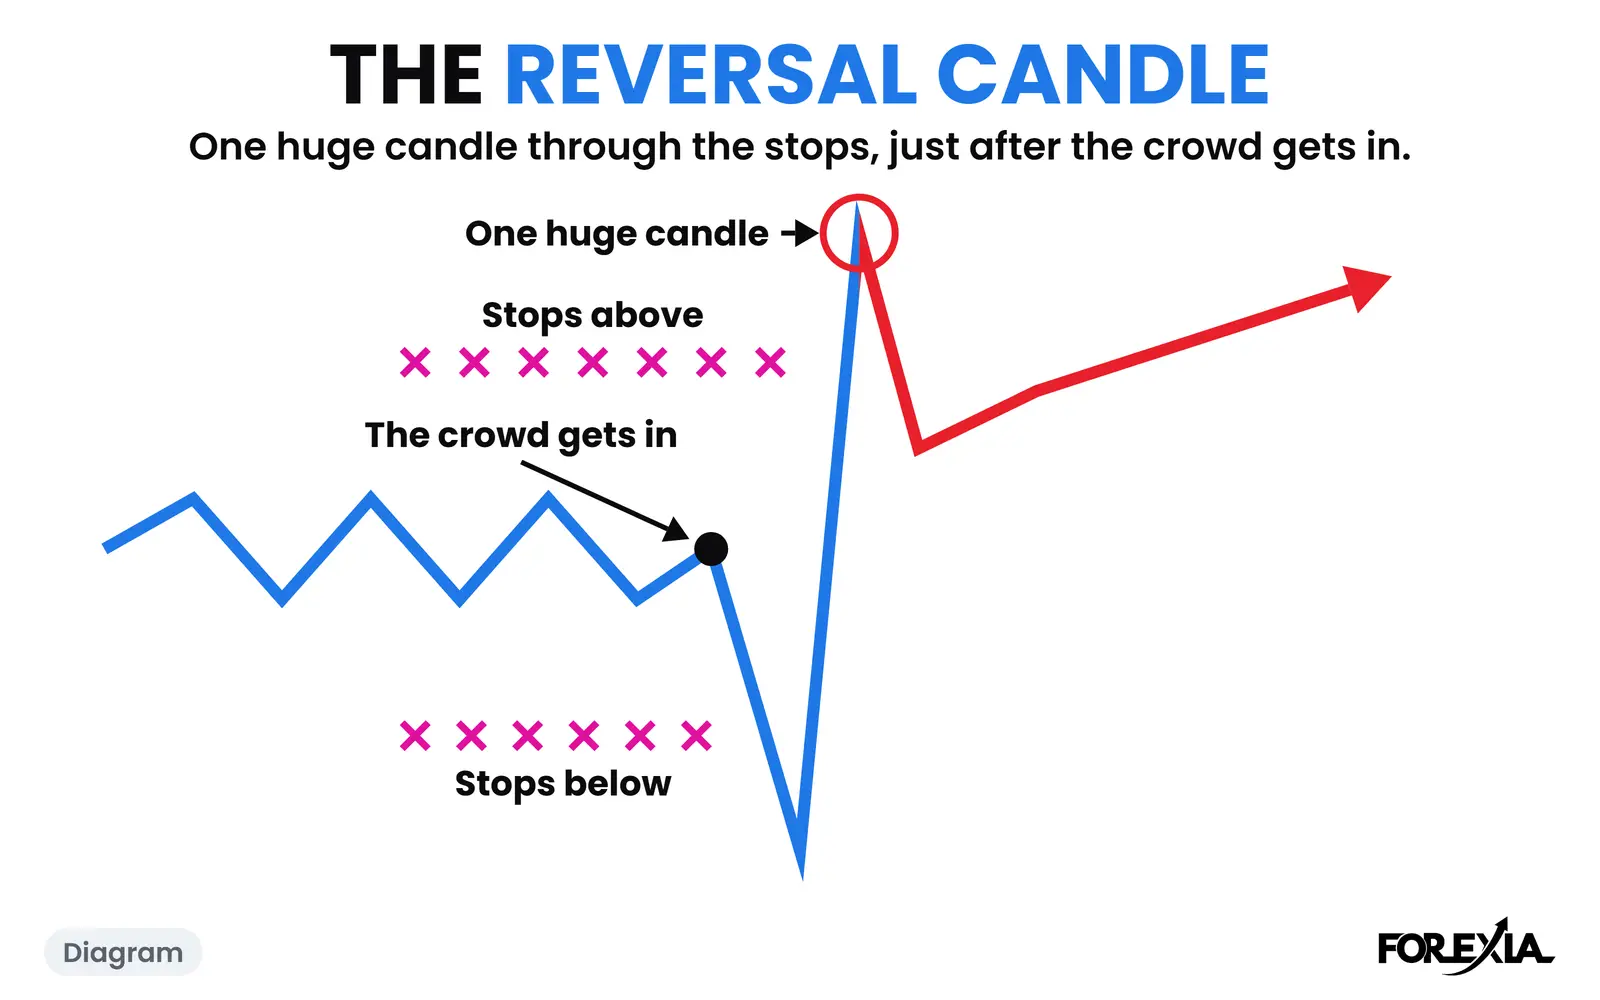
What does the Reversal Candle look like on a chart?
It looks like nothing, and then like everything at once. On gold on Friday 11 September 2026, the Asian Box ran from 4300.49 to 4360.85. It was wide and slanted, so look at the candle and not the box. London stayed inside it and drifted lower from its high of 4357.27. US CPI was due at 08:30 New York. On gold $1 counts as 1 pip.
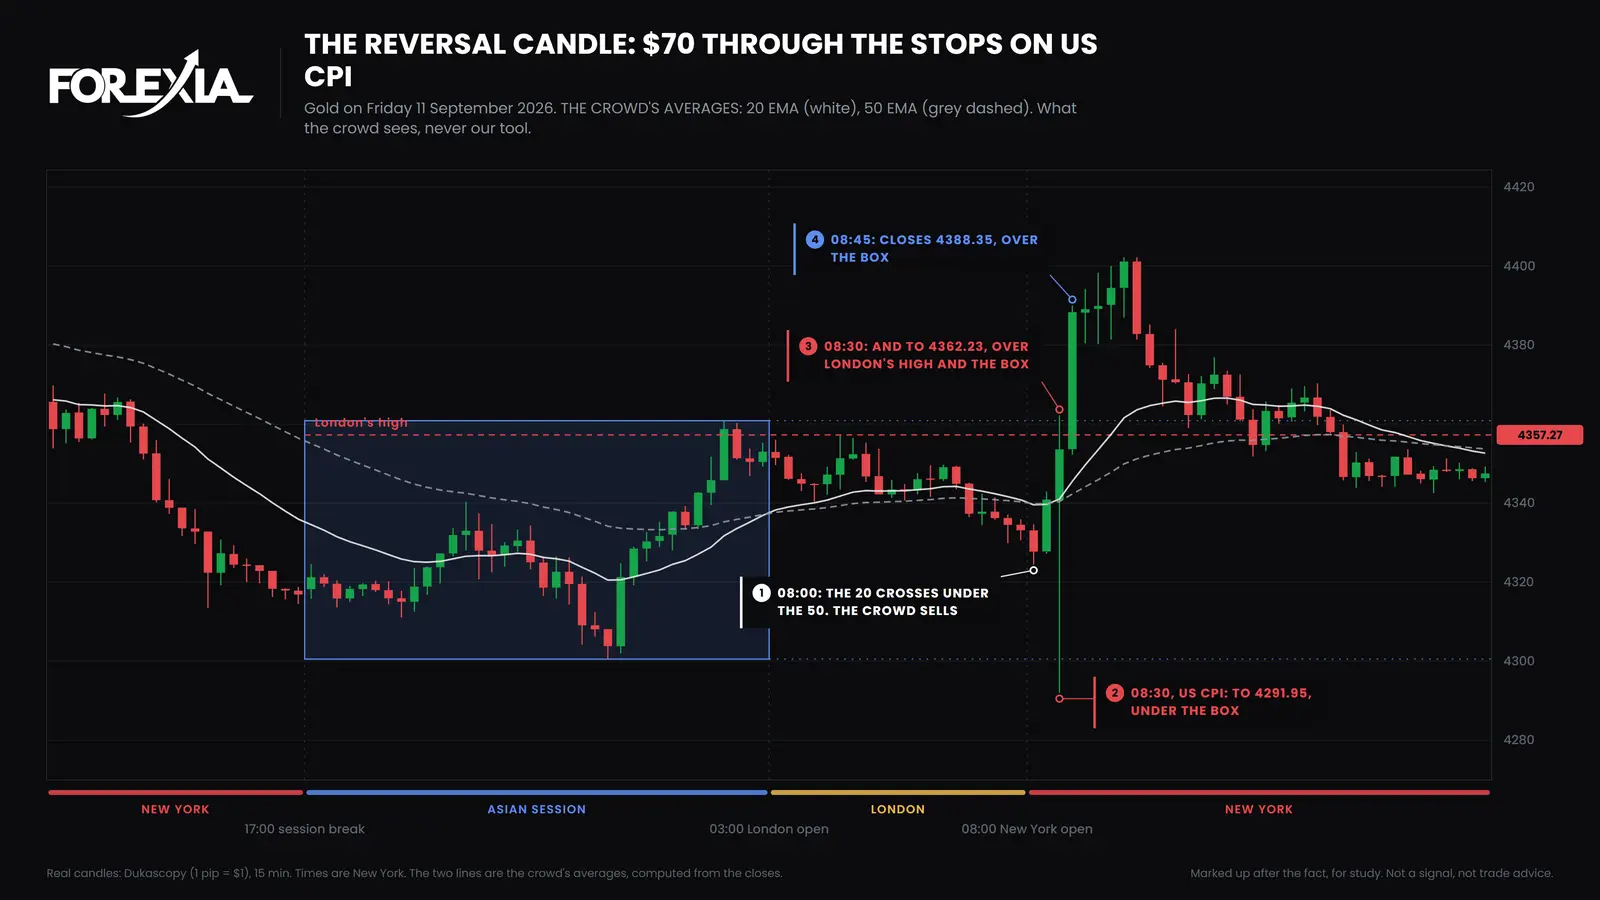
- The crowd gets in, 08:00. The 08:00 candle closes red at 4327.70. The lines on this chart are labelled THE CROWD'S AVERAGES, 20 EMA and 50 EMA, because that is what they are: what the crowd sees, drawn to show where it gets in. The 20 crosses under the 50, and the screen says sell.
- Their stops. We read them over London's high at 4357.27 and over the box top at 4360.85.
- The candle, 08:30. It opens at 4340.86, trades down to 4291.95 and up to 4362.23, and closes at 4353.61. That is $70 end to end, about ten times the average London candle. The low is $9 under the box. The high is $5 over London's high and $1 over the box top: both levels, inside one candle. The averages cross back up on it. We draw them to see this, then take them off. Dukascopy's one-minute candles put the low in its first minute and the first trade over London's high at 08:40.
- After. The next candle closes at 4388.35, $27.50 over the box. By 09:45 price is at 4402.27, $110 off the low. Then it comes back, to 4342.53 by 15:45.
For the crowd that sold at 08:00, this was the candle that took the stop, ten minutes after the release. For the day, it was the Stop Hunt, a liquidity sweep of both sides, and its low held as the low of the day.
The Reversal Candle and a reversal candle: what is the difference?
The search phrase and our word share a name and little else. A reversal candle in a price action guide is a pattern. Ours is an event.
| Reversal candle in the guides | The Reversal Candle | |
|---|---|---|
| What it is | A shape: pin bar, doji, engulfing | One huge candle through the stops |
| Size | Any | Far bigger than the candles before it |
| What comes before it | A trend | The crowd getting in |
| Who it is read for | The trader about to enter | The trader it just stopped |
The day above shows why the shape is not the point. By shape, that 08:30 candle is a pin bar: a long lower wick and a small body near the top. A guide would call it a signal to buy. A trader who sold at 08:00 with a stop over London's high had already been stopped by the time it closed. Pin bar vs engulfing covers the shapes, and trap candle forex stays with the candle on the news. The stop hunt guide shows the wider picture.
How do you spot the Reversal Candle?
You can name it only once it has printed. What you can see first, on 11 September, is the setting: London's candles about $7 each, the crowd's averages crossing down at 08:00, and US CPI on the calendar for 08:30. News-Induced Liquidity is why the minute matters. We counted seven majors and gold on 15-minute candles from 6 April to 1 October 2026, and asked whether the 08:30 New York candle held the day's high or low. It did on 43 of 240 market-days with a high-impact US release at that minute, and on 14 of 790 without one. That is a small sample of releases, and all eight markets move on the same dollar. It says when to look, never which way.
What do traders get wrong about the Reversal Candle?
Three things cost the crowd most that day.
- Selling the 08:00 cross. The averages turned down two candles before US CPI, and the first minute of the release went the sellers' way. By 08:40 price was over London's high.
- Trusting the box. London stayed inside it all morning, so a stop over London's high looked safe. It went at 08:40, and the box top with it.
- Taking its shape for a signal. Its shape said buy, and price did run $110 off the low before coming $60 back. A reversal seen afterwards is not a setup, and our own test of the setup as a mechanical rule did not make money.
Which words does the Reversal Candle lead into?
Four sit next to it.
- The Stop Hunt: price driven into clustered stops to fill the other side.
- News-Induced Liquidity: the extra orders a scheduled release brings in at an exact minute.
- The Close Back: the spike that closes back inside the level. The sweep has happened.
- The 90-90-90 Rule: the industry has a saying that ninety percent of traders lose ninety percent of their money within ninety days. It is a saying, not our finding.
Where is the Reversal Candle taught?
Course 2 of ForexiaPRO, The Chaos Pattern, teaches this read step by step in lesson 2.3.4, The Reversal Candle.
Related words
Frequently asked questions
What is a reversal candle?
In most guides it is a candle or small group of candles that hints price may turn: a pin bar, a doji, an engulfing candle. In Forexia's words, the Reversal Candle is one huge candle through the stops, straight after the crowd gets in. The first is a signal to act on. The second is what took the stop.
Is the Reversal Candle the same as a pin bar?
No. A pin bar is a shape with a long wick and a small body, and it can be any size. The Reversal Candle is defined by what it does and when: it is far bigger than the candles before it, it goes through the stops, and it comes just after the crowd gets in. One candle can be both. On gold on 11 September 2026 the Reversal Candle had a pin bar's shape, and it was $70 long.
Does the Reversal Candle mean price will reverse?
Not as a promise. On gold on 11 September 2026 the next candle closed $27.50 over the Asian Box, and by the afternoon price had come $60 back down. The candle tells you which stops went, not where the day ends. Forexia's own test of the setup as a mechanical rule did not make money.
Can you see a Reversal Candle coming?
You can see when one is more likely, not which way it goes. A scheduled release gives the minute. In our count from 6 April to 1 October 2026, the 08:30 New York candle held the day's high or low on 43 of 240 market-days with a high-impact US release at that minute, and on 14 of 790 without one. That says when to look, never which way.