
Second Leg Climax: the Second Leg Reversal Pattern Behind the M and W
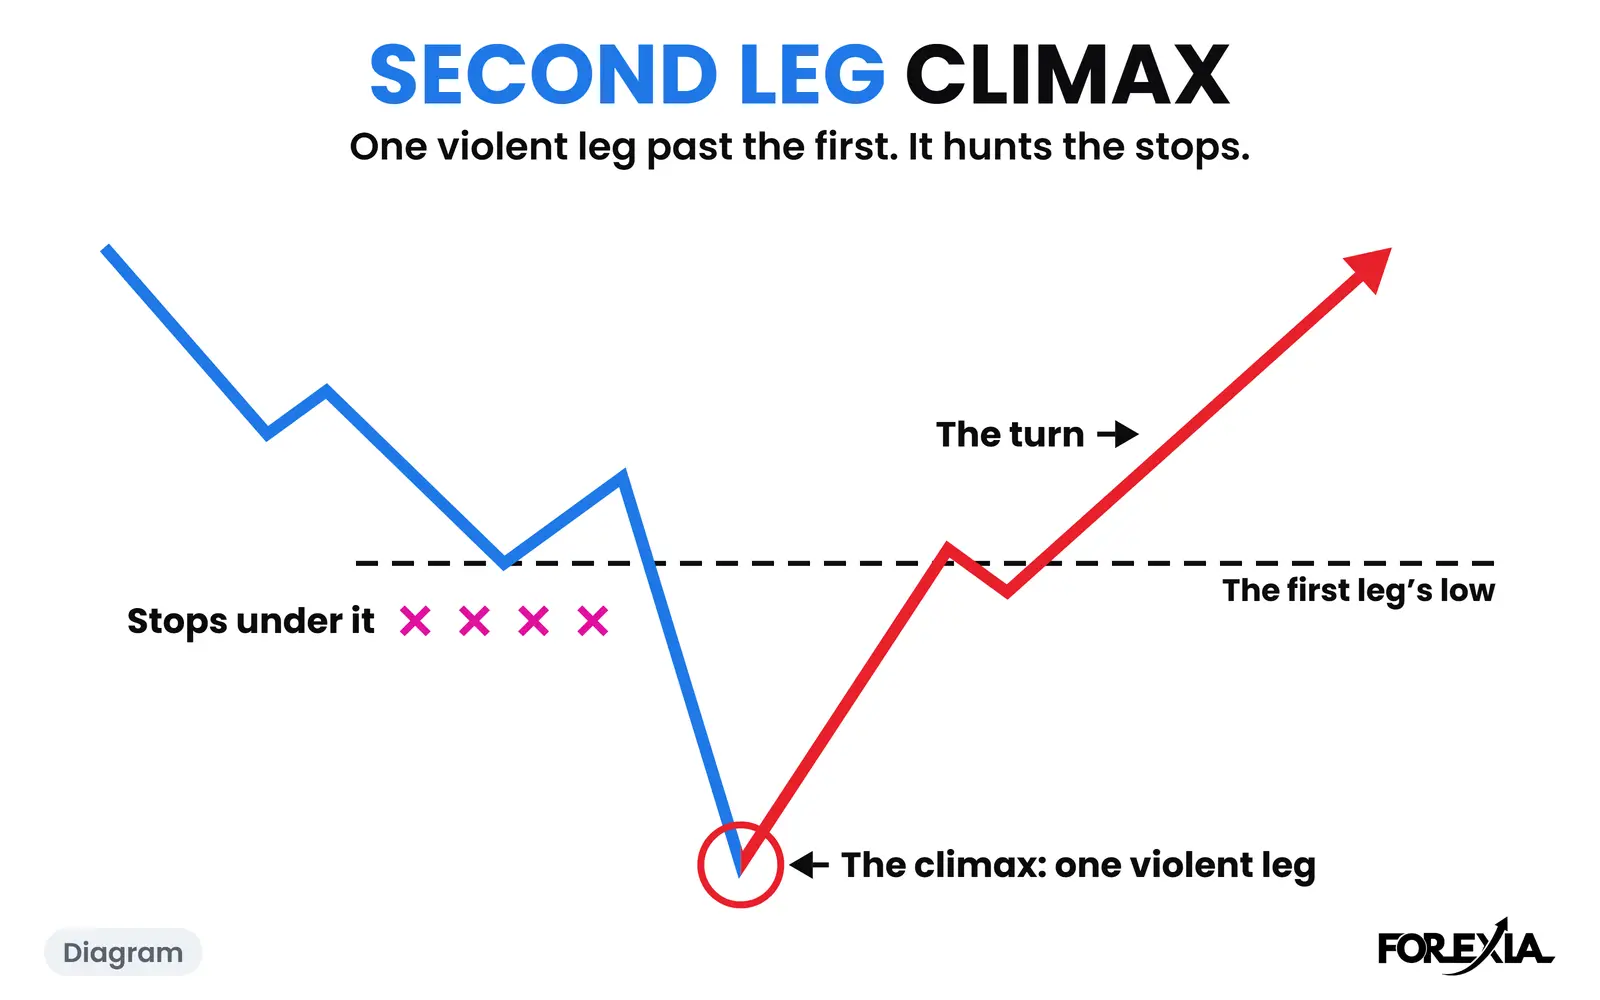
Second Leg Climax is the volatile second leg that hunts the high or low of the day and confirms the M or W. Until the second leg trades past the first, there is no M and no W, only a new high or low, and anyone who enters there is early. Most guides to a second leg reversal pattern describe something else, and this page says where the two part.
What does a Second Leg Climax look like on a chart?
It looks like the worst candle of the day, arriving when the pattern looked finished. On EUR/USD on Friday 31 July 2026, the Asian Box ran from 1.15042 to 1.15312, 27 pips. London drifted under it, and New York opened at the bottom of the slide.
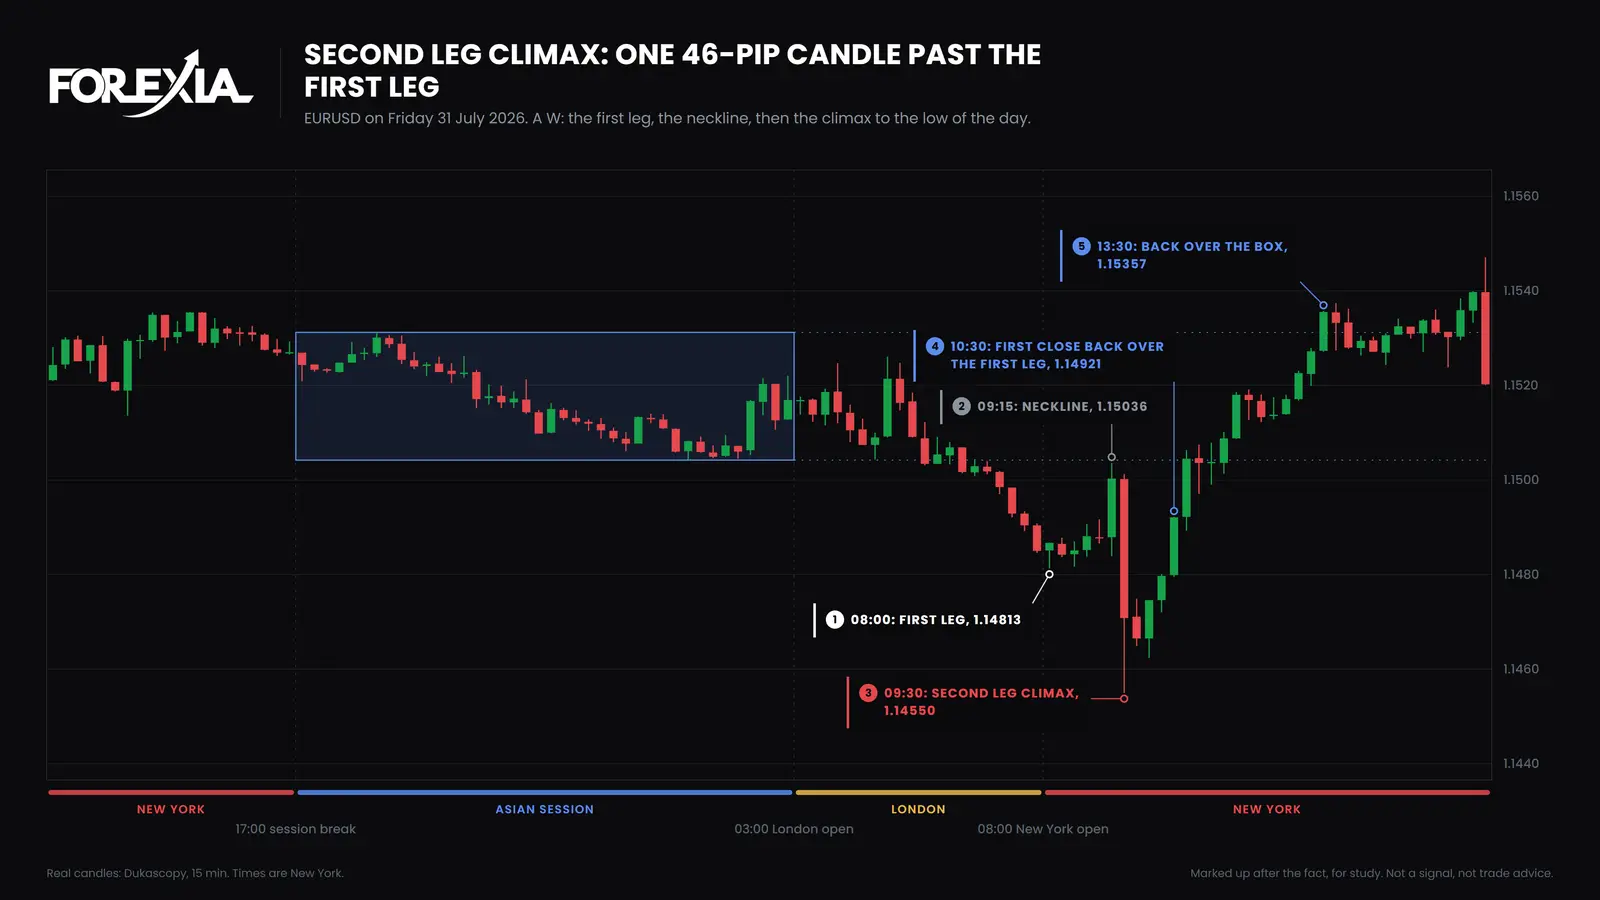
- First leg, 08:00 New York. To 1.14813, 23 pips under the box. It is the new low of the day, and the crowd sells it. Anyone buying it puts a stop just under it.
- Neckline, 09:15. A rally to 1.15036, back at the edge of the box.
- The climax, 09:30. The next candle opens at 1.15002, runs to 1.14550 and closes at 1.14708. That is 26 pips past the first leg, on a range of 46 pips, about seven times the average candle that day. No release landed on it: the calendar's next item, Chicago PMI, was at 09:45.
- After. This climax closed beyond the first leg, not back. Three more candles closed under it too. The first close back over it came an hour later, on the 10:30 candle, at 1.14921. By 13:30 price had reached 1.15357, over the box, 81 pips off the low.
The Three Seats split it this way. From the first seat, the first leg is the move, and the second is a disaster or a chance to add. From the market maker's seat, we read the first leg as the bait and the second as the Stop Hunt, a liquidity sweep of the stops past it. The observer can state how far it ran.
Second Leg Climax and the second leg reversal pattern: what is different?
The phrase covers several ideas, and ours is not the common one. In price action trading guides, the second leg usually means the second swing of a two-legged pullback: a pause inside a trend, entered after it ends. In that reading the second leg should stop short of the swing it started from, and breaking it means the pattern has failed.
Ours runs the other way. The second leg goes past the first leg's extreme, and that is what makes the M or W. "Climax" differs too. Elsewhere it usually means the exhaustion at the end of a long trend, many candles long. Ours is one leg, often one candle.
Not every second leg earns the word. On GBP/USD on 13 August 2026, shown on the M & W Reversals page, the second leg ran 3 pips past the first on a 9-pip candle: a real second leg, and no climax. What is the second leg in a reversal takes the question further.
How do you spot a Second Leg Climax?
You can see it only once it has run. On 31 July, start at the 08:00 low, a new low of the day, and the 09:15 rally that made the slide look finished. Then look at the 09:30 candle: 26 pips past that low, on about seven times the day's average range. It closed under the low too, so for an hour it looked like a real break, until the 10:30 candle closed back over it. That new low was part of the High and Low of the Day, the first pool a second leg goes after.
What do traders get wrong about the Second Leg Climax?
Three things cost the crowd most that day.
- Buying the 08:00 low. The 09:15 rally made it look right. The next candle went 26 pips through it, and a stop anywhere inside that went on one candle.
- Selling the 09:30 close. At 1.14708 it looked like the break. Within the hour a candle had closed back over the first leg, and by 13:30 price was over the box.
- Reading the size as a forecast. A big second leg does not promise a big turn. This day turned hard, and it is on this page because it did. A reversal seen afterwards is not a setup, and our own test of the setup as a mechanical rule did not make money.
Which words does Second Leg Climax lead into?
Four sit next to it.
- M & W Reversals: an M off the highs or a W off the lows, from a clear Asian range.
- High and Low of the Day: the first pool of stops a second leg hunts.
- News-Induced Liquidity: the extra orders a scheduled release brings in at an exact minute. A climax can land on one. This one did not.
- The Stop Hunt: price driven into clustered stops to fill the other side.
Where is the Second Leg Climax taught?
Course 3 of ForexiaPRO, Reverse Price Action, teaches this read step by step in lesson 3.2.2, Second Leg Climax: Why the M and W Wait for It.
Related words
Frequently asked questions
What is a second leg in trading?
It depends on who is talking. In a two-legged pullback, the second leg is a pause inside a trend that should not break the swing it started from. In Forexia's M and W, the second leg is the run past the first leg's extreme, and until it happens there is no M and no W.
What is the difference between a Second Leg Climax and the Reversal Candle?
A Second Leg Climax is a part of an M or a W: the leg that hunts past the first. The Reversal Candle is one huge candle through the stops, straight after the crowd gets in, on any structure. One candle can be both. On EUR/USD on 31 July 2026 the climax was a single 46-pip candle.
Does every M or W have a climax?
No. Every M or W has a second leg, but it can be an ordinary candle. On GBP/USD on 13 August 2026 the second leg ran 3 pips past the first on a 9-pip candle. The word climax is for the violent ones.
Does a Second Leg Climax mean price will reverse?
No. It confirms the shape, and it says nothing about how far price goes next. It is easy to name afterwards, and until a candle closes back it looks the same as a real break. Forexia's own test of the setup as a mechanical rule did not make money.