What Is the Second Leg in a Reversal? Second Leg Climax on Gold and EUR/USD
Dylan Forexia7 min read
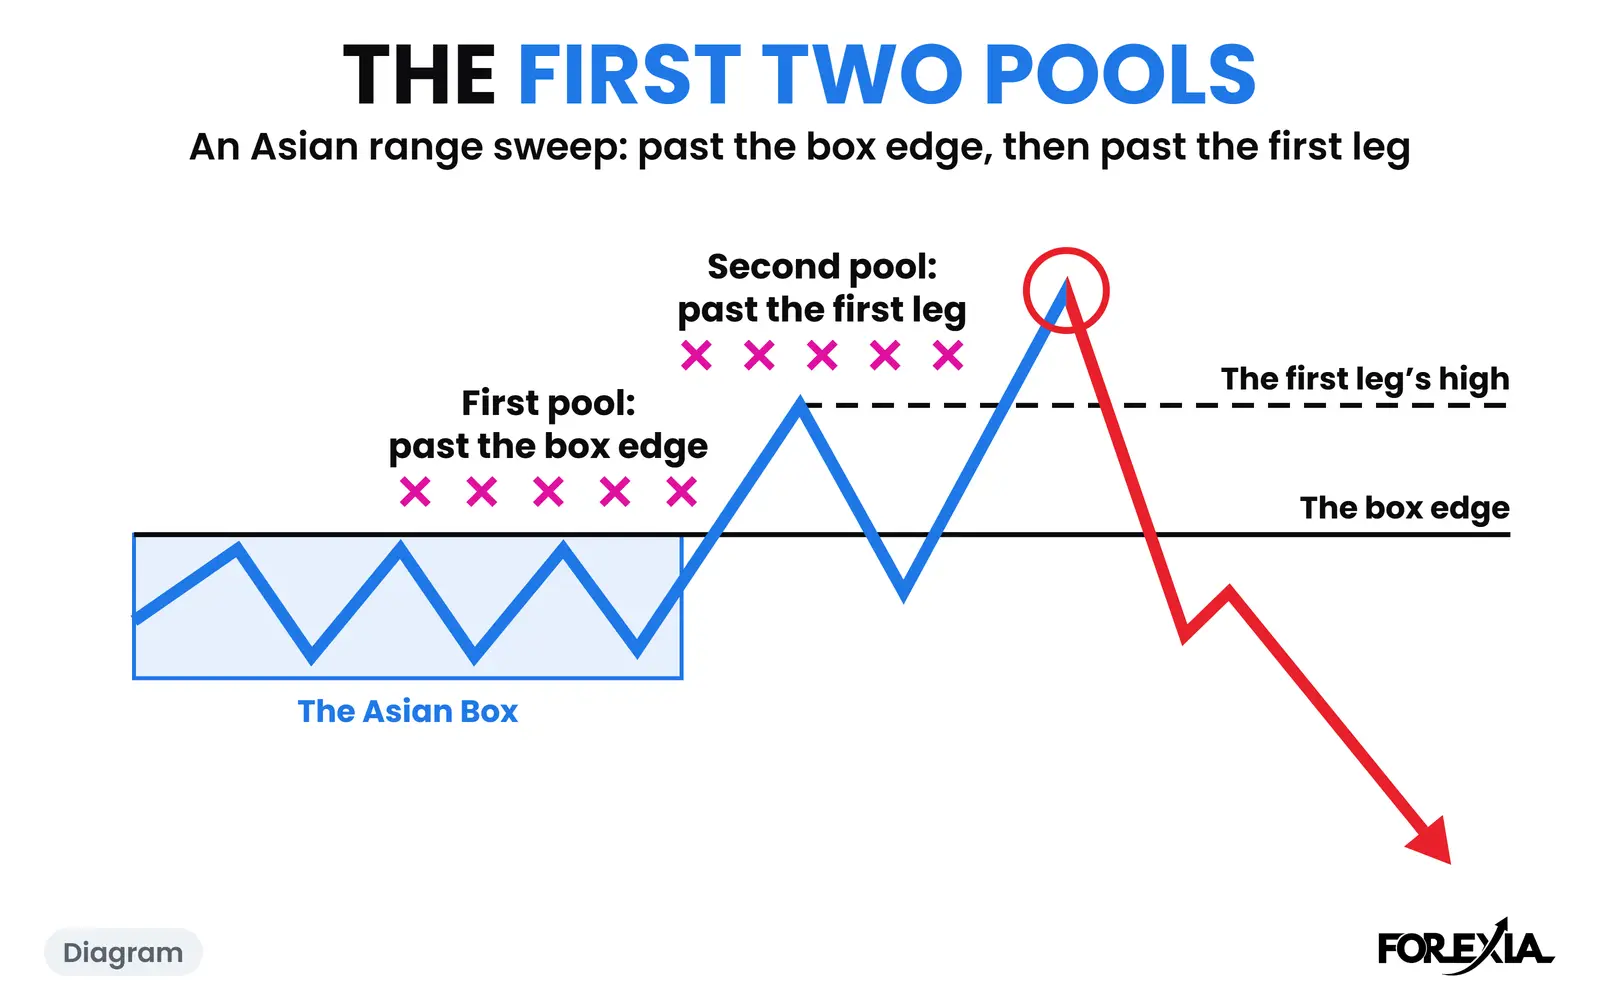
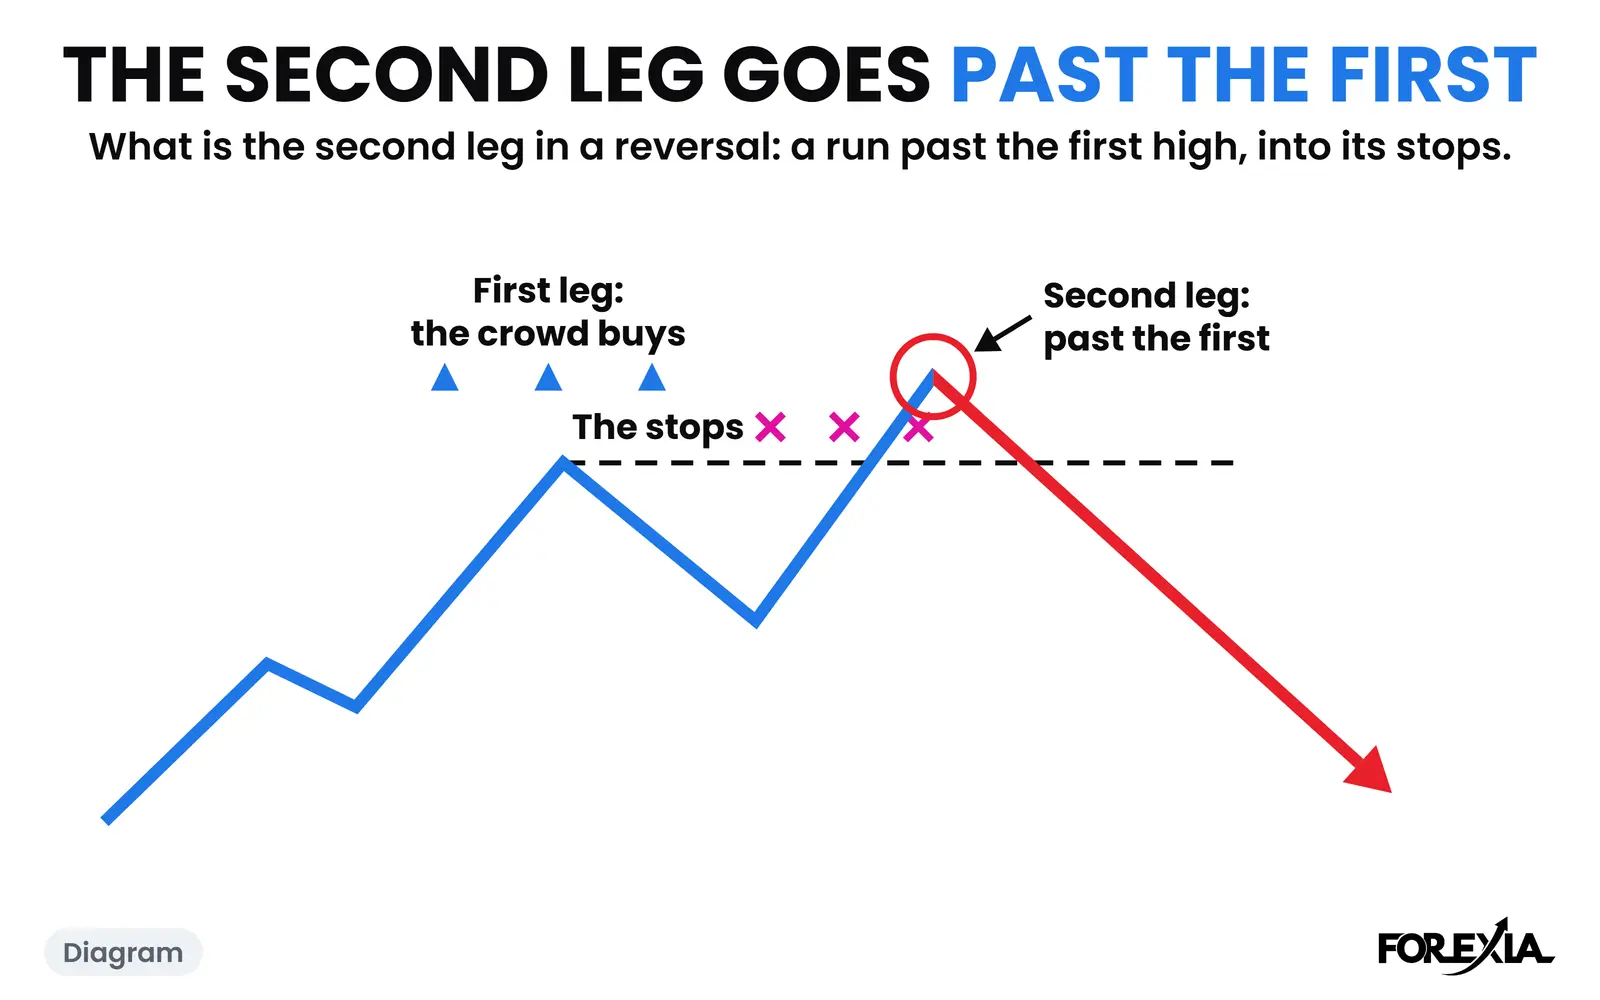
The second leg in a reversal is the second push to the extreme: in a double top or double bottom, the run past the first leg's high or low. We read the first leg as bait and the second as the hunt for the stops it left. A first leg on its own is only a new high or low.
Our word for the violent version is Second Leg Climax, and that page defines it. This one asks the wider question: what does a second leg look like across real days, how far does it run, and what does it prove? Times are New York, candles are 15-minute Dukascopy, and on gold $1 counts as 1 pip.
What is the second leg in a reversal, and why are there two meanings?
The phrase means two things, and most confusion comes from mixing them. In the books on pullbacks, the second leg is the second swing of a pause inside a trend, like the C in an ABC. It should stop short of where the trend started, and if it breaks that, the trade has failed.
Ours runs the other way. In M & W Reversals the second leg goes past the first leg's extreme, and that is what makes the shape. The first leg makes a new high or low of the day. The crowd buys that new high, and anyone who sells it puts a stop just over it. Price pulls back and the shape starts to look finished. The second leg then trades through that line.
From the first seat the first leg is the move. From the market maker's seat, as we read it, the first leg is the bait and the second is the hunt. The observer can only wait, because at the first leg nothing exists yet but a new extreme.
Can a second leg take more than one candle?
Yes, and that is where gold on Wednesday 16 September 2026 is useful. Its Asian range was a wide 66 pips, 4275.15 to 4340.72, so this is no model day. It is here for its second leg.
The first leg was 4361.34 at 11:45, 21 pips over the range. The crowd buys that. Price pulled back to 4341.39 by 13:00, and the Fed's decision was on the calendar for 14:00.
At 13:45 price ran to 4364.60, 3 pips past the first leg, and closed at 4356.30, 5 pips back under. That looks like the whole story: a hunt, a close back, done. It was not done. The Fed's candle opened at 4356.95 and traded to 4366.52, 5 pips past the first leg and 2 past that last wick. Only then did it fall, to 4307.23, closing at 4309.99. That candle was 59 pips from top to bottom, the kind we call the Reversal Candle.
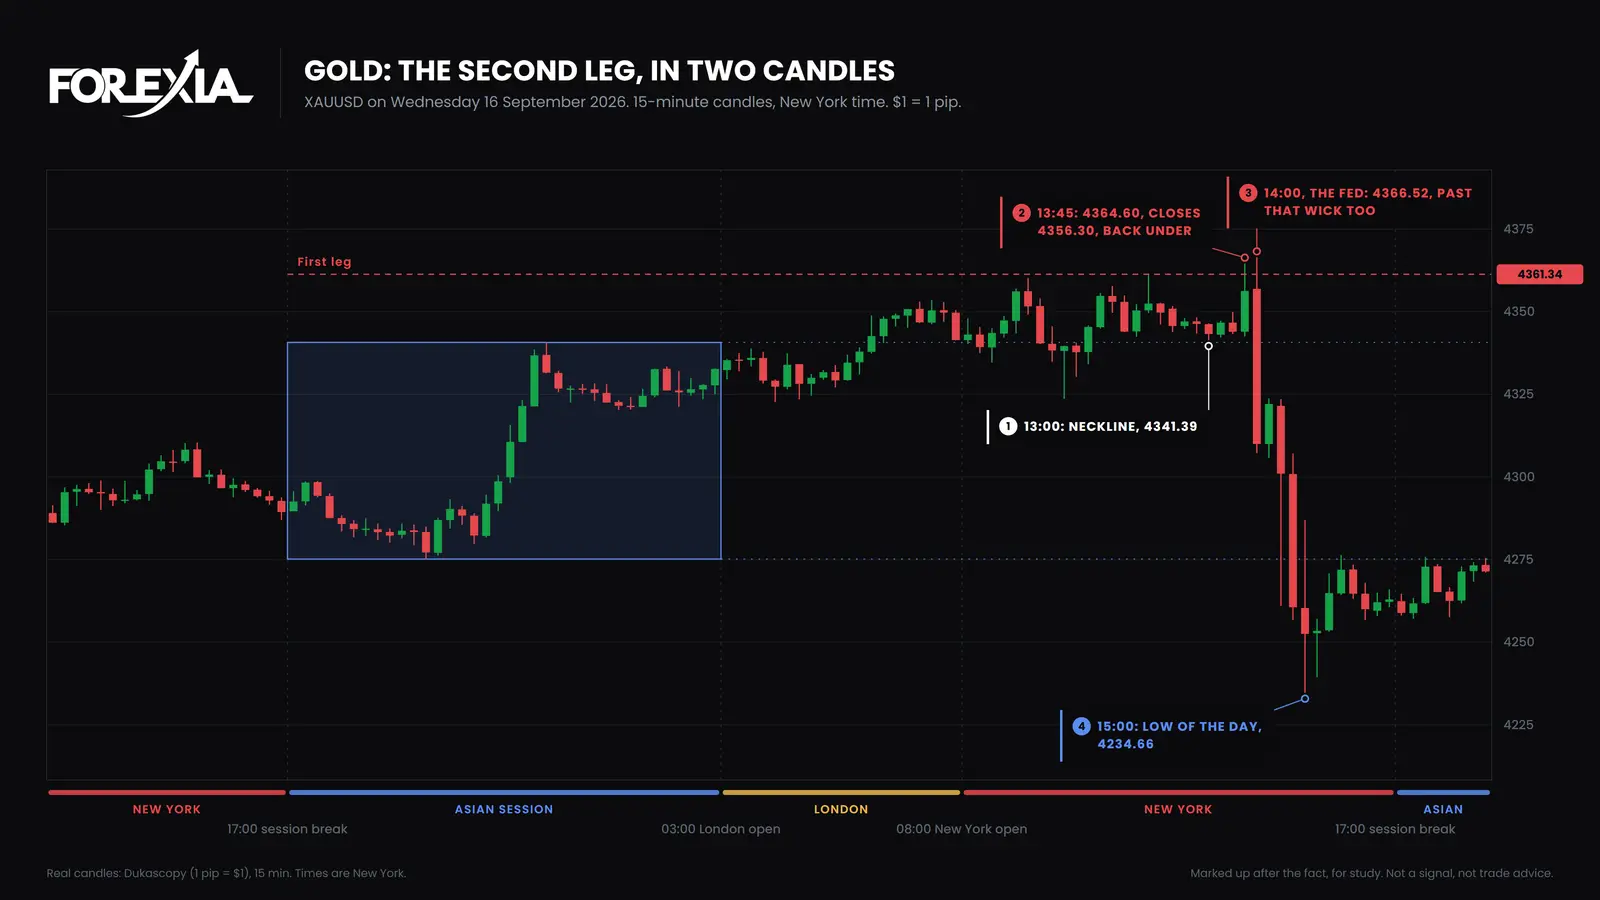
By 15:00 price was at 4234.66, 132 pips under the high. Keep the order in mind, because the chart hides it once it is over. On this day the highest price came after that close back, inside the Fed's candle. And the read knew the Fed was on the calendar. It did not know the decision.
What does a large second leg with no release look like?
It looks like gold a week earlier. On Wednesday 9 September 2026 the Asian range was 65 pips, 4340.97 to 4405.98, wide and rising all session. London's last candle made a first leg at 4414.98, 9 pips over the range. Price pulled back to 4390.60 by 08:30. The only item on the calendar for the dollar was the ADP figure at 08:15, and it was medium-impact.
Then came the second leg, over two candles. The 09:15 candle ran to 4430.13 and the 09:30 candle to 4433.78, 19 pips past the first leg. That is a climax in anyone's language. The 09:45 candle closed at 4414.61, a shade under the first leg, and the next two closed back over it.
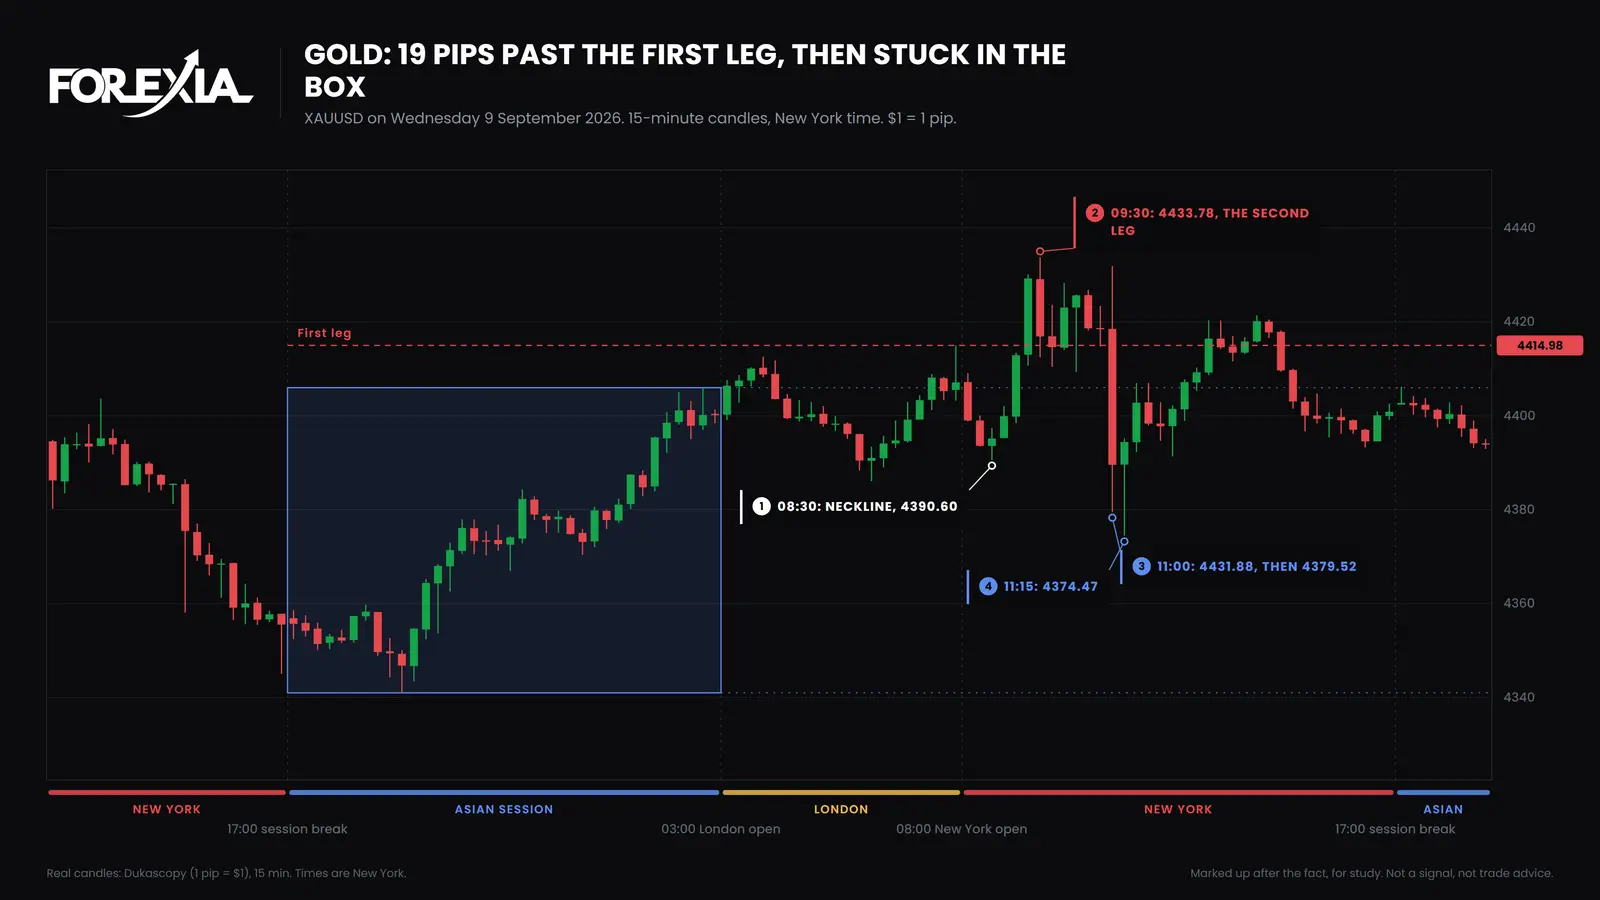
The fall came at 11:00, an hour and a half after the high. That candle opened at 4418.49, traded up to 4431.88, 2 pips short of the high, and fell to 4379.52. The 11:15 candle reached 4374.47, 59 pips under the high. Nothing was on the calendar for it. And then it stopped, and the day ended at 4400.85, back inside the Asian range. A violent second leg did not buy a violent day.
How deep is a second leg, and does depth tell you anything?
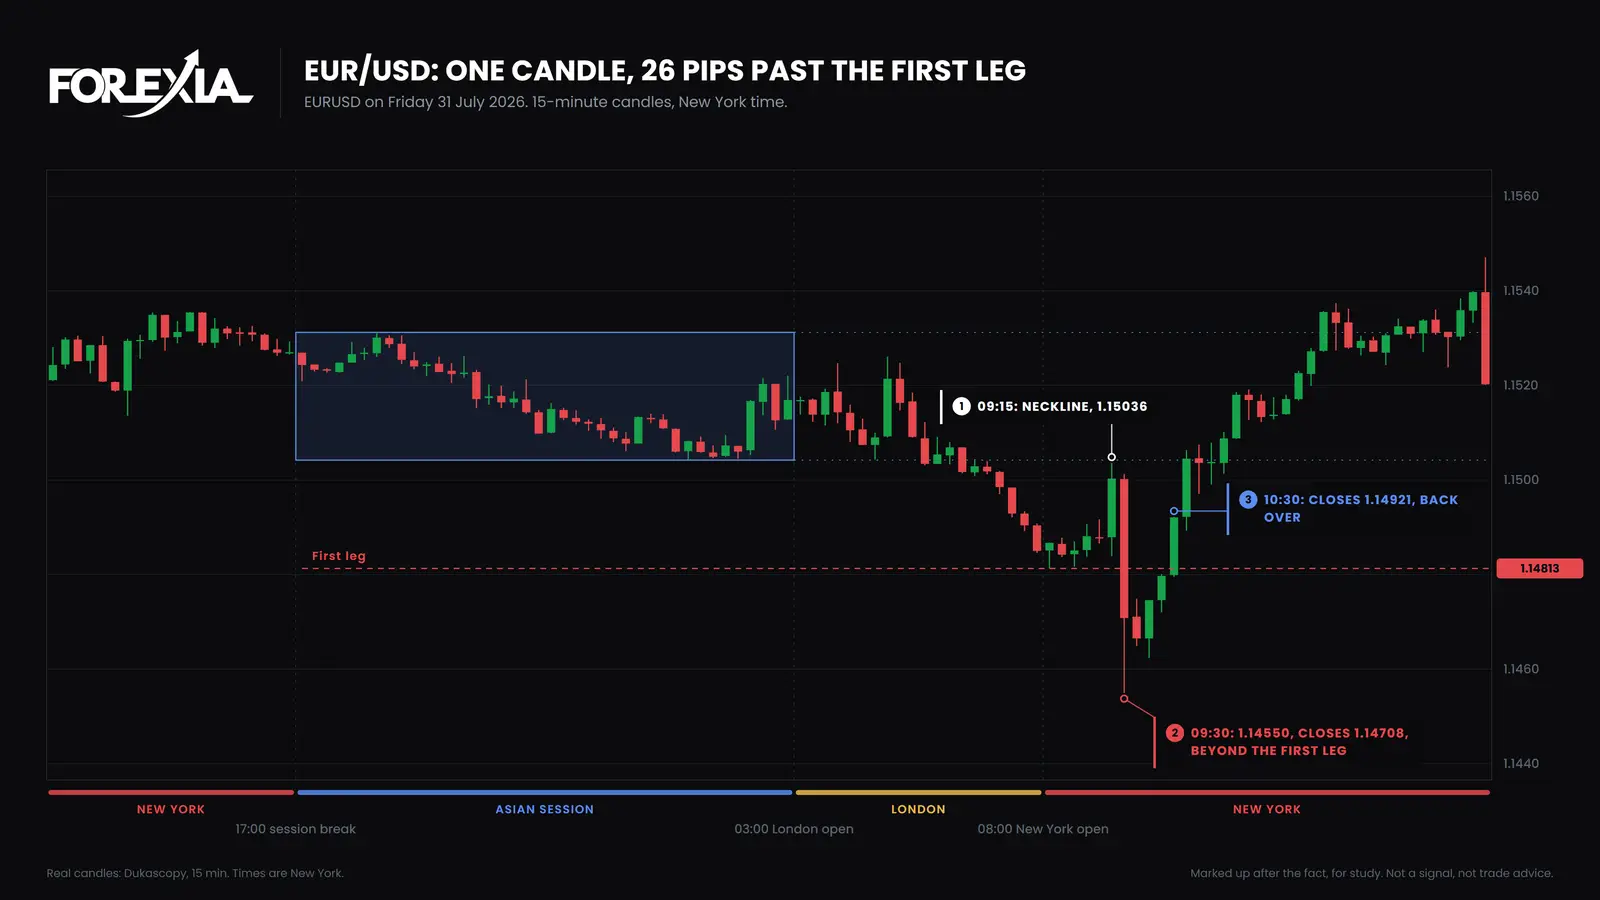
Compare it with EUR/USD on Friday 31 July 2026, a W, which the glossary page walks through. The first leg was 1.14813 at 08:00 and the neckline 1.15036 at 09:15. One candle at 09:30 went to 1.14550, 26 pips past the first leg, and closed at 1.14708, still beyond it. For an hour that looked like a real break, until the 10:30 candle closed back over at 1.14921.
Here are six second legs side by side, the three above and three from our other pages. These are days we picked, so this shows the spread and not an average.
| Day | Shape | Past the first leg | Largest candle in the leg | What price did next |
|---|---|---|---|---|
| USD/CHF, 15 July | M | 2 pips | 6 pips | 81 pips under the high |
| GBP/USD, 13 August | M | 3 pips | 9 pips | 34 pips under the high |
| Gold, 16 September | M | 5 pips | 59 pips | 132 pips under the high |
| Gold, 27 August | W | 5 pips | 21 pips | 54 pips over the low |
| Gold, 9 September | M | 19 pips | 21 pips | 59 pips under the high |
| EUR/USD, 31 July | W | 26 pips | 46 pips | 85 pips over the low by 16:30 |
A 2-pip leg on USD/CHF came before an 81-pip fall. A 19-pip leg on gold came before a 59-pip fall, and the day ended inside its Asian range. Depth did not line up with what followed on these days, and our stop hunt page has more on how far hunts run. Not every second leg is a climax either: GBP/USD's was an ordinary candle. That word is for the violent ones.
What does the second leg actually prove?
It proves the shape exists, and little else. We counted double tops and bottoms on seven dollar majors and gold from 6 April to 1 October 2026, on 15-minute candles. Of those that closed through the neckline, shapes whose second peak ran past the first went back past the peak before the book's target in 49 of 147 cases. Shapes whose second peak stopped short did so in 55 of 156. That gap is too small to read anything into. That count takes any double top, not only M & W Reversals, which also have a place and a time. It is shapes on candles, with no trade in it.
So the second leg tells you where the stops went. It does not tell you which way the day ends. Run as a mechanical rule, including on M and W days, our own test of the setup did not make money. Every day above turned, and that is why it is here. A reversal seen afterwards is not a setup. The M pattern in forex reads the shape itself, and a dated gold M from June is another chart to study. The wider case is on our price action trading page.
Common mistakes
All four come from asking the second leg to say more than it can.
- Seeing the shape too soon. At 11:45 on gold on 16 September, 4361.34 was only a new high of the day.
- Stopping the story at 13:45. That same day, the next candle went past that wick.
- Reading depth as a forecast. On gold on 9 September a 19-pip leg ended with price still inside the range.
- Reading a release as the cause of the read. On 16 September the Fed moved gold and every dollar pair together. That is one dollar move, not several confirmations.
Course 3 of ForexiaPRO, Reverse Price Action, teaches this read step by step in lesson 3.2.2, Second Leg Climax: Why the M and W Wait for It.
Frequently asked questions
What is the second leg in a reversal?
In a double top or double bottom it is the second push to the extreme: the run past the first leg's high or low. We read the first leg as bait and the second as the hunt for the stops it left. A first leg on its own is only a new high or low of the day.
How far past the first leg does the second leg go?
There is no fixed distance. On our six days it ran 2 pips on USD/CHF, 3 on GBP/USD, 5 on gold twice, 19 on gold and 26 on EUR/USD. Those are 15-minute candles from July to September 2026, chosen because they turned, so they show the spread and not an average.
Does a second leg mean price will reverse?
No. It tells you the shape exists, and not what comes next. In our count of double tops and bottoms that closed through the neckline, a second peak past the first did not separate those that later went back past the peak from those that did not. Our own test of the setup as a mechanical rule did not make money.
Is the second leg the same as a two-legged pullback?
No. In a two-legged pullback the second leg is a pause inside a trend, and it should not break the swing it started from. In an M or a W the second leg goes past the first leg's extreme, and that run is what makes the shape.