
The Previous Day's High and Low: What Rests There, and How Often Price Closes Back
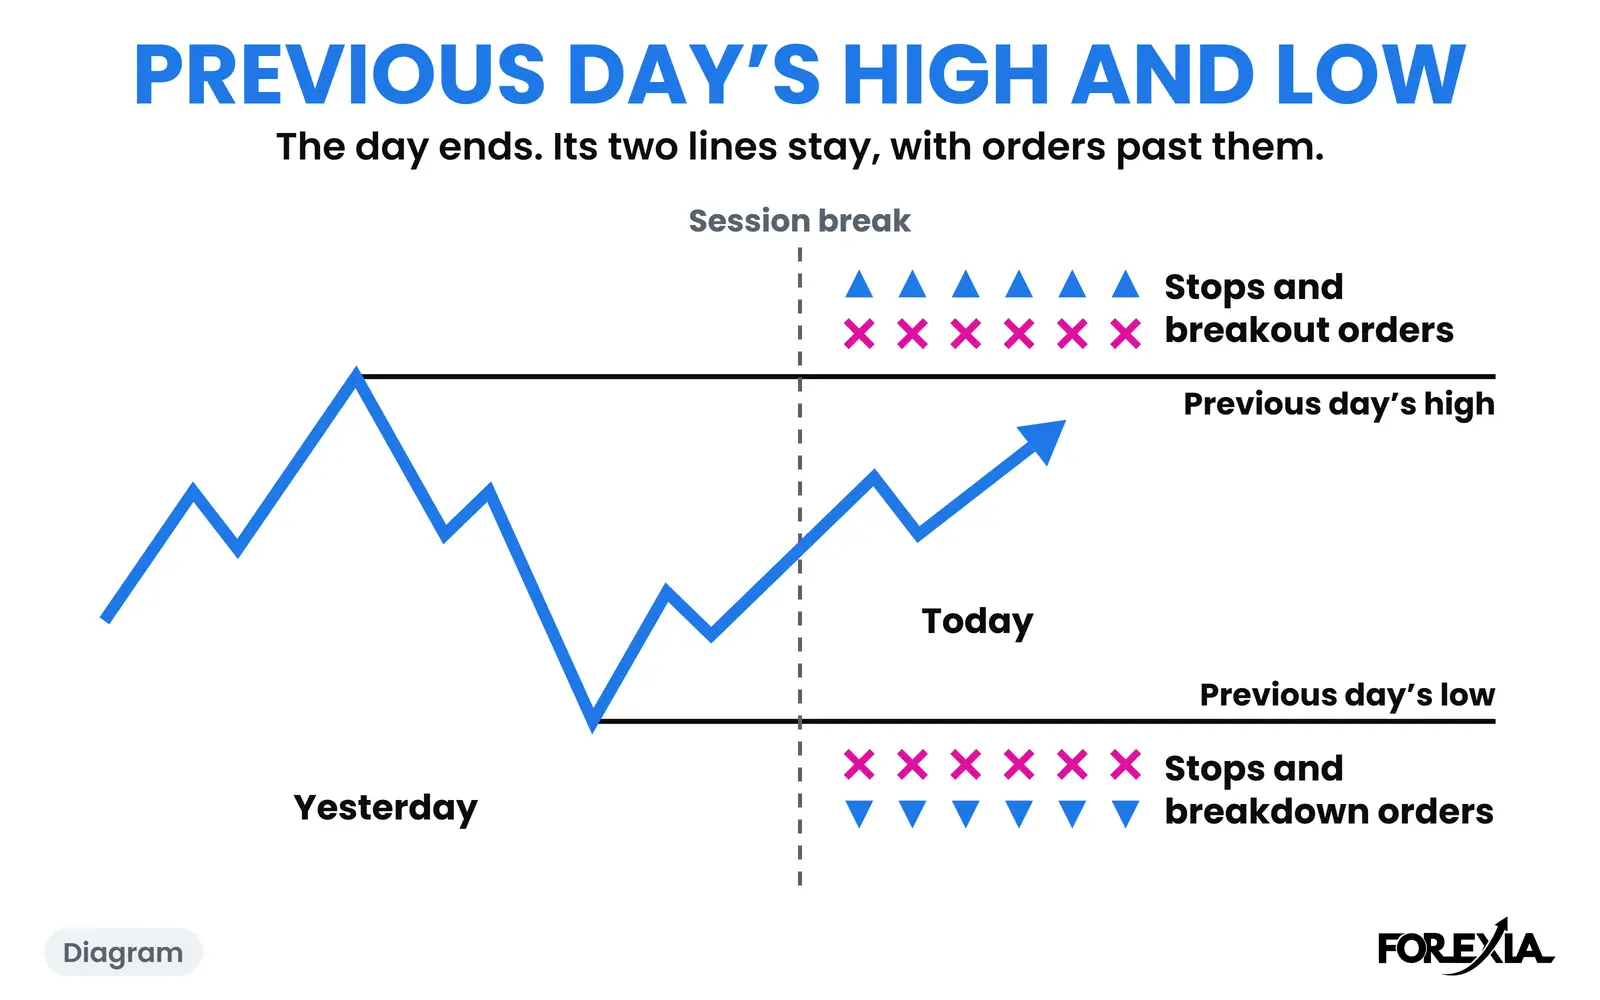
The previous day’s high and low are the highest and lowest prices of the last completed trading day, and stops and breakout orders rest just beyond them. Most guides call them PDH and PDL. We run the day from the 17:00 New York session break to the next one, so on a Monday the previous day is Friday.
What does the previous day's high and low look like on a chart?
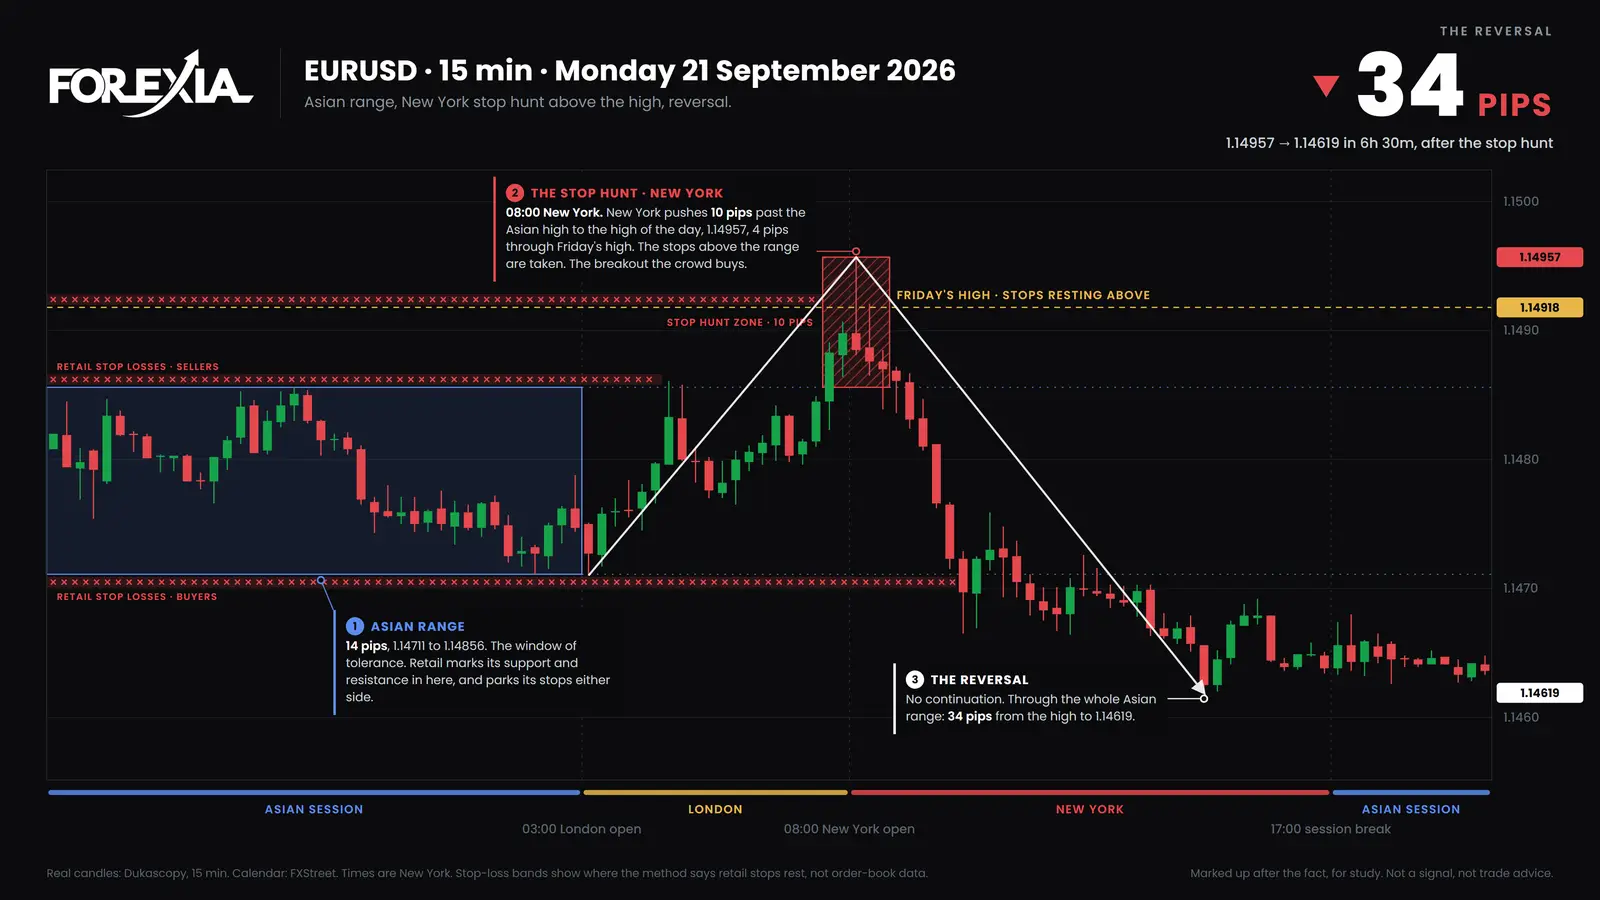
It looks like one line with two orders past it. On EUR/USD on Monday 21 September 2026, Friday's high (1.14918) sat 6 pips over the Asian Box. Above it we read Friday's sellers' stops and the entries of those waiting to buy the break, all buys. The 08:00 New York candle reached 1.14957, 4 pips through, and closed at 1.14885, back under it: the Close Back. No 15-minute candle closed over Friday's high all day, and by 14:30 price was at 1.14619, 34 pips off the top.
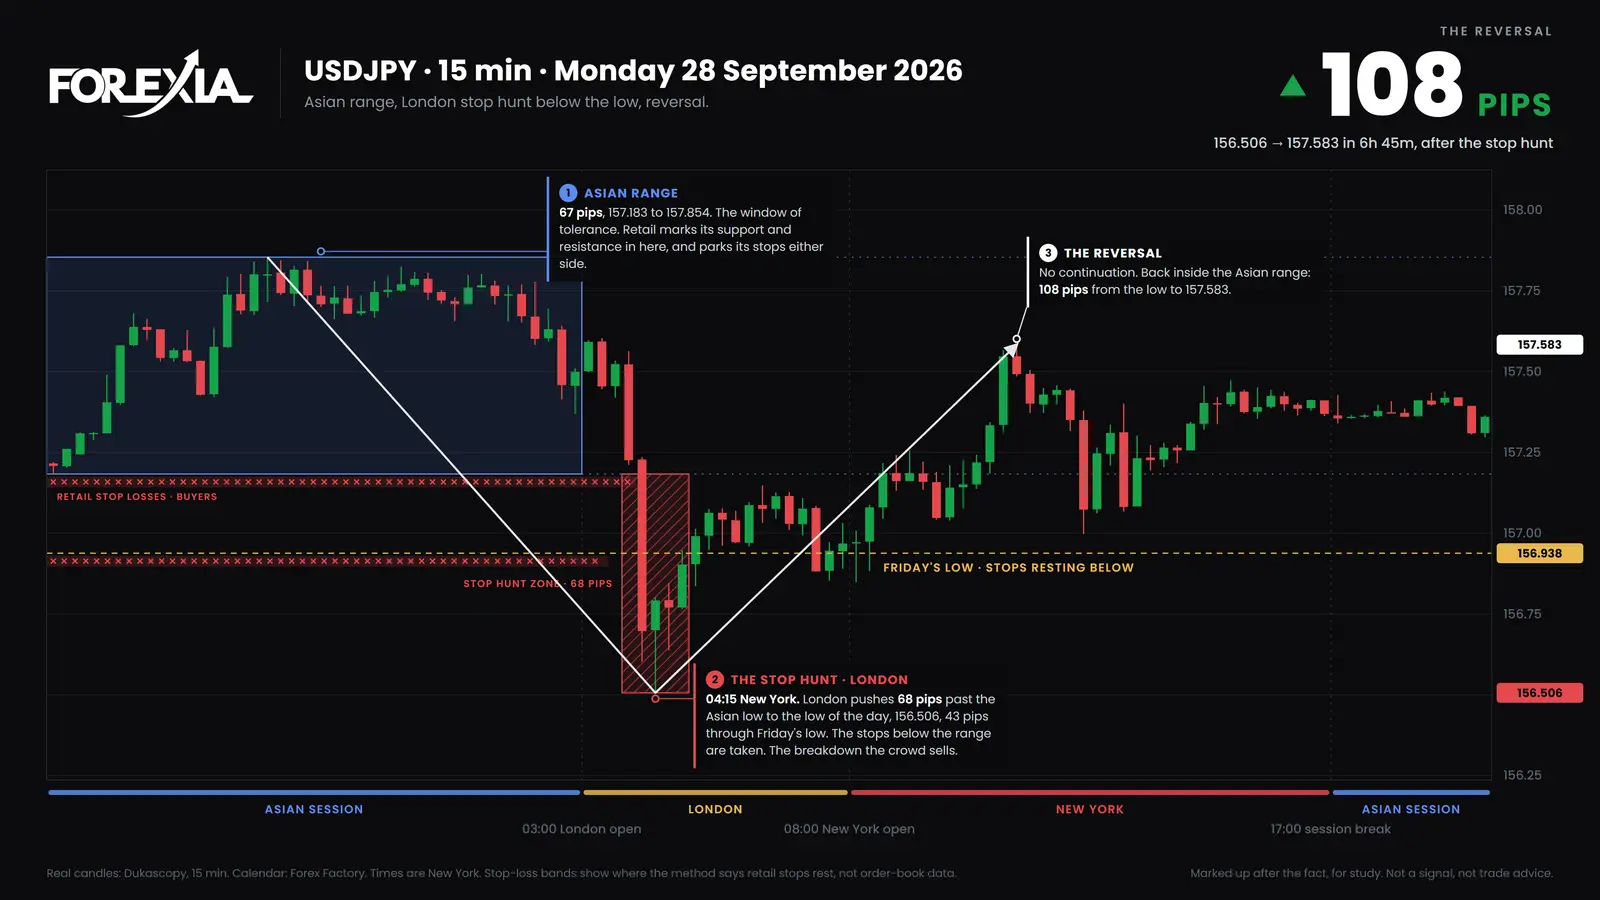
Not every close back is that quick. On USD/JPY on Monday 28 September, Friday's low was 156.938. The 04:00 candle closed at 156.697, 24 pips under it: a close beyond, and the crowd sees a break. The 04:15 candle reached 156.506, 43 pips under. That candle and the next two also closed under the line. The 05:00 candle closed at 156.991, back above, and by 11:00 price was at 157.583, 108 pips off the low.
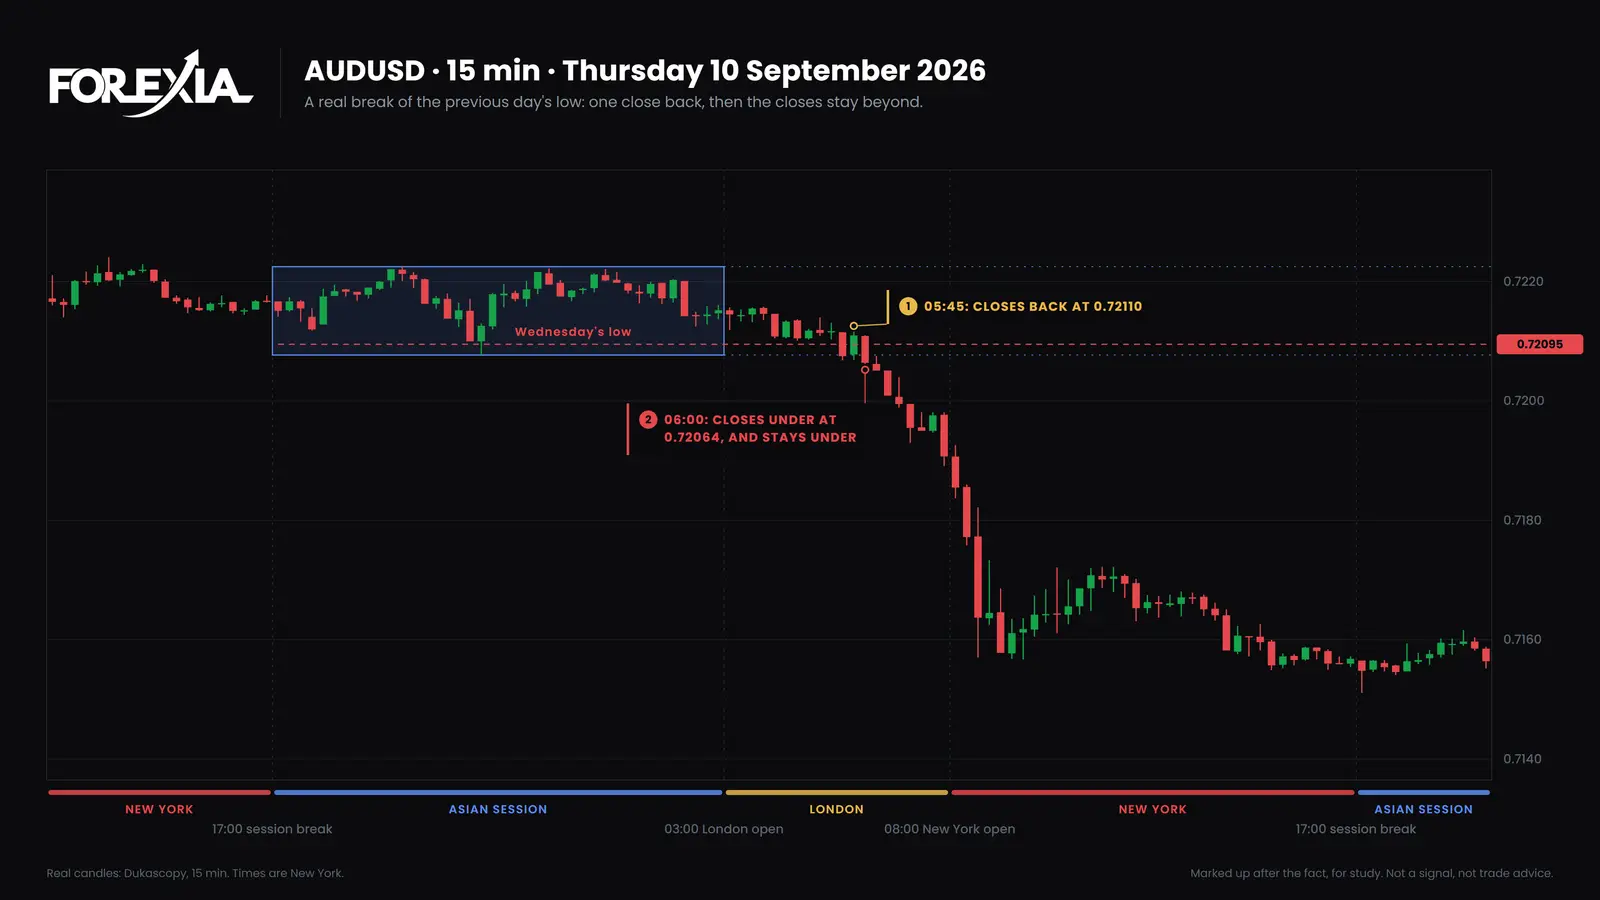
Some breaks are real, and a close back does not rule that out. On AUD/USD on Thursday 10 September, Wednesday's low was 0.72095. The 05:30 candle closed under it, the 05:45 closed back at 0.72110, and the 06:00 closed under at 0.72064. No candle closed back after that. By 08:30 on Friday price was at 0.71496, 60 pips under the line.
How often does price close back through the previous day's high or low?
Usually the same day, and that proves less than it sounds. We counted every time a previous day's high or low was traded through by at least 3% of the average daily range, from the London open to 17:00 New York, on seven majors and gold, from 6 April to 1 October 2026. A level Asia had already passed is left out, as Wednesday's low above was.
| First close back | Levels |
|---|---|
| On the same candle | 118 |
| Within the next hour | 146 |
| Later that day | 77 |
| None by 17:00 | 81 |
| Total | 422 |
So 341 of 422 (81%) closed back. After 205 of those (60%), price went past that wick again the same day. The median trip past the line was about a tenth of an average day when it closed back, and about two thirds when it did not. These are counts of candles, not trades, and our own test of this setup as a mechanical rule did not make money.
The previous day's high and low, and PDH and PDL: is there a difference?
The prices are the same, and the reading differs. Guides call PDH resistance and PDL support, then call a break of either a trigger. Both are true of someone's plan, which is the point: one trader sells at the line and another buys over it. Stops from the first and entries from the second are the same order past the same line, and that is why we call it a pool.
Check your chart's day too, since "previous day" follows its boundary. How traders build a previous day high and low trading strategy has its own post, and the wider liquidity sweep guide shows where these levels fit.
What do traders get wrong about these levels?
Three readings cost the most.
- Using the wrong yesterday. Monday's yesterday is Friday, not the few hours of Sunday evening.
- Deciding too early. On the yen, a close beyond at 04:00 looked like a break for an hour.
- Calling every break a hunt. In 81 of the 422, nothing closed back by 17:00. A stop hunt is named afterwards, and a reversal seen afterwards is not a setup.
Which words does this lead into?
Three sit next to it.
- Liquidity Mapping: marking the pools of stops on the chart before the session.
- The Close Back: the spike that closes back inside the level it pushed through.
- High and Low of the Day: today's moving extremes, against yesterday's fixed ones.
Where is the previous day's high and low taught?
Course 1 of ForexiaPRO, Reading the Map, teaches this read step by step in lesson 1.2.3, The Previous Day's High and Low.
Related words
Frequently asked questions
What are PDH and PDL?
They are short for the previous day's high and the previous day's low: the highest and lowest prices of the last completed trading day. Forexia reads each as a pool, because stops and breakout orders rest just beyond them.
Which day counts as the previous day on a Monday?
Friday. We run the trading day from the 17:00 New York session break to the next one, so the few hours of Sunday evening belong to Monday's session and are not a day of their own.
Does price usually close back after going through the previous day's high or low?
In our count it did 341 times out of 422, the same day, on seven majors and gold from 6 April to 1 October 2026. That does not make a close back a plan: after 205 of those close backs, price went past that wick again the same day. These are counts of candles, not trades.
How do you tell a hunt of the previous day's high or low from a real break?
By the closes, and only afterwards. A hunt goes through and closes back. A real break closes beyond and keeps closing beyond. On AUD/USD on 10 September 2026 one candle did close back, and the next went under for good, so a single close tells you what has happened, not what comes next.