How to Find Liquidity Pools in Forex: EUR/USD and Gold on CPI Day, 11 September 2026
Dylan Forexia8 min read
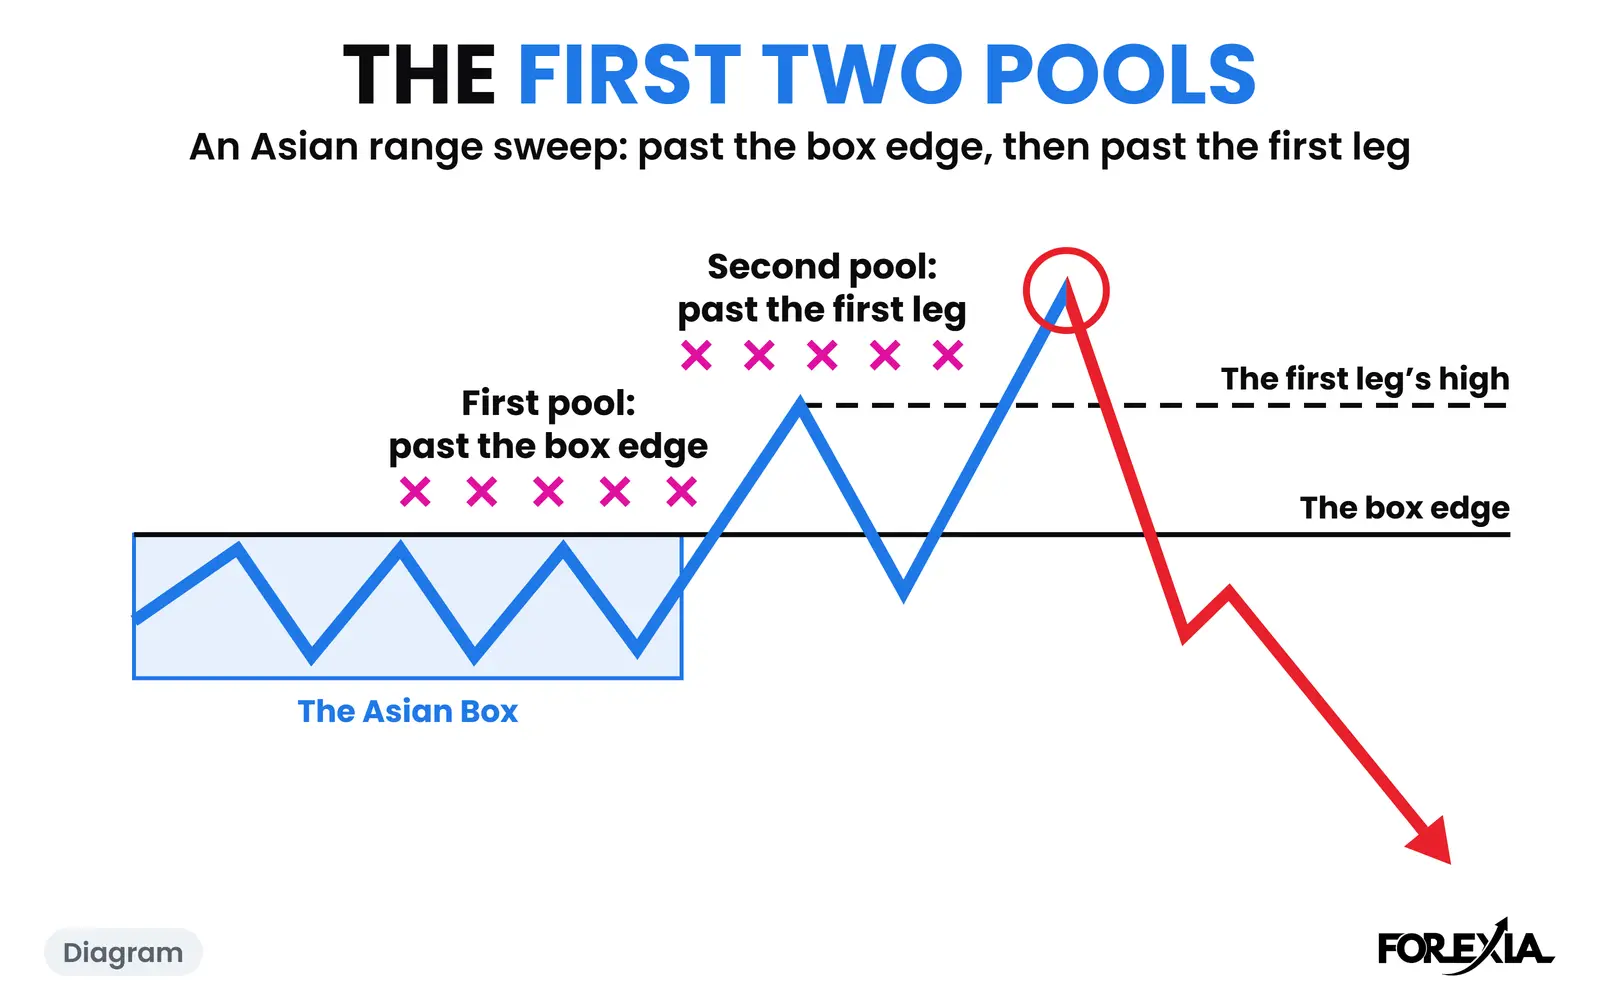
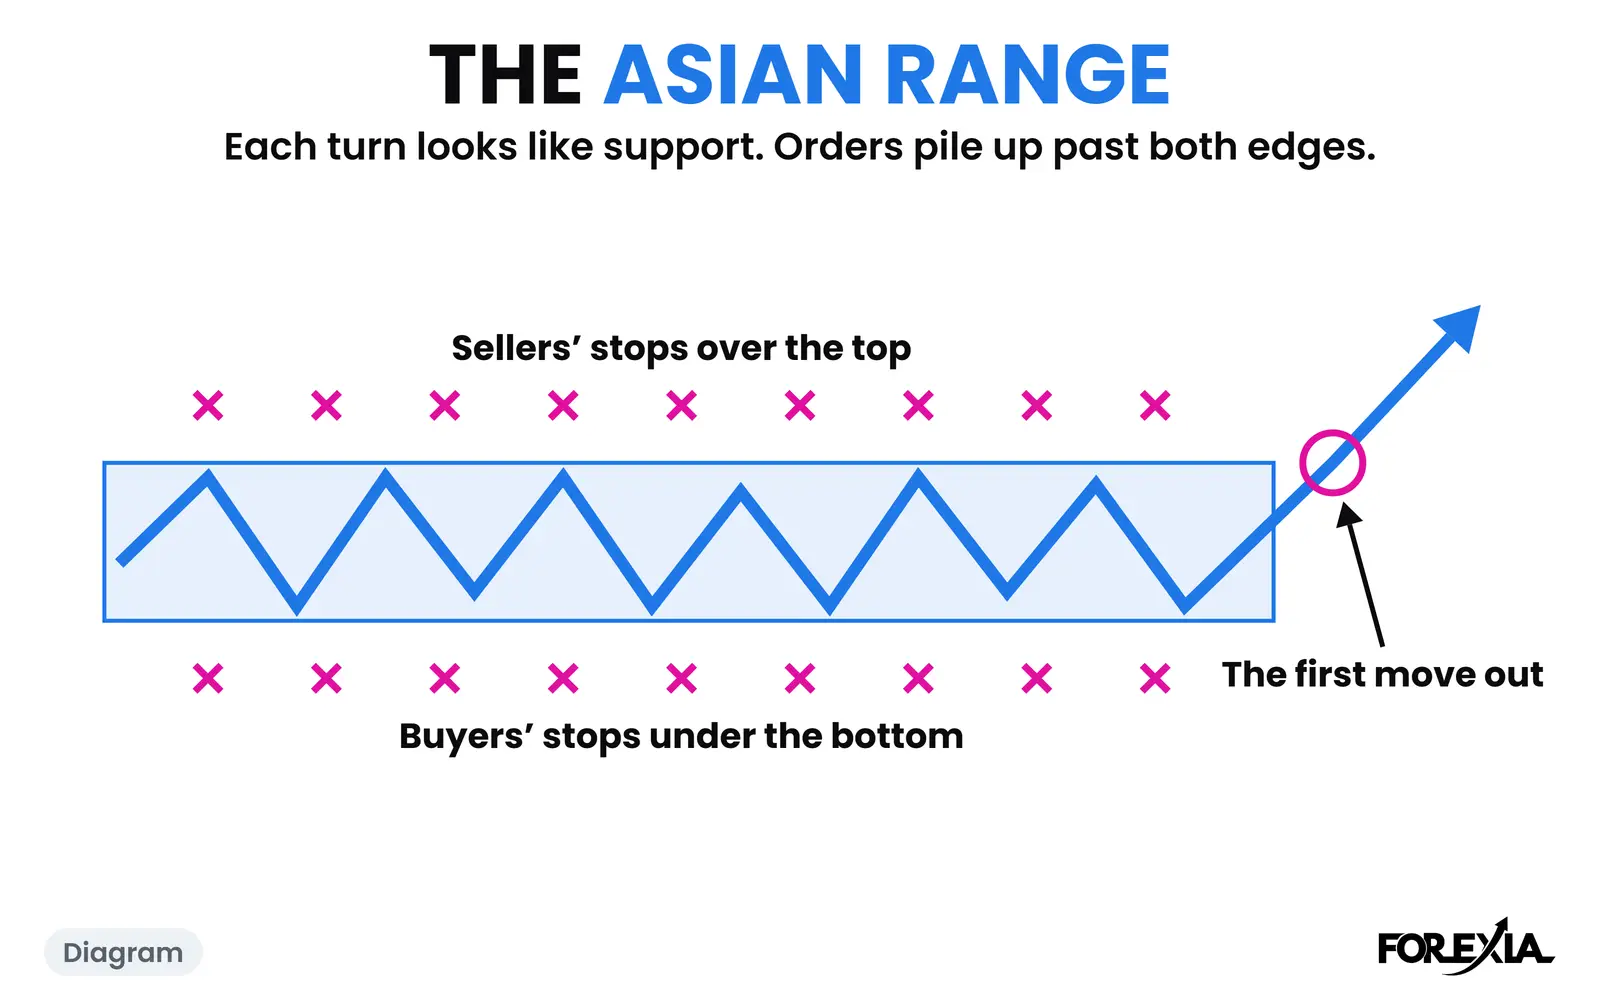
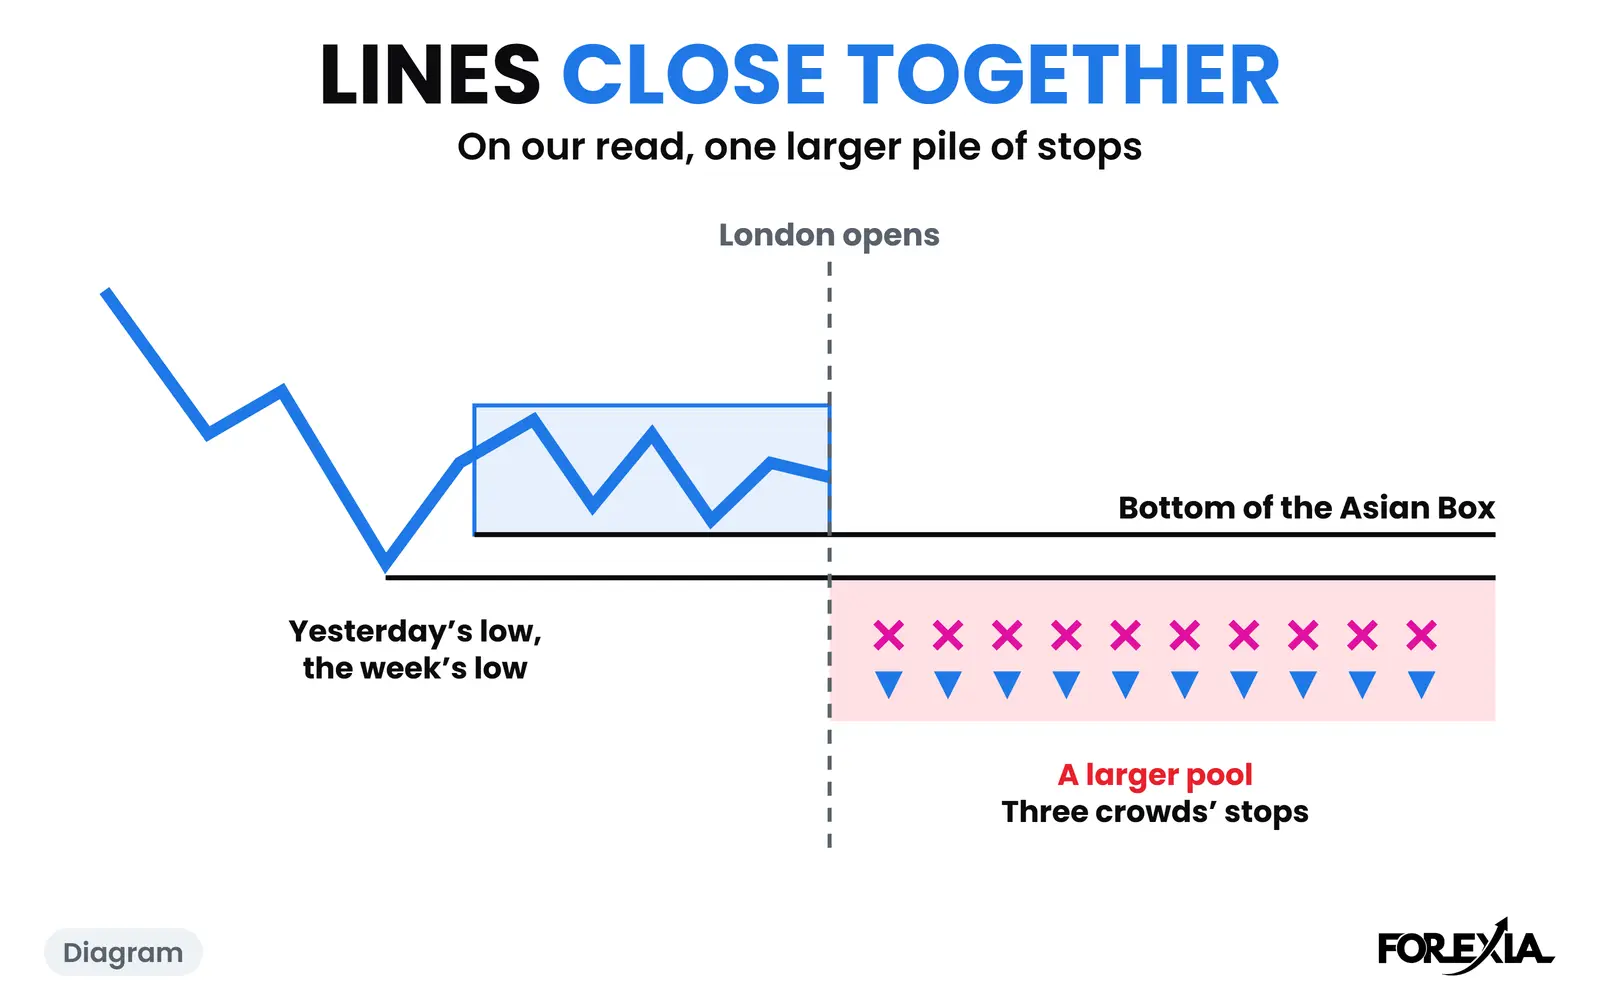
To find liquidity pools in forex, look just past the levels the whole crowd can see: the Asian range, the previous day's high and low, and the week's high and low. Stops and breakout orders gather beyond those lines, and where two lines sit close together we read one larger pool. EUR/USD and gold on 11 September 2026 show a whole map, and what price did to it.
We call a chart with those lines on it Liquidity Mapping. Where liquidity sits on a chart explains the orders at a single line. This page is the whole map, on one real morning.
How do you find liquidity pools in forex?
You work them out from where the textbook sends the crowd, because nothing on a forex chart shows them directly. Spot forex trades over the counter, so there is no public book. The word also has other uses. Half the pages on this search mean how busy a market is, and brokers use "liquidity pool" for the banks that quote them prices.
Here is what the usual methods can and cannot show.
| What guides suggest | What it shows | What it cannot show |
|---|---|---|
| Session, daily and weekly highs and lows | The lines the most traders can see, with the orders the textbook leaves past them | Whether the orders are really there |
| Swing highs and lows, double tops, trendlines | More places the crowd puts stops, though we have no count for them | Which of them the whole crowd shares |
| Round numbers | The one place with order-book research behind it, from one bank's old data | What any market holds today |
| Volume profile | Where past volume traded, on one feed | A stop that has not fired |
| Depth of market | Limit orders at one venue | Stops at every other broker |
| Spreads and session overlaps | How busy the market is | Where the orders rest |
| Liquidity finder indicators | Lines at pivots, drawn by a rule | Anything a chart does not already show |
We mark the first row, because those are the levels every trader in every timezone shares, and the ones the counts in our liquidity sweep guide use.
What was on the map before London? EUR/USD, Friday 11 September 2026
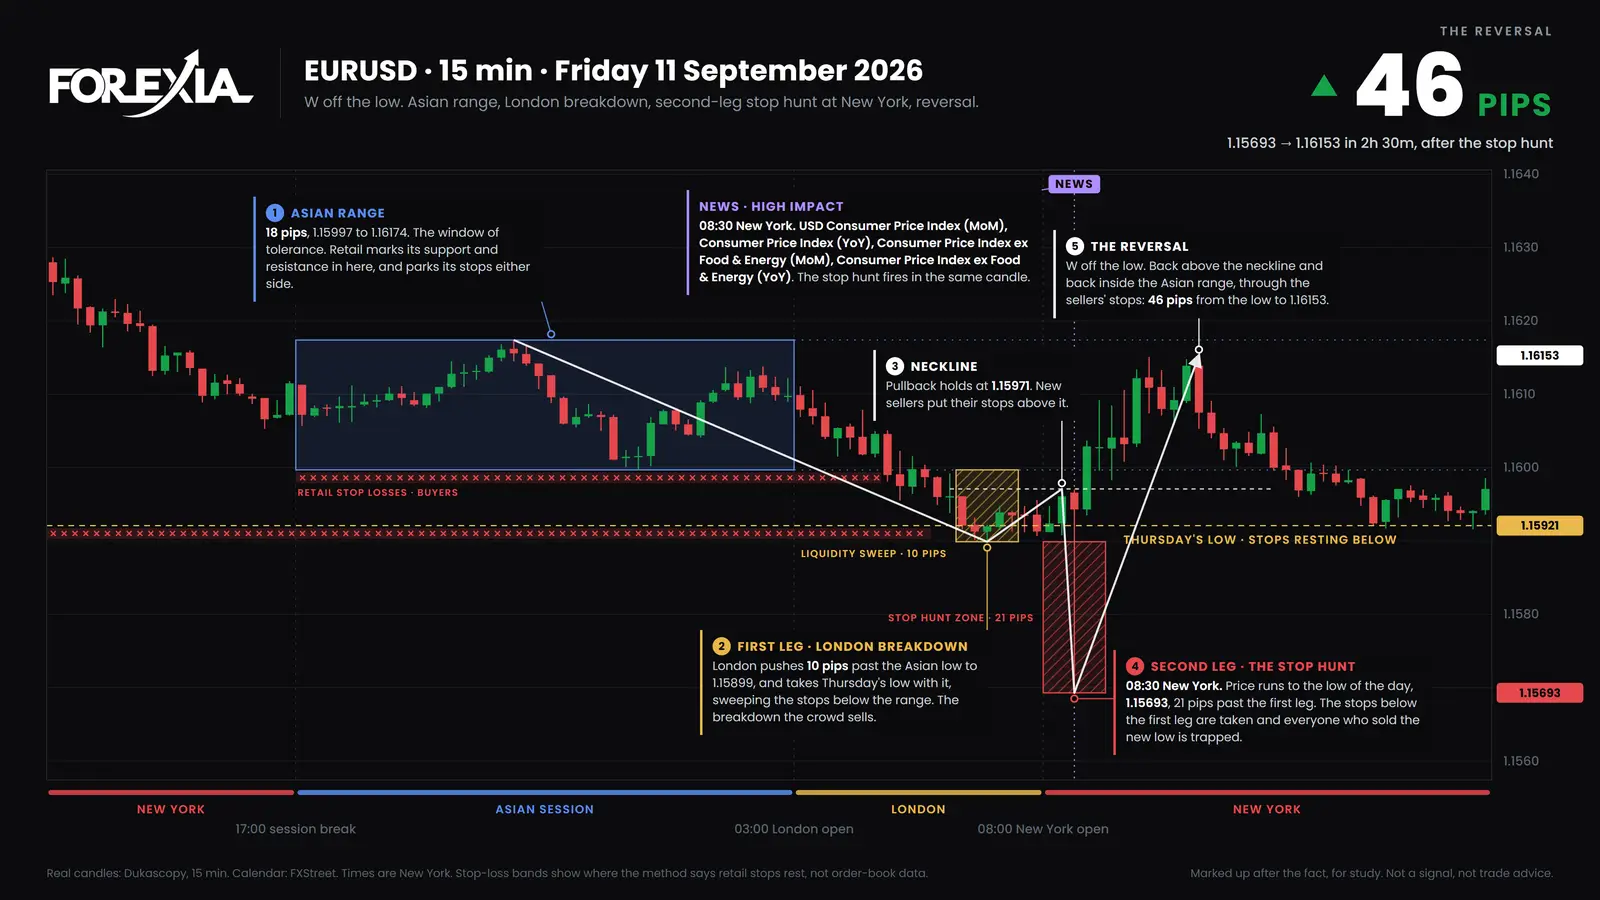
In the last quarter-hour before London opened, the euro was at 1.16098, and this is what sat around it. The last column was filled in afterwards.
| Line | Price | What rests past it | What price did |
|---|---|---|---|
| Wednesday's high, the week's high | 1.16541 | Sellers' stops, breakout buys | Not reached |
| Thursday's high | 1.16418 | Sellers' stops, breakout buys | Not reached |
| Top of the Asian Box | 1.16174 | Sellers' stops, breakout buys | Not reached |
| Bottom of the Asian Box | 1.15997 | Buyers' stops, breakdown sells | Through at 04:45 |
| Thursday's low, the week's low so far | 1.15921 | Buyers' stops, breakdown sells | Through at 06:15 |
| Last week's low | 1.15662 | Buyers' stops, breakdown sells | Not reached, by 3 pips |
So the bottom of the box, yesterday's low and the week's low sat within 8 pips of each other, and every buyer's stop from today, yesterday and the week was under them. We read that as one larger pool, 10 pips under price. The top of the box was nearer, 8 pips over price, with less behind it on our reading. The calendar that day held America's inflation figures at 08:30.
What did price do to the pools?
It took them in two passes. London closed under the box at 04:45 and reached 1.15899 at 06:45, 10 pips under the box and 2 under Thursday's low. The crowd sold that break, on our reading. It was no clean move: the 07:00 candle closed back over Thursday's low at 1.15939, the 07:45 closed under it again, and the 08:15 reached 1.15971.
Then the 08:30 candle. It opened at 1.15966 and reached 1.15693, a range of 28 pips: 21 under London's low, 23 under Thursday's low and 30 under the box. It closed at 1.15943, 2 pips back over Thursday's low and still under the box. The next candle closed inside the box at 1.16029. By 11:00 price was at 1.16153, 46 pips off that low. We call that move the stop hunt, most traders a liquidity sweep, and on CPI has the candle minute by minute.
That low stood as the low of the week, 85 pips under Wednesday's high. Last week's low was 3 pips further on, and the candle did not get there. So the map's last line on that side was not the one price turned at. Nobody marking the chart before London could have picked between them.
The same minute on another map: gold
Gold's map was different, because Asia had already been through part of it. Counting $1 as 1 pip, Thursday's low was 4313.50, and the Asian Box ran 4300.49 to 4360.85, 60 pips. Its bottom sat 13 pips under Thursday's low. So that line had already gone, and the deepest pool on gold's map was under the box. Gold's box is usually wide, and this one was more than half of the market's average day.
The same 08:30 candle opened at 4340.86 and reached 4291.95, 9 pips under the box and 22 under Thursday's low. It also traded 4362.23, a pip over the top of the box, and closed at 4353.61, inside it. The next candle closed at 4388.35, over the top, and by 09:45 gold was at 4402.27, 110 pips off the low. That low stood as gold's low of the week, 10 pips short of last week's low at 4282.03. Thursday's high, 4435.11, was not reached.
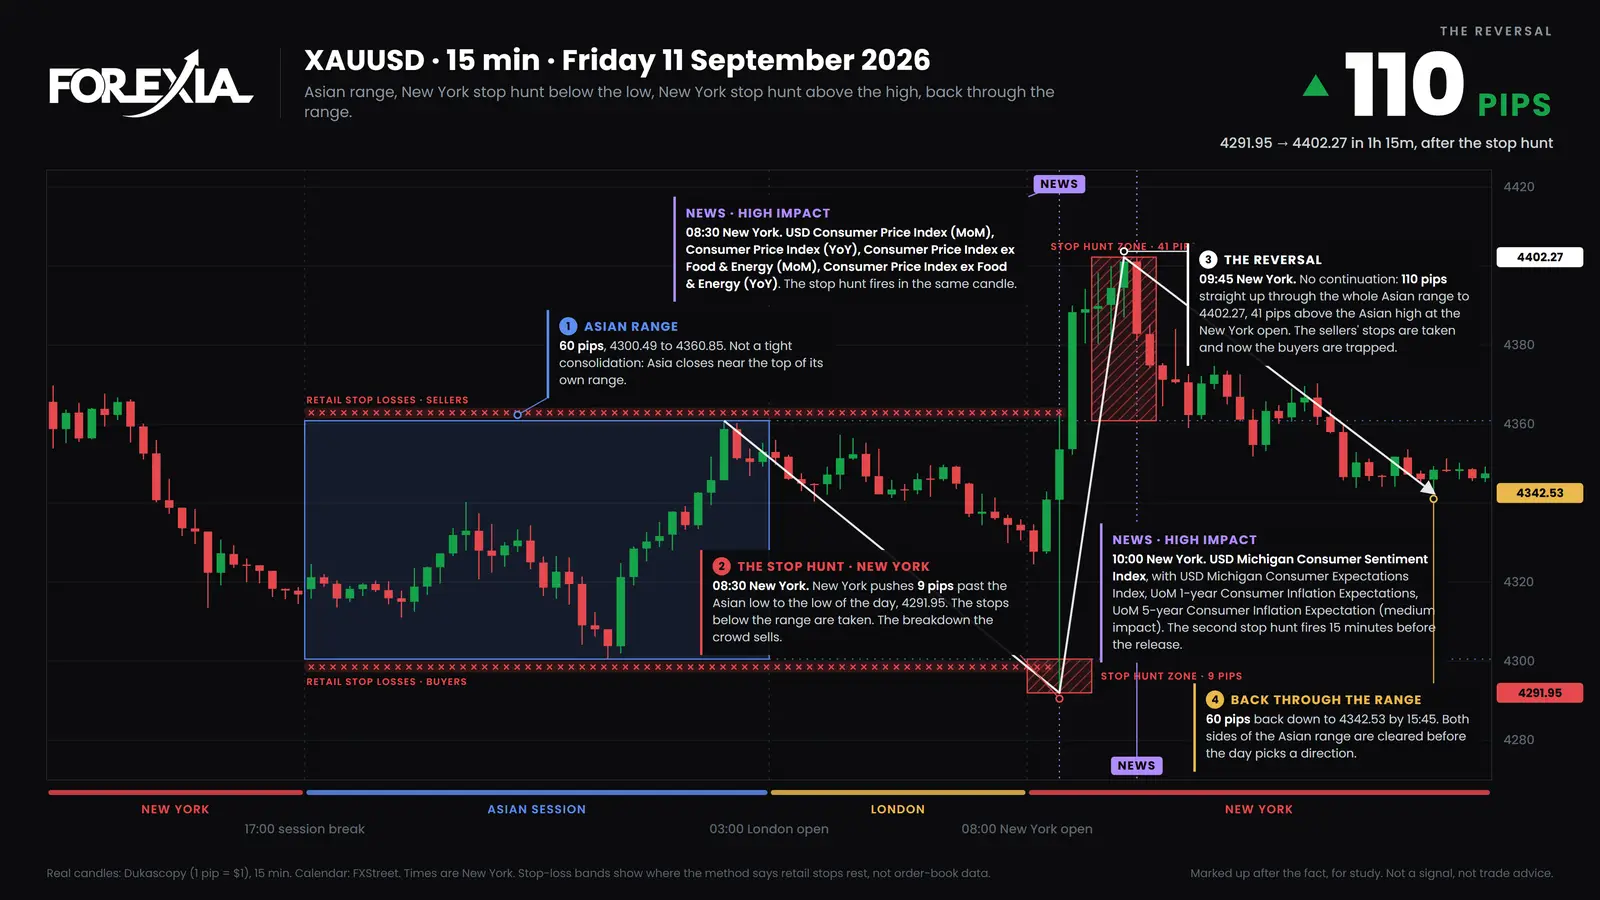
Each candle went past the deepest pool on its own map. Keep one caution beside that. The release moved every dollar pair, so this is one dollar move and not two confirmations, and nothing on a chart shows that anyone aimed it. More of that week is in the CPI markups of 7 September, and news trading has its own guide.
What happens when the same map does not turn?
It breaks, or nothing happens at all. Both happen, and a page of reversals hides them.
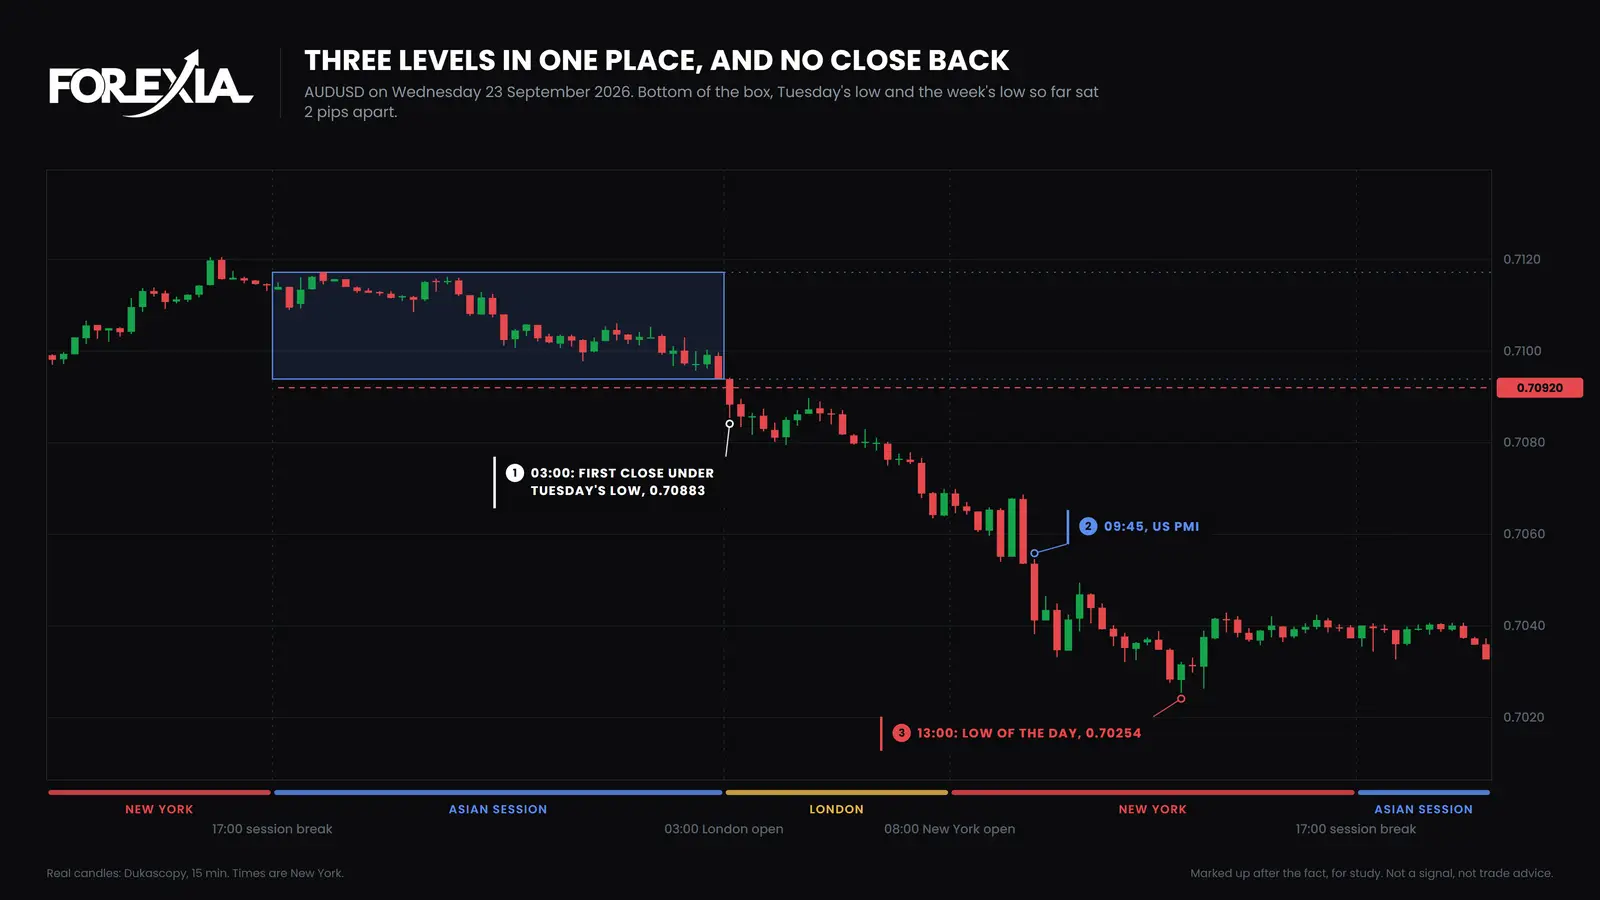
AUD/USD, Wednesday 23 September 2026. This was the same picture, tighter. The bottom of the box was 0.70939 and Tuesday's low, also the week's low so far, was 0.70920, 2 pips apart. London's first candle closed under both at 0.70883. No candle closed back that day. By 07:15 price had also closed through last week's low, and by 13:00 it was at 0.70254, 67 pips under Tuesday's low. A US business survey at 09:45 added to it, but the line had gone hours before. Price did not trade back over it that week.
NZD/USD, Friday 25 September 2026. The bottom of the box was 0.56500 and Thursday's low 0.56496, under a pip apart. London never went there, and the day's high came at 0.56771 at noon.
We counted how often a level closes back, though not how often levels that meet do. Of 1,601 levels taken on seven majors and gold, on 15-minute candles from 6 April to 1 October 2026, 291 had not closed back by 17:00 New York. A level is an edge of the Asian range or the previous day's high or low, taken when price trades past it by at least 3% of the average daily range, and the guide to the liquidity sweep has the rest of the rules and the table. These are counts of candles, not trades, and our own test of this setup as a mechanical rule did not make money.
What did each seat see before London opened?
The three seats read the euro's map three ways.
- Retail saw support, three times over. The textbook buys the bottom of the box, or waits to sell under the week's low.
- The market maker, as we read it, saw sell orders in one place. Every order under 1.15921 was a sell, and it had a known minute coming at 08:30.
- The observer saw a list. A few lines, a note of whose orders were past each one, and a time. What came next could only be checked afterwards.
Common mistakes
All three make a map less useful.
- Stopping at the first line under price. On the euro that was the bottom of the box, and price went on through Thursday's low, 8 pips under it. On gold the line most traders would have marked had already gone.
- Taking the morning's low as the whole story. At 06:45 London's low stood 2 pips past Thursday's low. The 08:30 candle went 21 pips further.
- Reading a map as a forecast. AUD/USD had the same picture as the euro and never closed back. NZD/USD had the same picture and went the other way. The map says where the stops may be and no more.
Course 1 of ForexiaPRO, Reading the Map, teaches this read step by step in lesson 1.2.5.
Frequently asked questions
Where do stop losses sit in forex?
Mostly just past the levels the textbook teaches: under lows and support, over highs and resistance. The edges of the Asian range, the previous day's high and low and the week's high and low are the ones most traders can see. Nobody outside a broker can see the stops themselves, so this is a reading of the chart.
Does a volume profile or depth of market show liquidity pools?
Not the stops. A volume profile shows where past volume traded on one feed, and a depth window shows limit orders at one venue. Neither sees a resting stop, because spot forex has no central order book. So any pool on a chart, from any tool, is worked out from the structure and is not data.
Is a deep pool more likely to turn price?
We have no count for that, and the days here point both ways. On EUR/USD on 11 September 2026 three levels within 8 pips gave way to a candle that closed back above Thursday's low. On AUD/USD on 23 September 2026 three levels within 2 pips broke on London's first candle and never closed back.
Do liquidity pools work on news days?
A release can send price through several levels in one candle, which is what the 08:30 inflation candle did on 11 September 2026. That does not show the release was aimed at the level. It moved every dollar pair, so two charts on that morning count as one dollar move, not two confirmations.