What Is Perceptual Positioning in Trading Psychology?
Dylan Forexia7 min read
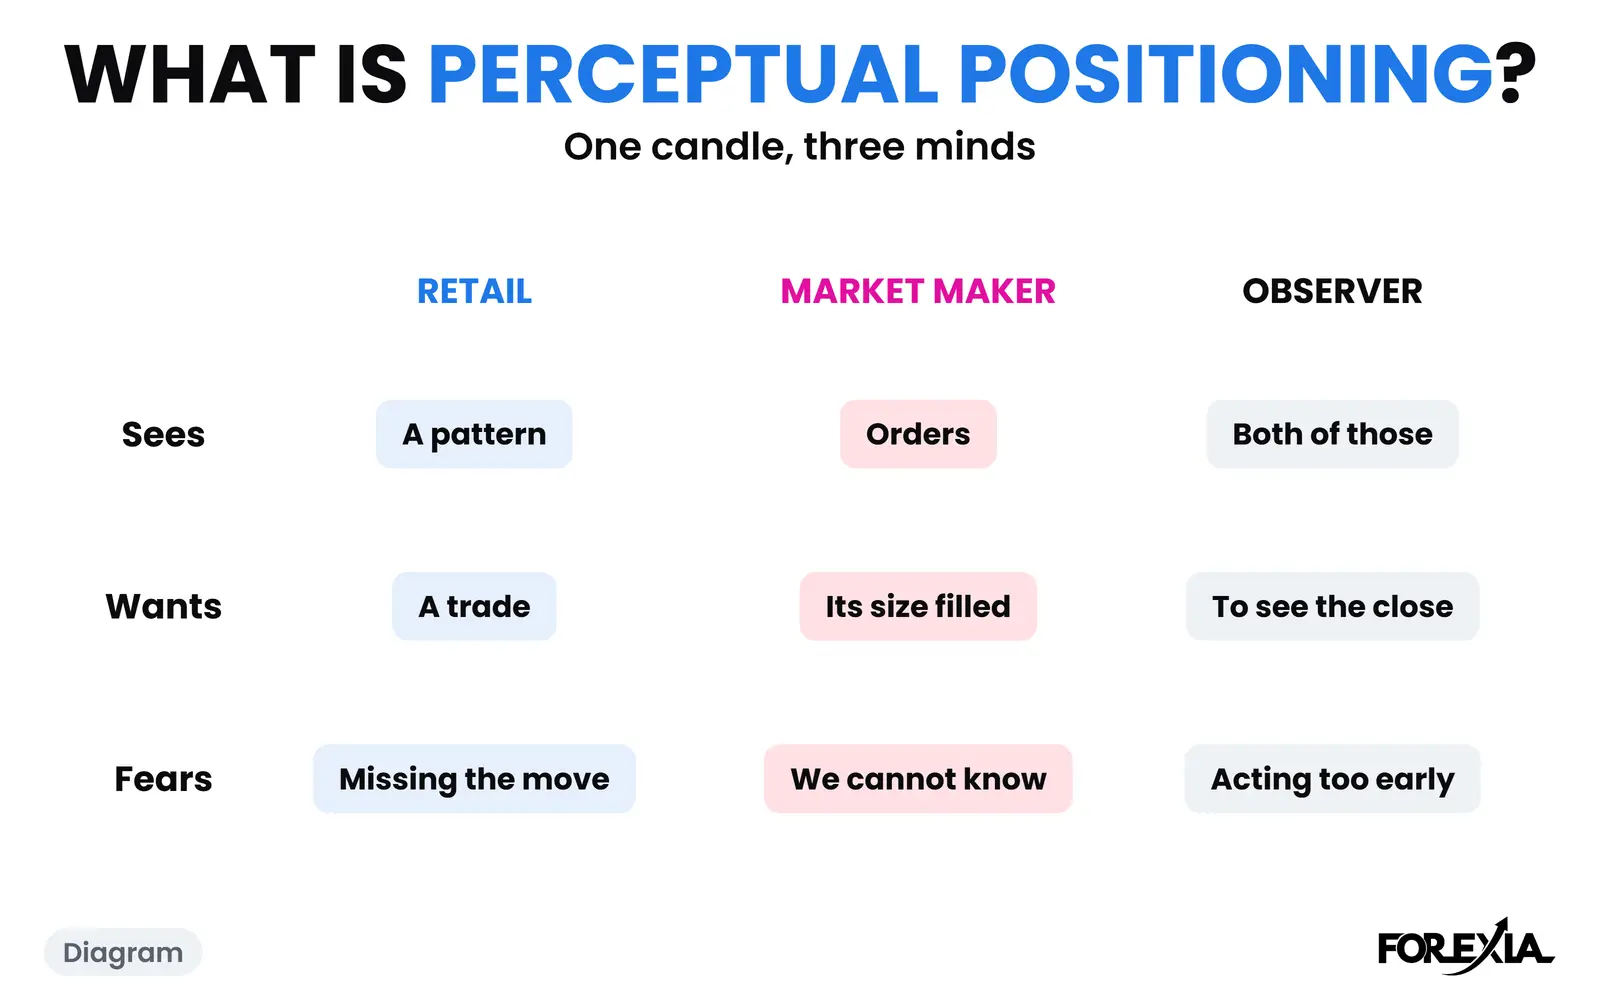
Perceptual positioning in trading psychology is reading one chart from three seats on purpose: the retail trader's, the market maker's and an observer's, and asking what each one sees, wants and fears. It is borrowed from an exercise in neuro-linguistic programming, and the use on charts is Forexia's. It is a habit of reading, and nobody has tested it on traders.
The short definition, with a gold day, is on the Perceptual Positioning page. This page is for what comes after the definition: where the idea came from, what it asks of you, and what it looks like when the read changes during a day.
What is perceptual positioning in trading psychology, and what is it not?
It is the act of changing where you read a chart from. The places you read from are the Three Seats. Most writing on trading psychology starts inside your own head, with fear, greed and discipline. This starts with who else is on the candle.
It is not a mood, an indicator or a signal. It does not tell you which way price will go.
It is also not the marketing term. In marketing, perceptual positioning usually means how customers place a brand against its rivals, often on a perceptual map. If that is what you searched for, this is the wrong page.
Where does perceptual positioning come from?
It comes from neuro-linguistic programming, where the exercise is called perceptual positions. Most NLP writers we read credit John Grinder and Judith DeLozier's 1987 book, Turtles All the Way Down, for setting out three of them, and it is taught today for negotiation and coaching.
- First position: you, seeing the situation through your own eyes.
- Second position: stepping into the other person's place and seeing it as they do.
- Third position: stepping outside both, as a detached observer.
Carrying that onto a chart changes two things, and they matter.
Our first seat is not really you. It is what the textbook taught you and millions of others, so your first position on a chart is usually a borrowed one. And our second seat is a guess. In a negotiation the other person is in the room, and their words can correct you. Nobody in a dealing room will correct you about a candle. You reason from the structure of the chart, and it may be wrong.
Then there is the evidence. NLP has a weak record: a 2012 systematic review in the British Journal of General Practice found "little evidence that NLP interventions improve health-related outcomes", and said this reflects limited research and not robust evidence of no effect. That review is about health and about NLP at large, not this exercise. We found no study of it on traders either. We use the exercise and we do not make NLP's claims for it.
What does each seat see, want and fear?
Each seat has a different answer on the same candle, and the fear is often the most useful part. GBP/USD on Thursday 24 September 2026 is the lesson's day. The Asian Box ran from 1.32227 to 1.32505. The 03:45 New York candle opened at 1.32475, pushed to 1.32557, 5 pips over the top, and closed at 1.32458, back inside.
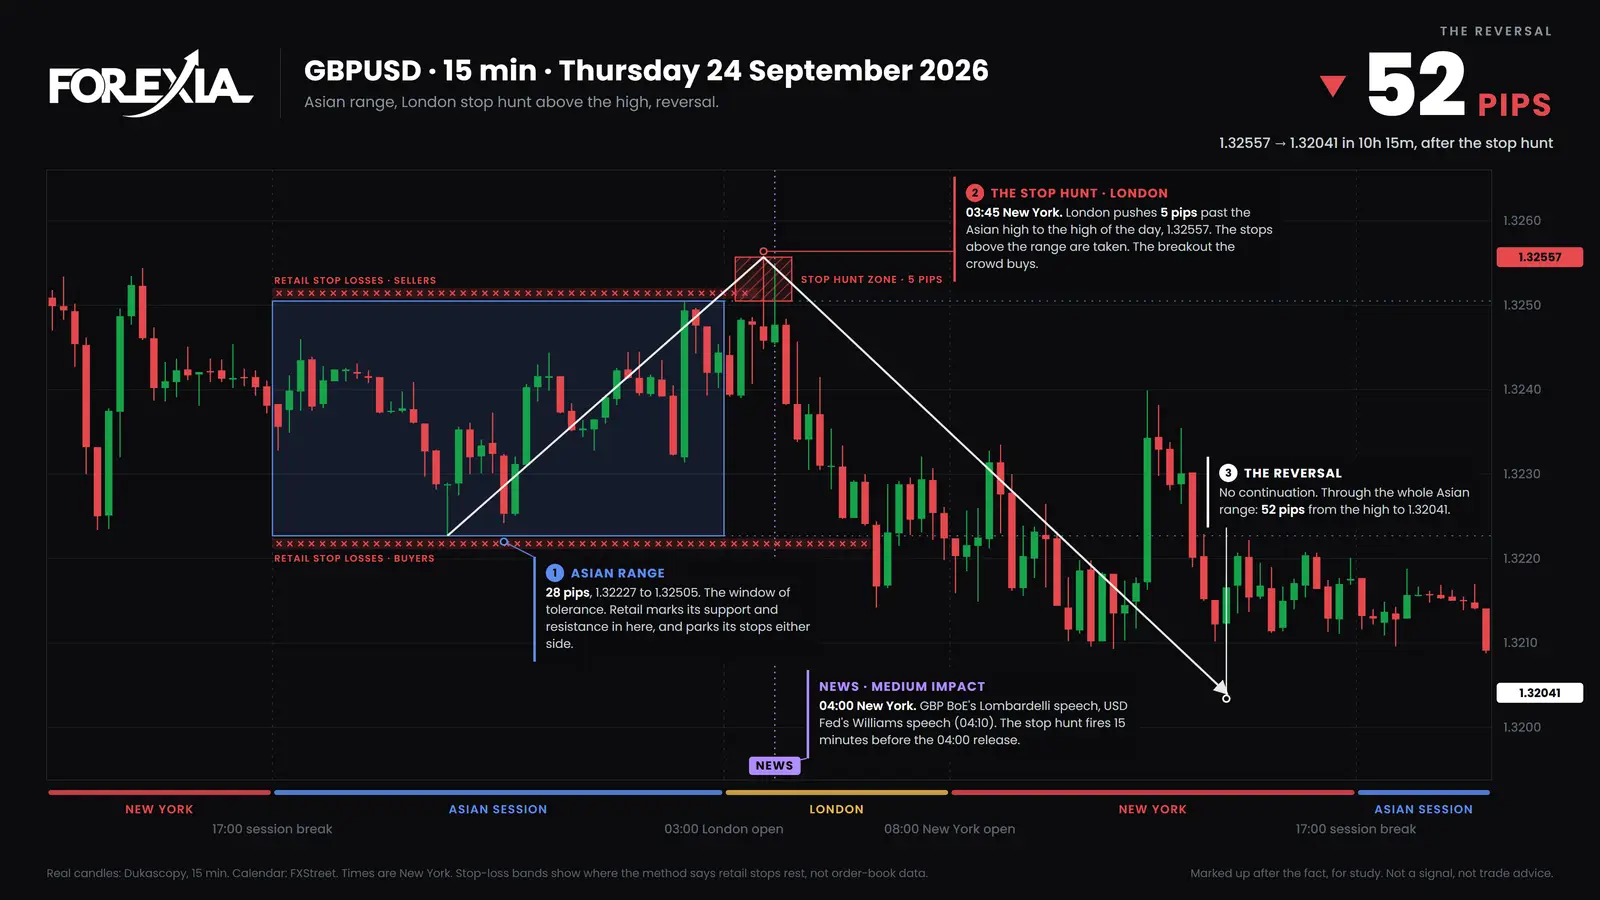
Stand in each seat while that candle is still open.
From the first, there is a breakout. If you are flat, you fear missing it. If you are short from the top of the box, you fear the stop. Those fears point at the same action: buy, now.
From the second, as we reason it, there is a pile of orders over the box. Anyone with size to sell needs buyers, and those traders are about to supply them. What a dealer fears we cannot say, and pretending otherwise would be making it up. That is why the diagram says so.
From the third, you know both of those stories, and you fear only acting too early. Nothing has been shown yet, because the candle is open. When it closed back inside, it showed that this push had not held, and that was all it showed. The fall to 1.32041, 52 pips, took until 14:00, and on Friday price traded back through that high by 8 pips. Our page on the Three Seats sets this candle out in a table.
Notice what the exercise did. It did not produce a forecast. It turned one feeling, urgency, into three separate statements, and you can check each of them against what happened.
What happens when the read changes during a day?
Then you do the exercise again, because each read describes only what has happened so far. NZD/USD on Wednesday 9 September 2026 changed three times before lunch, with nothing on our calendar at the first two turns.
The box ran from 0.58442 to 0.58630, 19 pips. The first London candle, at 03:00 New York, reached 0.58650, 2 pips over the top. The second closed at 0.58611, back inside.
First read, around 03:30. Retail bought the break and is losing. The observer's note: the push over the box has not held. An observer who stopped there would have called the day down, and for three hours that looked right. Price went through the bottom of the box and reached 0.58297 at 06:15, 15 pips under it and 35 pips off the high. On the way it took Tuesday's low of 0.58355.
Second read, around 07:30. Now the seats have swapped. The breakdown is the textbook trade, the sellers are the crowd, and their stops sit above. The 07:15 candle closed at 0.58452, back inside the box. By 09:30 price was at 0.58569, 27 pips off the low, and US ADP data at 08:15, medium impact, came during that rise.
Third read, around 11:15. The 11:00 candle opened at 0.58534, fell to 0.58393 and closed at 0.58400, back under the box. The day ended at 0.58377, nowhere much.
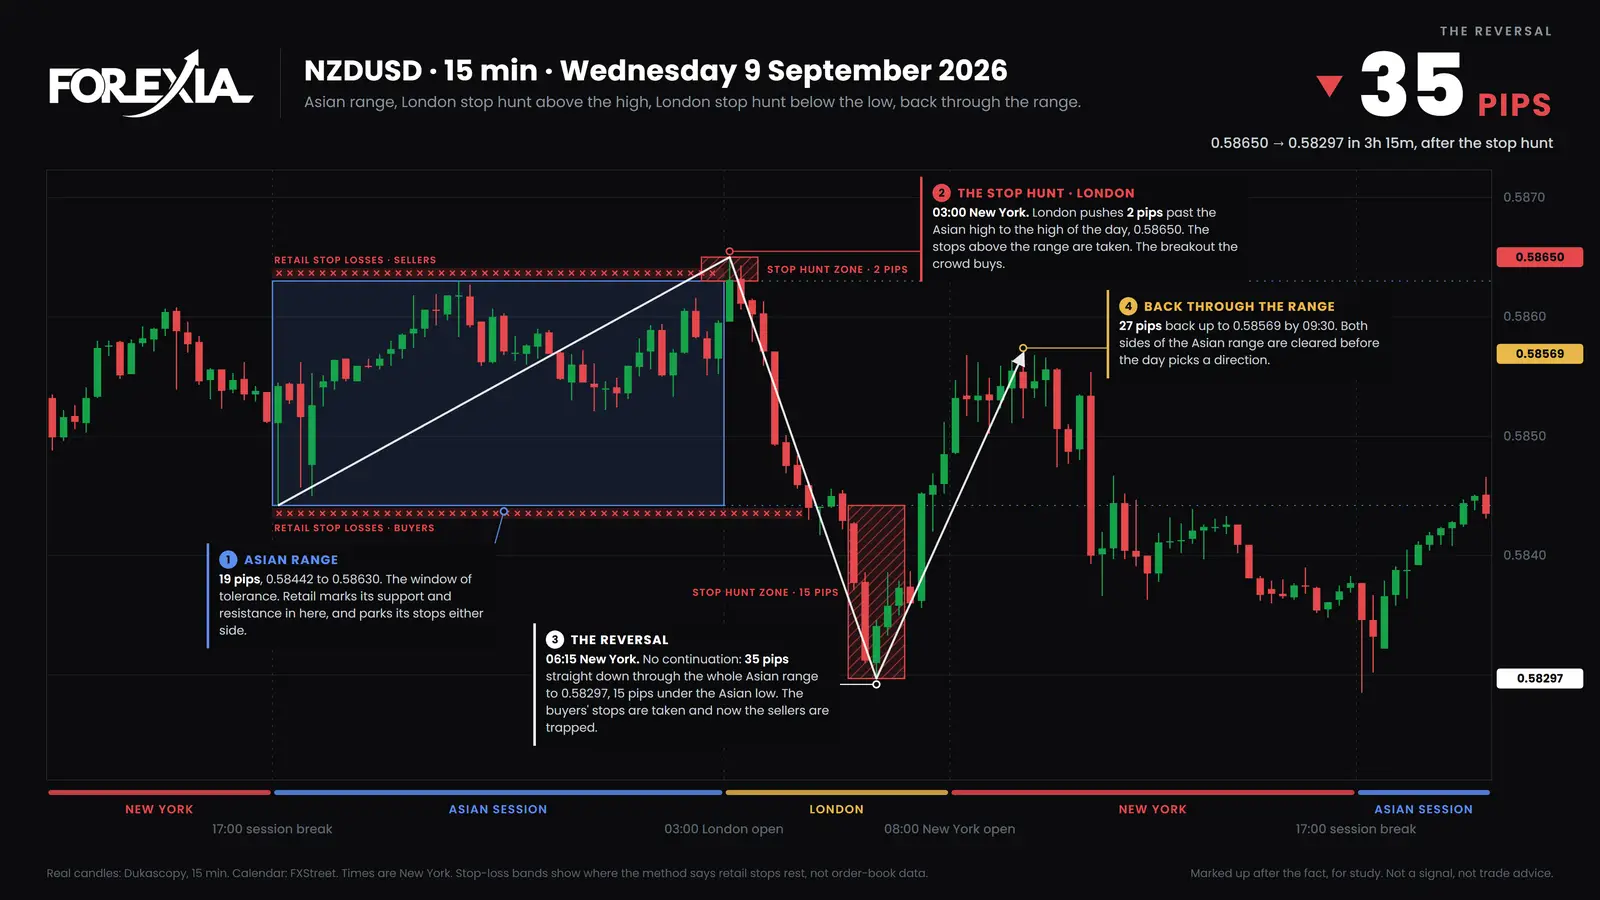
The observer's notes were accurate each time, and none of them said what came next. Anyone who treated the first one as a call on the day was caught by the second. That is the honest size of this idea: it tells you what each side has just been through. Both of these days reversed, and they are here for that reason. A turn seen afterwards is not a setup, and our own test of the setup as a mechanical rule did not make money.
How do you spot perceptual positioning?
You cannot spot it on a chart, because it is something you do and not a pattern. NZD/USD at 03:30 shows what it does and does not look like.
The retail note comes at once, because it is what we were taught: price went over the box, so buy. The market maker's note took more work on that morning: orders over 0.58630 that anyone selling size could use, which is the sort of place Liquidity Mapping marks. The observer's note was only that the push had not held. Written as "so the day is down", it had become a forecast, and by 07:15 it was wrong.
Timing showed too. Those notes are easy to write at 16:45 with the whole day on the screen. At 03:30, with 0.58297 still nearly three hours away, they were much harder. The wider comparison of retail and institutional traders has another candle to try it on.
Common mistakes
The glossary page lists the usual misreadings. These three come up when people start using it.
- Using the exercise to excuse a losing position. A buyer on NZD/USD at 03:00 who was under water by 03:30 could have told a story about what the dealers wanted next. Price was 35 pips off the high by 06:15, and the story had only kept the position open.
- Keeping an old read. The note at 03:30 was true, and by 07:30 it was out of date. A read has a time on it.
- Writing the second seat in the past tense as if it were fact. "They sold there" is a claim nobody can check. "Anyone selling size needed those buyers" is a reading, and it says so.
Course 1 of ForexiaPRO, Reading the Map, teaches this read step by step in lesson 1.1.2, Retail, Market Maker, Observer.
Frequently asked questions
Where does perceptual positioning come from?
From neuro-linguistic programming, where the exercise is called perceptual positions. Most NLP writers we read credit John Grinder and Judith DeLozier's 1987 book Turtles All the Way Down for setting out the first, second and third positions. Applying it to a chart, with retail, market maker and observer as the seats, is Forexia's.
Is there evidence that perceptual positioning works in trading?
We found none. No study we could find tests it on traders. A 2012 systematic review of NLP and health outcomes found little evidence, which its authors put down to thin research and not to proof of no effect. Treat this as a way of reading a chart, and not as a tested edge.
How do you practise perceptual positioning on a chart?
The NZD/USD day on this page shows what it comes to. A note written at 03:30 said what had just happened to each side, and a note at 07:30 replaced it. Writing such notes on a candle already closed is easy. Writing them on one still open is harder, which is why the written record is the part worth keeping.
Does perceptual positioning mean marketing positioning?
In marketing the phrase usually means how customers place a brand against its rivals, often drawn on a perceptual map. That has nothing to do with this page. Here it means reading one trading chart from three different positions.