Why Your Stop Loss Always Gets Hit: Placement, Timing, Size or a Hunt
Dylan Forexia9 min read
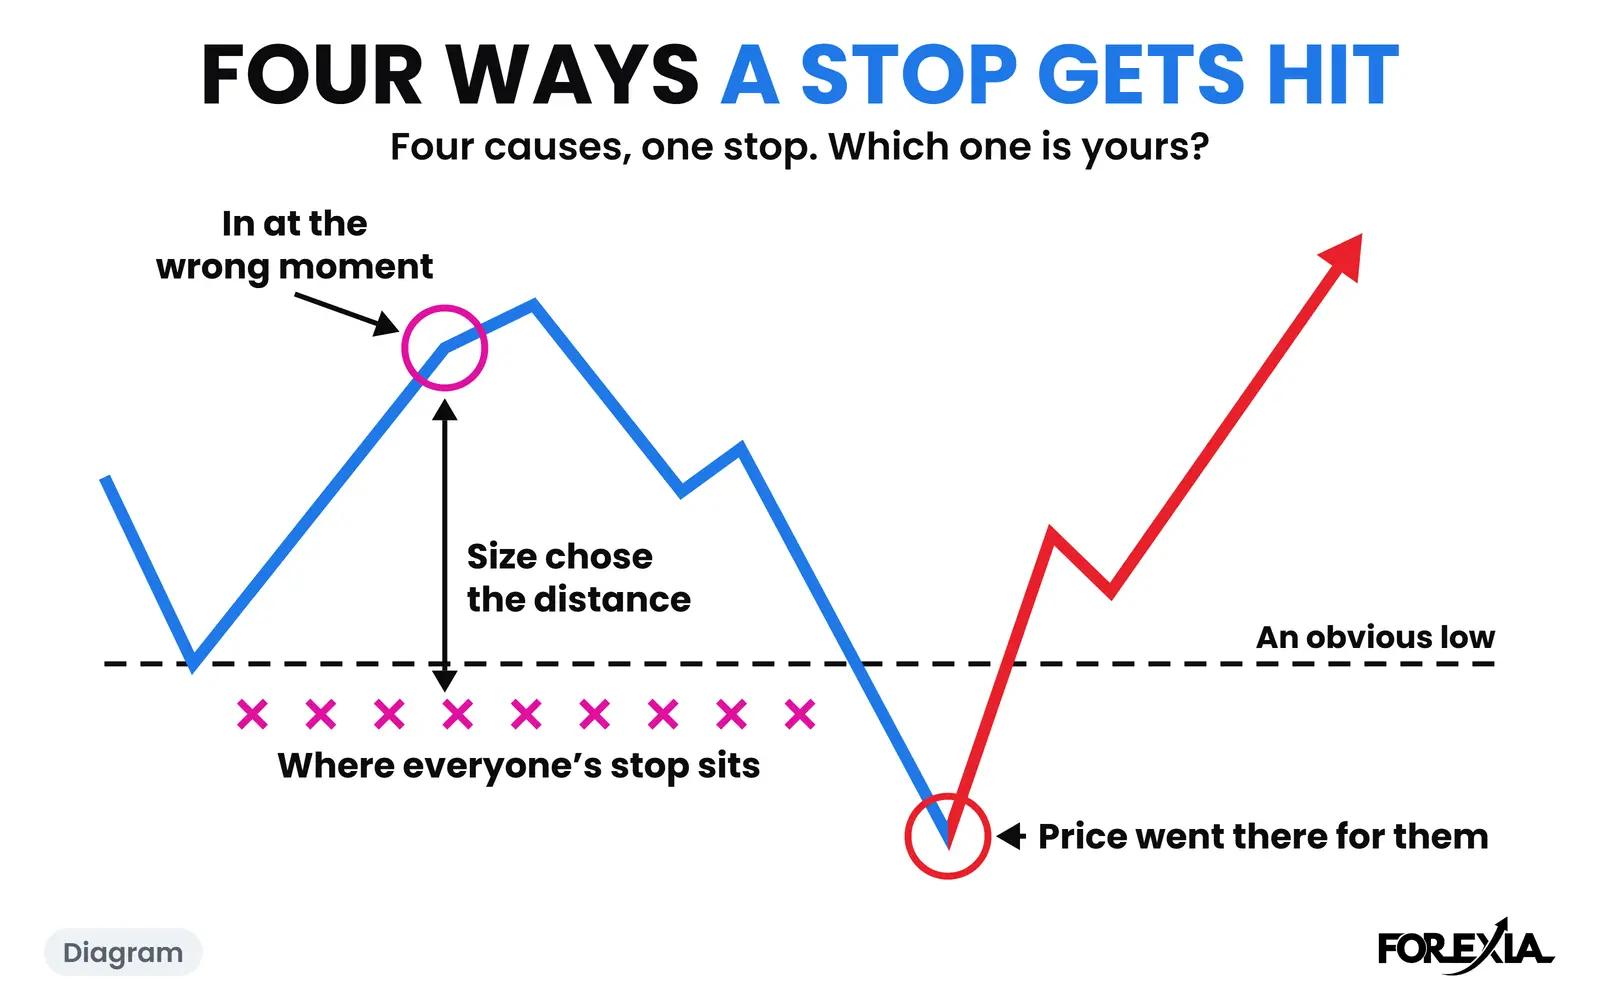
Your stop loss always gets hit for one of four reasons: it sits where everyone else's sits, you were in at the wrong moment, your position size chose the distance, or the market went to that level for the stops. Your last five losses can tell you which, using the check below.
It is one of the worst feelings in trading. You read the chart, you did the responsible thing and set a stop, and price took you out by a pip or two before going exactly where you said it would. We have been there too. After enough of those you start doubting the read, then the stop, then yourself.
Most advice on this says widen your stop. That answers one of the four causes at best, and it can make another one worse. So before you change anything, find out which one you have.
Why does my stop loss always get hit? Start by testing the word "always"
Memory is the first suspect. A stop that gets hit before a reversal hurts twice, so you remember it. A stop followed by more of the same feels like an ordinary loss, and you forget it.
So use your broker's history and leave your memory out of it. Take your last five stopped trades, every one of them, in order. For each, write down the pair, the date and time the stop was hit, your entry, your stop, the pips at risk, the share of the account at risk, whether you moved the stop, and what price did over the next few hours. If fewer of them reversed than you expected, you have already learned something.
The check: five questions for each loss
Ask them in this order, one loss at a time. Each one points to a cause, and a single loss can earn two verdicts.
1. Did price really reach your stop?
If the candle does not explain the fill, the cause is spread, which is a kind of placement. A buyer's stop is a sell order and fills at the bid. A seller's stop is a buy order and fills at the ask. Many retail charts draw only the bid, so a seller can be stopped by a candle that never touched the stop, and a buyer can be stopped by a wick that was only the spread widening. A stop also becomes a market order when it fires, so on a fast candle the fill can be worse than the stop.
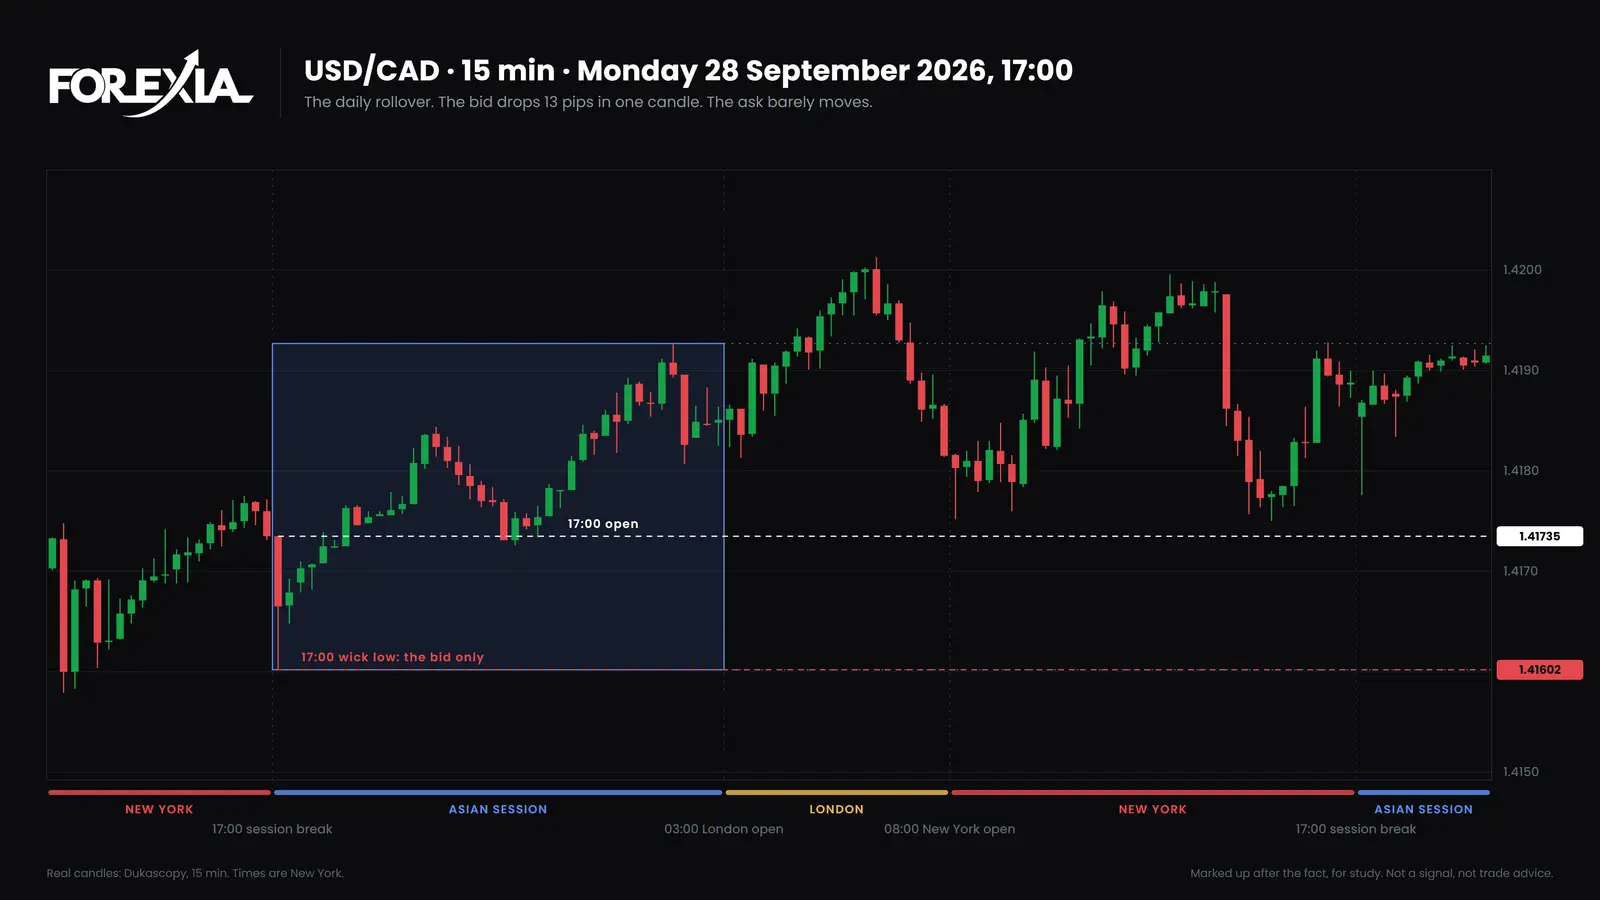
Look at the time first. The daily rollover at 17:00 New York is when spreads often widen. On Monday 28 September 2026, USD/CAD opened that candle at 1.41735 and the bid fell to 1.41602, 13 pips, in a quiet market. We checked the ask side of the same candle on the same feed and it barely moved. The whole wick was spread. By 18:30 the bid was back above 1.41735. A buyer's stop anywhere in those 13 pips was filled.
2. What was on the clock?
If the stop went within minutes of a scheduled release, or in the first candles of London or New York, the cause is timing. Check the economic calendar for that day and time. Your read may have been fine. You were holding when the extra orders arrived, and we read a release as the moment price is most likely to go for a pool, which is what we mean by News-Induced Liquidity.
3. How close was your stop to a line everyone can see?
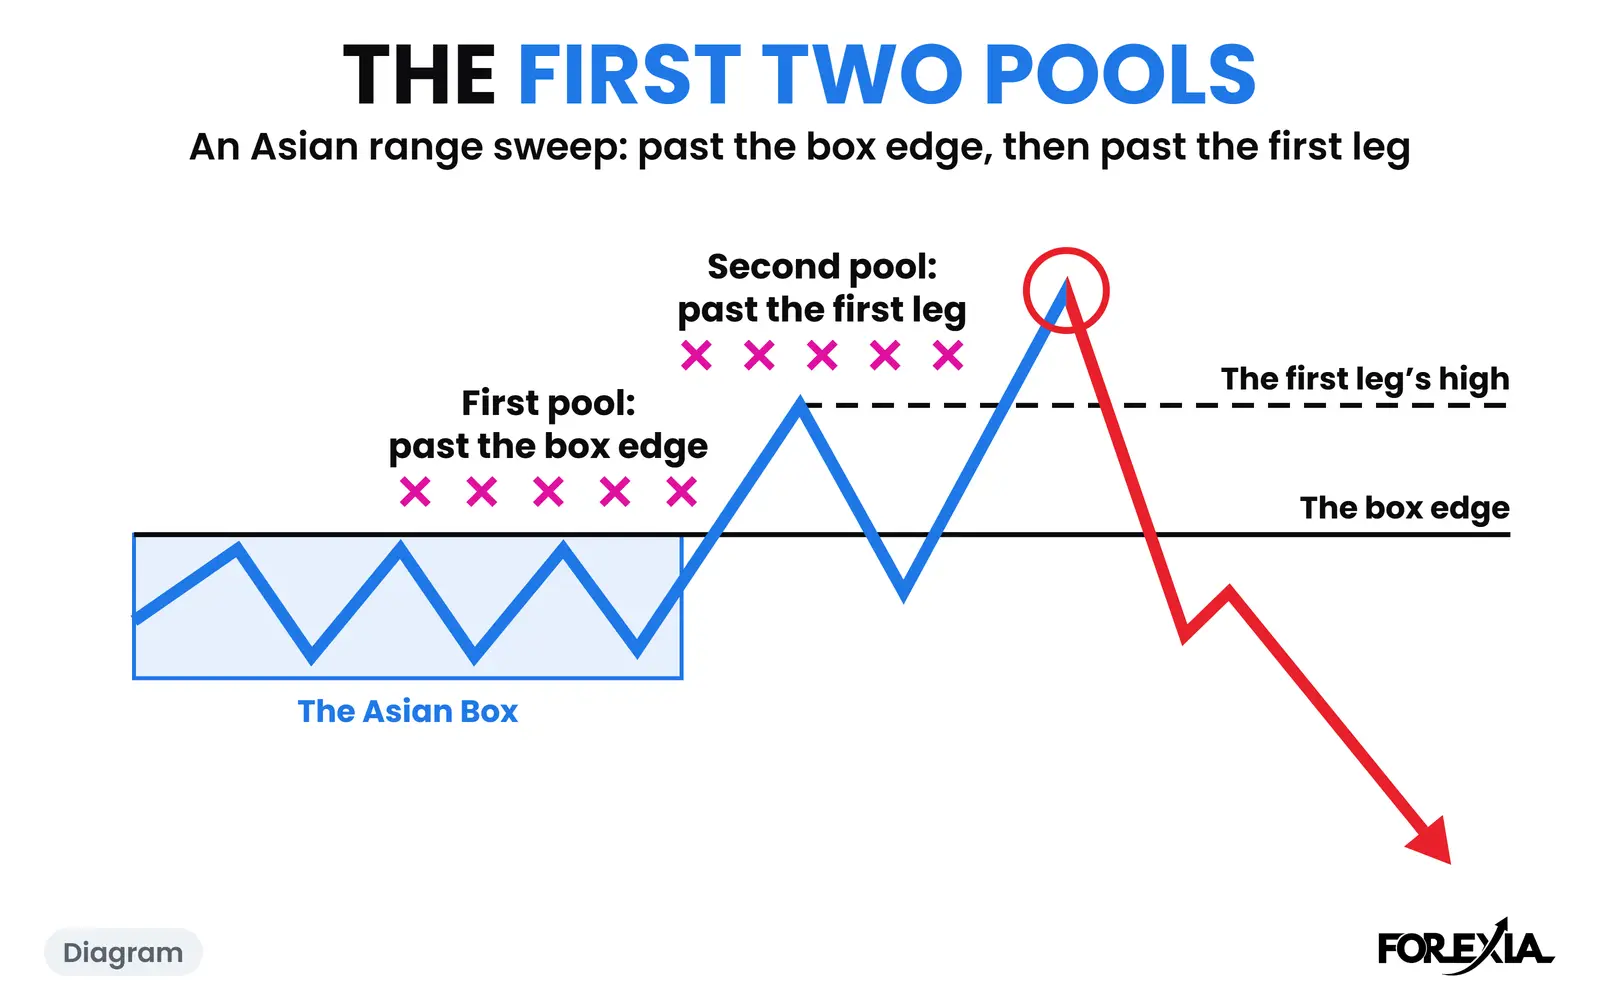
If you can point to an obvious line a few pips in front of your stop, the cause is placement. The usual lines are the edges of the Asian box, the previous day's high and low, the low of a double bottom, a flat top and a round number. A New York Fed study of a dealing bank's order book found stop-loss sell orders clustered just below round numbers and buy orders just above them.
Mark those lines as they stood before your trade. That habit is Liquidity Mapping. If your stop sits just past one of them, it sits in the pool.
4. Who chose the distance, the chart or your account?
If the stop is that far away because that is what the account could bear at that lot size, the cause is size. A stop should mark where the trade idea is proven wrong. When the position chooses the distance, the stop marks something else: the point where you can no longer stand the loss. A stop that is too tight is usually this cause in disguise, and so is a stop you moved closer after entry because the trade felt too big.
Measure it against the pair's average daily range, or its ATR if your platform shows it. AUD/USD's average daily range in early September 2026 was 44 pips, and one candle on the 4th was 36 pips long. Set your own stop against figures like those. Size is the one cause you can fix today, by trading smaller.
5. What did price do next?
If price closed back inside the level and then went your way, it was probably the stop hunt, what most traders call a liquidity sweep. If it went through and stayed through, your read was wrong and the stop did its job. That second answer is the one nobody wants, and it is the most useful.
The return inside the level is the close back. Why price does that belongs to another page: why price hits your stop loss and then reverses.
Two stops, one pair, one day apart
Here is the check run on AUD/USD on consecutive days. These are the stops the textbook would give, not trades anyone booked.
Thursday 3 September 2026: the stop did its job. The Asian box ran 14 pips, 0.71582 to 0.71724. A seller at the top has a stop just over it. London's second candle, at 03:15, ran to 0.71746, 2 pips over, and closed back inside at 0.71704. For half an hour that looked like a hunt. Then the 03:45 candle closed above the box at 0.71748, and from there price never traded back inside. It reached 0.72076 by 14:15, 35 pips over the box.
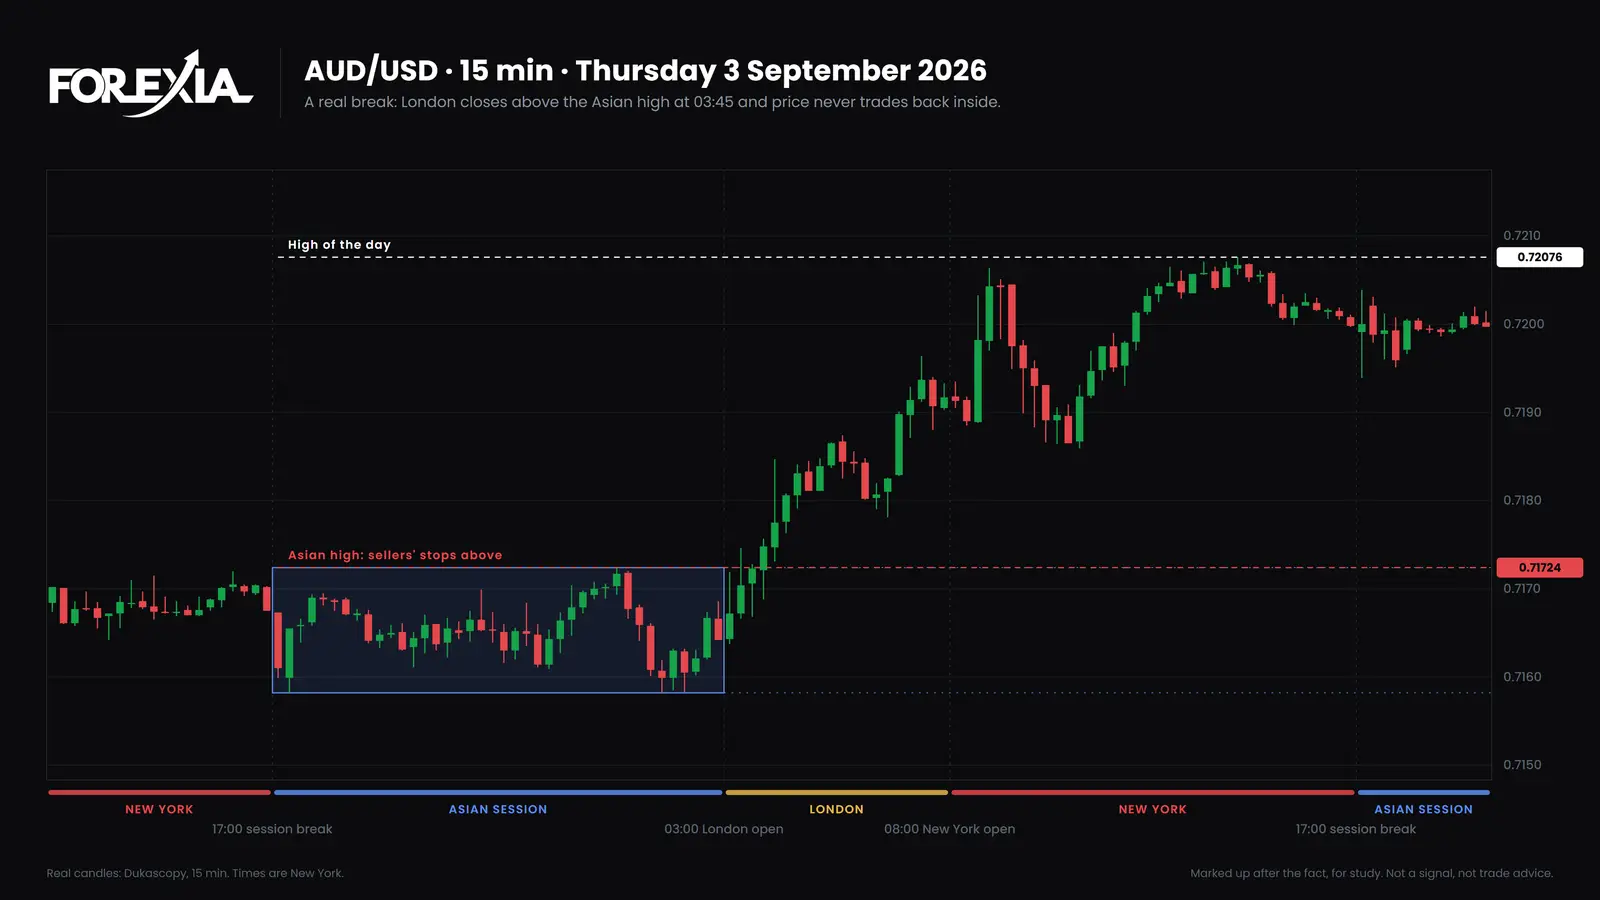
Run the check. Spread: no, the candle explains the fill. Clock: London's second candle, which is worth noting, with no high-impact release nearby. Placement: right on the line, and it made no difference. Next: it stayed through. The verdict is a wrong read and a stop that saved the rest of a 35-pip move. A wider stop would only have lost more. One close back proves nothing on its own, either: this one failed within 30 minutes.
Friday 4 September 2026: the same pair, the opposite answer. The box ran 20 pips, 0.71939 to 0.72142. A buyer at the bottom has a stop just under it. US jobs data was due at 08:30. That candle opened at 0.72097, fell to 0.71736 and closed at 0.71889: 20 pips under the box and 36 pips long, about nine times the day's average candle. The 09:15 candle closed back inside at 0.72052, and by 12:15 price was at 0.72121, 39 pips off the low.
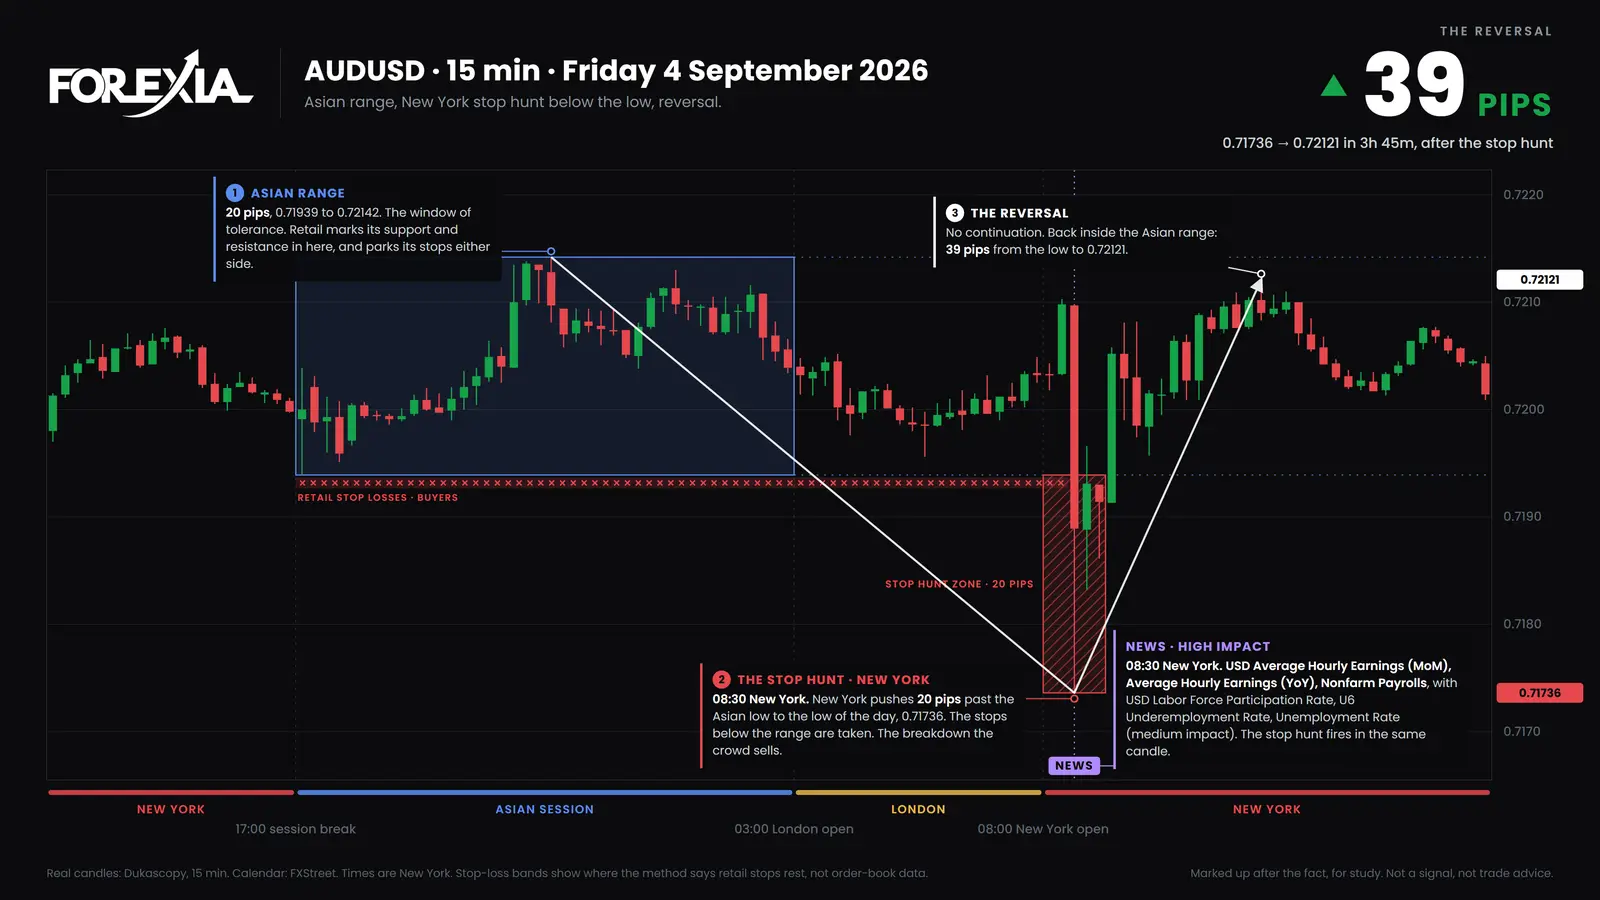
Run the check. Spread: it cannot explain a 36-pip candle. Clock: yes, the release. Placement: under the crowd's line. Next: it closed back and went the buyer's way. The verdict is timing and a hunt, two on one loss. The box's low on that chart is itself printed by a 17:00 candle, as on USD/CAD. The next-lowest candle, at 0.71951, was about a pip higher, so it changes nothing here.
A wider stop would not have helped. The same candle went 40 pips under the box on GBP/USD. No fixed distance covers that, and our own testing found no depth at which hunts tend to end. What would have changed this loss is not being in the trade at 08:30.
What does your tally say?
Count the verdicts across your five losses. The one that repeats is the one to work on.
- Spread: a time-of-day problem. Note the hours of your fills and turn on the ask line.
- Timing: the calendar comes before the chart.
- Placement: you are in the pool. Map the lines first and see how often your stop sits just past one. A few pips further rarely solves it, for the reason above.
- Size: the position is too big for the idea. Trade smaller until the chart can choose the distance.
- A hunt: your level was right and you were early. That is a question of reading the pool, and it is the good problem to have.
- A wrong read: your stops are working. Study the read and leave the stop alone.
Is my broker hunting my stop?
You usually cannot tell from one chart, and it is not the first thing to assume. The moves on this page are on a public price feed, so they do not need anyone at your broker to see your stop.
What you can check is simple. Compare the candle with a second feed at the same minute, allowing for spread, and ask your broker for the execution record of the fill. A fill no other feed can explain is worth raising with the broker, then the regulator. Do brokers hunt stops walks through that test, and is forex rigged separates what can be proved from what cannot. For the wider picture, start with stop hunting in forex.
What this check cannot tell you
Five losses are a place to start, not a sample. The verdicts are judgement calls, and you will be tempted to call every loss a hunt. The levels are readings too: nobody outside the market can see where stops actually rest, and the red bands on our charts are a reading of the structure, not order-book data. Our charts are marked up after the fact, so they are easier to read than a live screen.
Knowing why a stop was hit also does not make the next trade pay. Run as a mechanical rule, our own version of trading against the hunt did not make money. This is an audit of your losses, and that is all it is.
Course 3 of ForexiaPRO, Reverse Price Action, teaches how to read where a pattern's stops sit, starting in lesson 3.2.1.
Frequently asked questions
Should I just widen my stop loss?
Only if the check says the distance was the problem, and only with a smaller position, so the money at risk stays the same. A wider stop does nothing for a stop hit on a release candle that runs further than any stop you would set, and it costs more on a read that was simply wrong.
Why was my stop hit when the chart never touched it?
Usually the spread. A seller's stop fills at the ask, and many retail charts draw only the bid. Check the time of the fill first: the daily rollover at 17:00 New York is when spreads often widen. Then turn on the ask line.
Is my stop being hunted, or was it just too tight?
Look at what price did next. If it closed back inside the level and went your way, the stop may have been caught in a hunt. If it went through and stayed through, the read was wrong. A stop can be too tight and hunted at once, so give a loss two verdicts when it earns them.
Should I keep my stop in my head instead?
No. A mental stop does not move the level the market is going to, and it removes the limit on your loss at the moment you are least able to act on it. If the worry is that stops are being seen, the check on this page will show whether that is what your losses say.
How many losses do I need to check?
Start with your last five, taken from your broker's history and not from memory. That is enough to show a pattern worth looking at and not enough to prove one. Keep going and the tally gets more honest.