
The Trap: Why the Crowd's Averages Cross Late, and the Best Indicator for Scalping
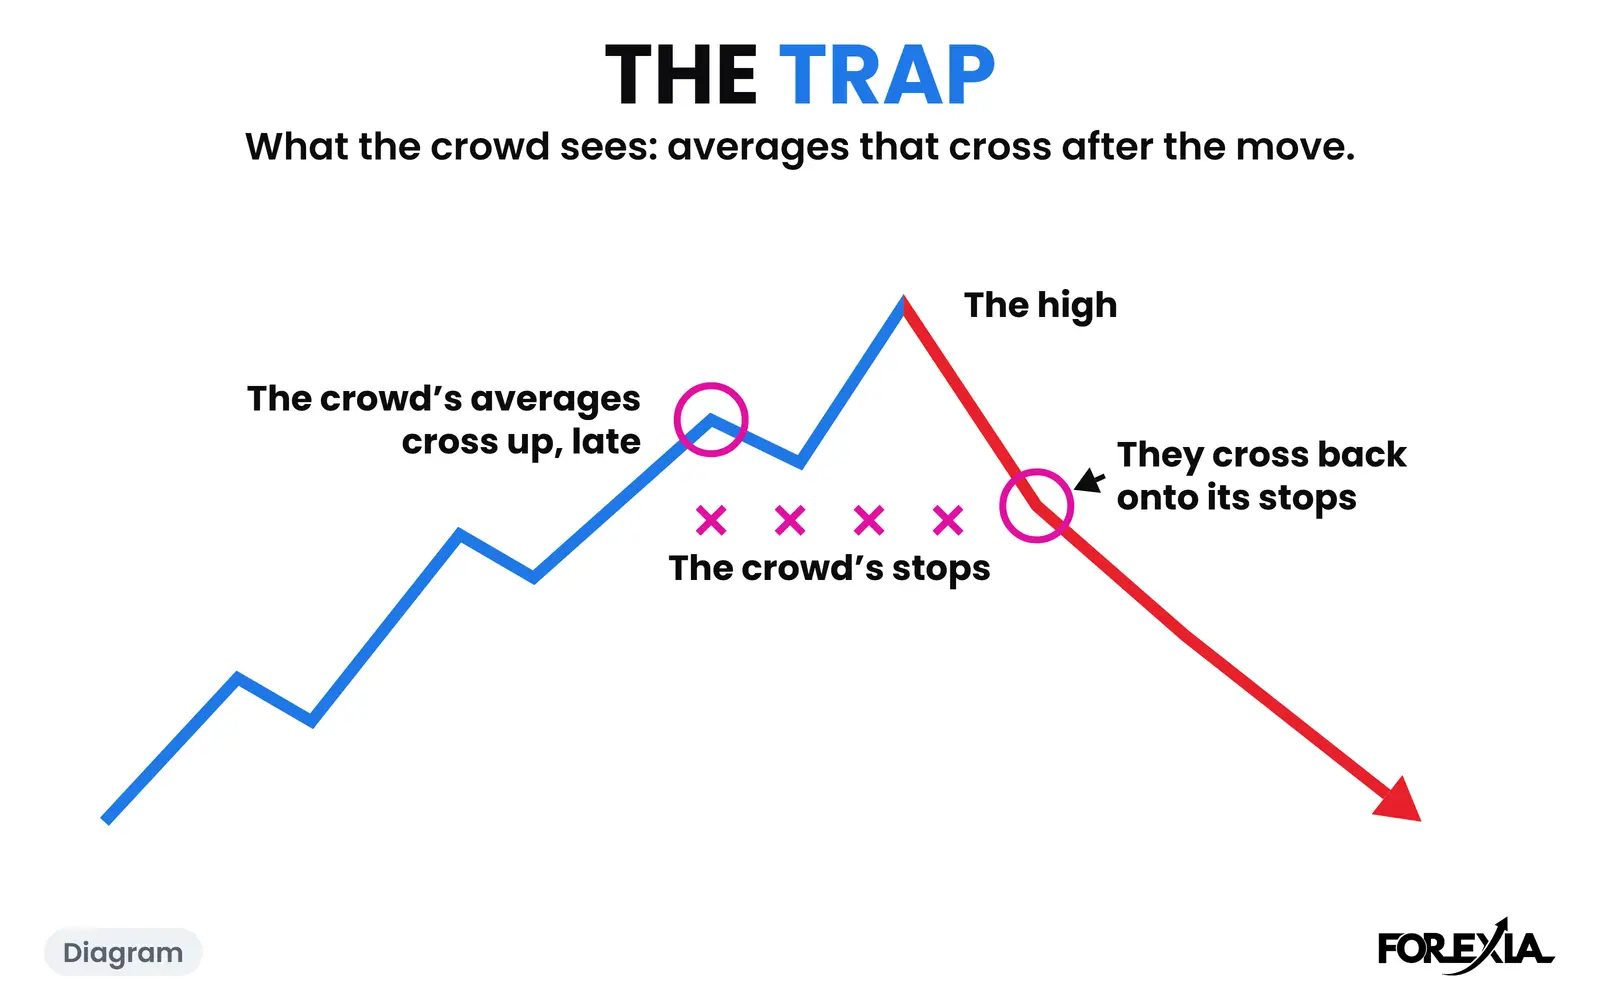
The Trap is the indicator trap: the averages cross late, pull the crowd in, then cross back onto their stops. An average is built from closes already printed, so its cross comes after the move that made it. That is also the honest start of an answer to "best indicator for scalping": every indicator is worked out from price that has already traded, so none of them can lead it.
What does the Trap look like on a chart?
It looks like a clean signal on the wrong side of the turn. The lines on this chart are labelled THE CROWD'S AVERAGES, 20 EMA and 50 EMA. They are what the crowd sees, drawn to show where it gets in. They are never our tool. On USD/CHF on Thursday 30 July 2026 they crossed twice, and only twice, in the whole day.
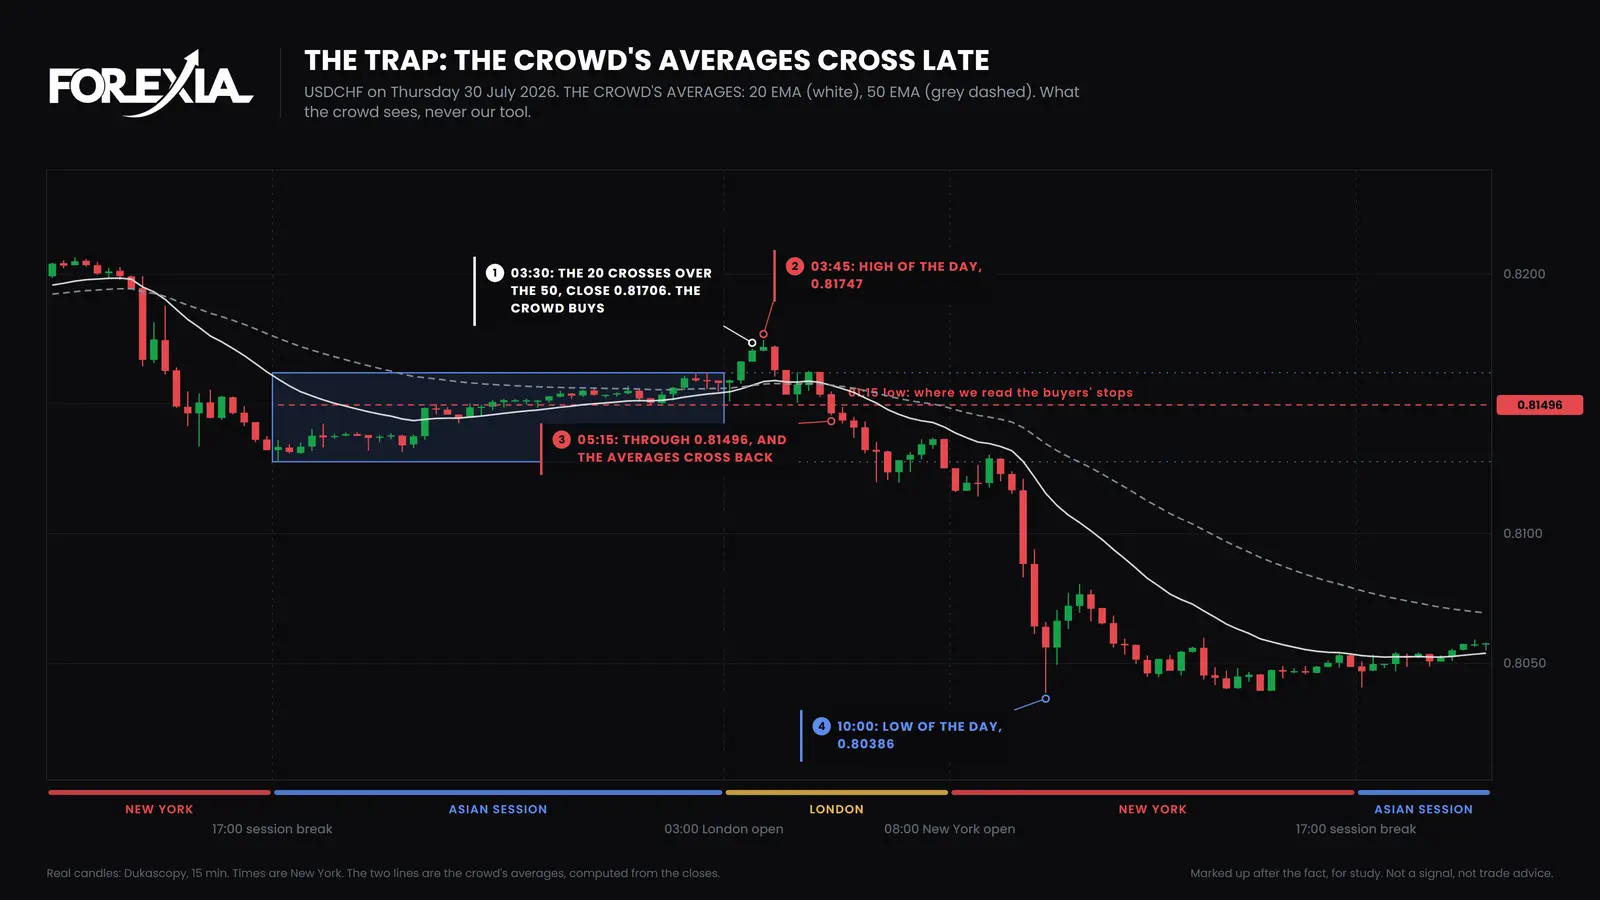
- The cross up, 03:30 New York. London's third candle closes at 0.81706, 9 pips over the Asian Box and its second close out of it: the London Breakout. The 20 crosses over the 50, and the crowd buys. From the low since the last cross, 0.81308 (leaving out the wick at the session break, often only the spread), the rise would reach 44 pips. At this close, 40 were done.
- The high, 03:45. The very next candle makes the high of the day, 0.81747: the Stop Hunt, what most traders call a liquidity sweep.
- Their stops, 05:15. We read a cross buyer's stop as sitting behind the last swing before London, here the 01:15 low at 0.81496. That is our reading, not something the chart records. This candle trades to 0.81456, closes at 0.81464, and the averages cross back down on the same candle, 28 pips under the high.
- After. The low of the day, 0.80386, comes at 10:00, 136 pips under the high.
The second cross is worth a fair look: it came with 28 of those 136 pips done. A cross is not always that late, and that is why the crowd keeps using them. The Trap is the pair: the crowd buys near the top, and is stopped by the same fall that gives the next signal.
The Trap and the best indicator for scalping: what is the connection?
The search asks which indicator. The Trap asks what any indicator does to the people using it. The guides mostly recommend a 9 and 21 EMA crossover, then add a stochastic, RSI or VWAP to filter it, and the better ones admit no reliable published ranking exists. Each filter is one more reading of past prices.
A faster setting crosses sooner and more often than our 20 and 50. It does not change the order: closes first, cross after. And a cross, on any setting, is a crowd getting in at one moment with its stops behind the same swing. From the market maker's seat, that is a pool.
We are not saying no one profits with averages. We are saying what they cannot do. Why moving average crossovers fail goes further, and price action trading without indicators covers the other way of working. The stop hunt guide shows where those stops go.
How late do the crowd's averages cross?
Nearly two thirds of the way through the move, at the median. We ran the 20 and 50 EMA over 15-minute closes on seven majors and gold, and took every cross from the London open to 17:00 New York between 6 April and 1 October 2026. That gave 1,132 crosses. A cross's move runs from the furthest price against its signal since the previous cross, to the furthest price with its signal before the next cross.
- The median cross came with 63% of its move already done.
- The middle half of crosses came with between 42% and 82% done.
- 394 came with at least three quarters done.
- 444 had crossed back before 17:00 the same day.
The end of a move is known only afterwards, so nobody at the screen can read these percentages. This counts candles, not trades: no entry, stop or cost. It says how late a cross came, never what to do at one.
How do you spot the Trap?
On 30 July, start from the cross itself. At 03:30 the rise from 0.81308 had 40 of its 44 pips behind it, and the high came one candle later. Then look behind it. The 01:15 low at 0.81496 is where we read the buyers' stops, and it went at 05:15. The averages are on this chart to show that, and then they come off. What is left is a level, and levels are what we read.
What do traders get wrong about the Trap?
Four things cost the crowd most that day.
- Buying at 03:30. The cross came one candle before the high of the day.
- The stops under 0.81496. They went on the 05:15 candle, an hour and three quarters after the cross.
- Holding until the averages turned. A buyer who did was still in at 05:15, 28 pips under the high.
- Fading every cross. The word does not say that. Our own test of the setup as a mechanical rule did not make money, and a reversal seen afterwards is not a setup.
Which words does the Trap lead into?
Four sit next to it.
- The NPC: the trader who follows the trend, trades the textbook pattern and asks no questions. The label describes behaviour, not intelligence.
- The Third Tap: the perfect third touch of a level, where the trap is set.
- The London Breakout: the move out of the Asian range at the London open, where retail enters for the continuation.
- Dumb Money: the predictable retail herd, entering on the textbook signal with its stops where everyone else puts them.
Where is the Trap taught?
Course 3 of ForexiaPRO, Reverse Price Action, teaches this read step by step in lesson 3.1.4, The Trap: the Crowd's Averages Cross Late.
Related words
Frequently asked questions
What is the best indicator for scalping?
No indicator can be best in the sense people hope, because every one is worked out from prices that have already traded. The 9 and 21 EMA crossover is what guides recommend most, and the more honest ones say no reliable published ranking exists. Test any claim yourself. Forexia reads where the crowd's stops sit instead of using an indicator.
Why do moving average crossovers come late?
An average is built from closes already printed, so price has to move before the average can cross. In our count of 1,132 crosses of the 20 and 50 EMA on seven majors and gold, from 6 April to 1 October 2026, the median cross came with 63% of its move already done. That is measured afterwards, on candles, not trades.
Does Forexia use the 20 and 50 EMA?
No. They are the crowd's averages, not our tool. Where they appear on our charts they are labelled, to show what the crowd sees and where it gets in, and then we take them off.
Would a faster setting fix it?
A 9 and 21 EMA crosses sooner than a 20 and 50, and more often. It is still closes first and the cross after, and each extra cross is another moment the crowd gets in together with its stops behind the same swing.