Why Moving Average Crossovers Fail: The Crowd's Averages Cross Late, Then Cross Back
Dylan Forexia7 min read
Moving average crossovers fail because an average is made of closes already printed, so the cross arrives after the move that made it. The crowd that acts on it gets in late, all at one moment, with its stops behind the same swing. In our count of 1,132 crosses, the median came with 63% of its move already done.
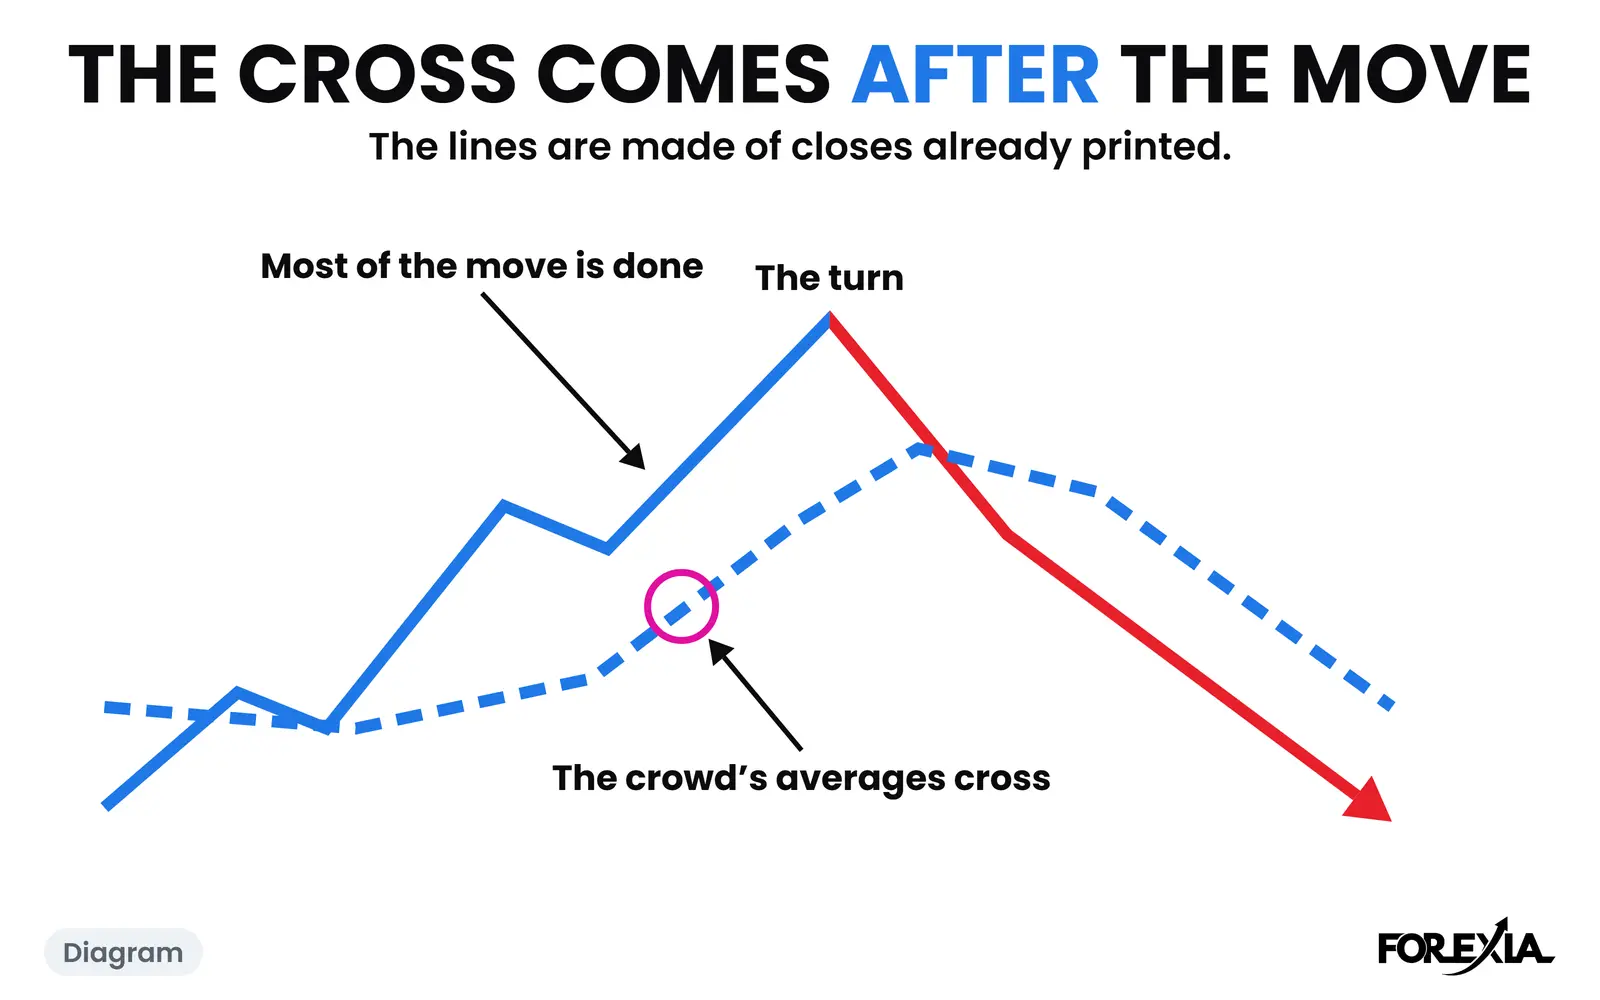
Our word for this is The Trap: the averages cross late, pull the crowd in, then cross back onto their stops. The averages on this page are the 20 and 50 EMA, drawn and labelled as THE CROWD'S AVERAGES. They are what the crowd sees, and they are never our tool.
Why moving average crossovers fail: the arithmetic
An exponential average gives each new close a fixed share of the weight. For a 20 EMA that share is 2 divided by 21, about 9.5%. For a 50 EMA it is 2 divided by 51, about 3.9%. The rest is old price. So one candle moves the shorter line by about a tenth of the gap to price, and the longer line by about a twenty-fifth.
That is why a cross is late by construction. For the 20 to catch the 50, price must already have travelled, and travelled long enough to drag both. The usual remedies change the timing and not the order. A faster pair crosses sooner and more often. A simple average crosses later and wobbles less. A filter such as ADX is another calculation on the same closes. The order stays the same on every setting: closes first, cross after.
A sideways market does the other damage. Both lines flatten and sit close together, so small swings flip their order, and each flip is a signal. The same logic runs on a daily chart, where it is called a golden cross, though our count below is 15-minute candles only.
How late do the crowd's averages actually cross?
We ran the 20 and 50 EMA over Dukascopy's 15-minute closes on seven dollar majors and gold, and took every cross from the London open to 17:00 New York, from 6 April to 1 October 2026. That gave 1,132 crosses, from 120 on gold to 154 on USD/CHF, about one per market per day. A cross's move runs from the furthest price against it since the previous cross, to the furthest price with it before the next one.
- 63% of the move was done at the median cross. The middle half of crosses ranged from 42% to 82%.
- 394 crosses came with at least three quarters done.
- 444 crosses had crossed back before 17:00 the same day.
- In size, the median cross had 39% of an average day's range behind it, and the median left in front was 24%.
That last line is the one to look at. Set against a day's range, the crowd's signal arrives with more of the move behind it than ahead. Costs and a stop come out of what is ahead. It is measured afterwards, on candles and not on trades, and the end of a move is known only once it has happened, so nobody at the screen can read these figures live. They say how late a cross came. They do not say what to do at one.
Two signals on the wrong side of the turn: gold, 17 July 2026
Gold on Friday 17 July 2026 gave the crowd three crosses. On gold $1 counts as 1 pip, and times are New York. The Asian session ran 3970.41 to 4008.39, and the averages crossed up at 03:15 and stayed up through London.
At 08:30, with housing starts and building permits out, a candle fell from 3987.13 to 3965.26 and closed at 3969.41. The 20 crossed under the 50 on that close, and the crowd sold. Measured from the high since the last cross, 4002.16 at 05:15, to the low that followed, the fall was 43 pips, and 33 were done.
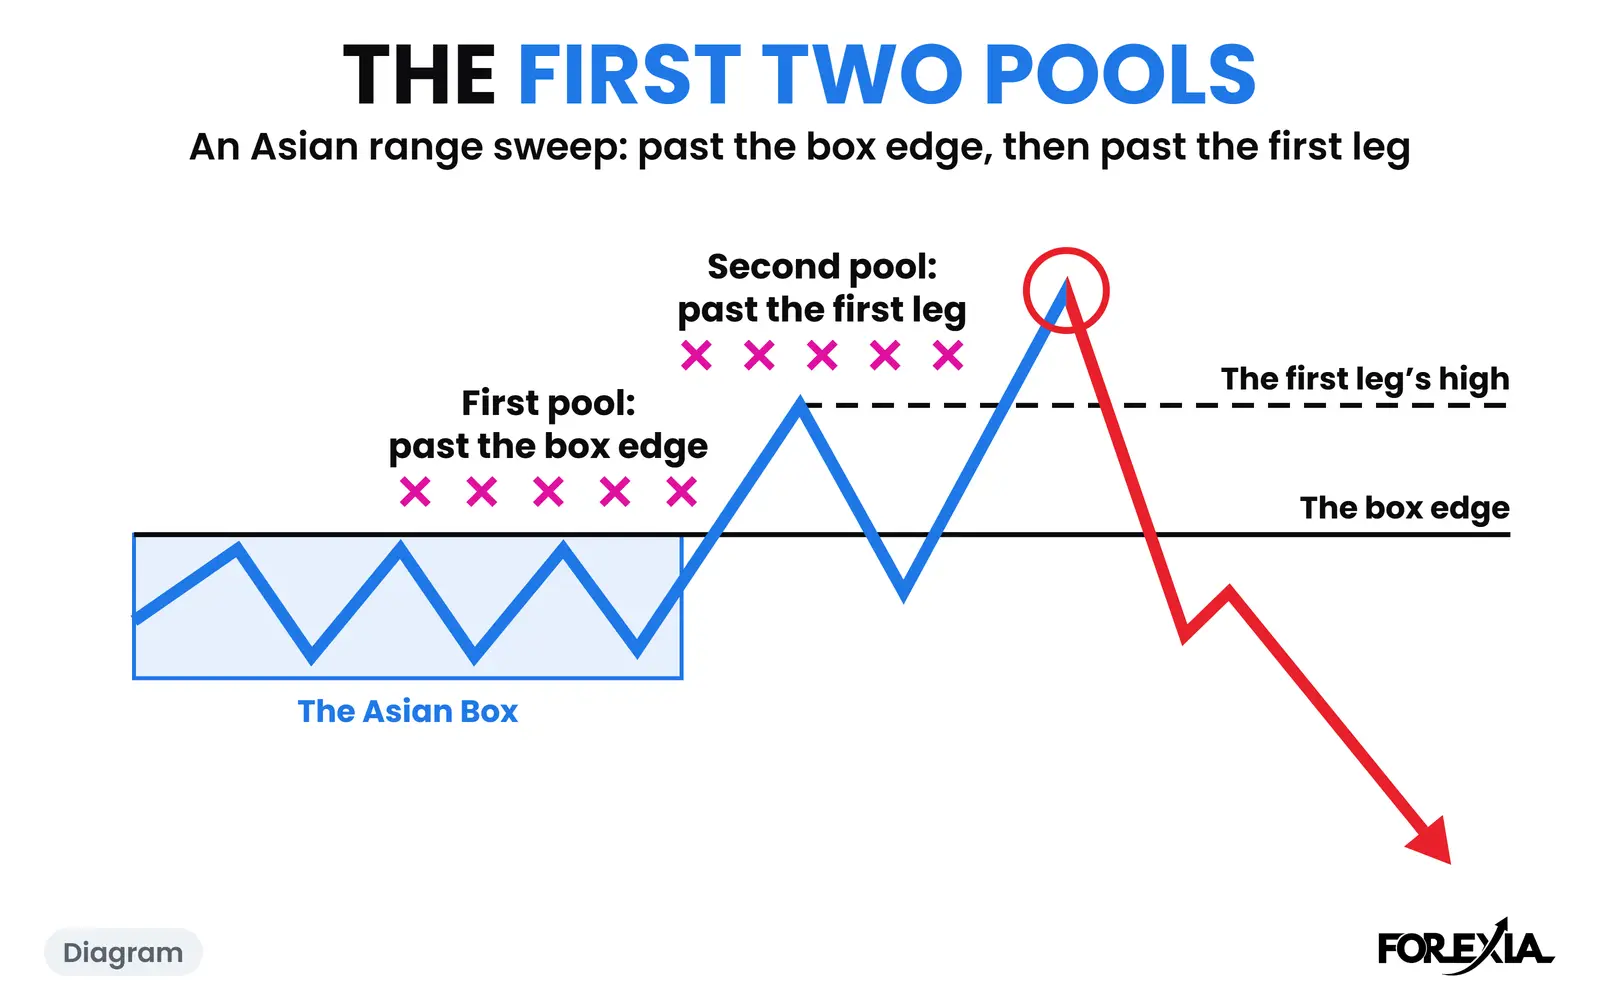
Where did those sellers' stops go? A chart cannot record that. We read a cross trader's stop as sitting behind the recent swing, which here is the 07:45 high at 3998.59. Hold that line.
The low of the day came at 09:00, just 30 minutes after the cross: 3959.49, about 10 pips under Thursday's low of 3969.05. We read that as the stop hunt, a liquidity sweep of the buyers' stops under that low. Then the 09:30 candle opened at 3968.24, ran to 4003.45 and closed at 3984.82. That is 44 pips from the low and 5 past our stop line, with the averages still pointing down.
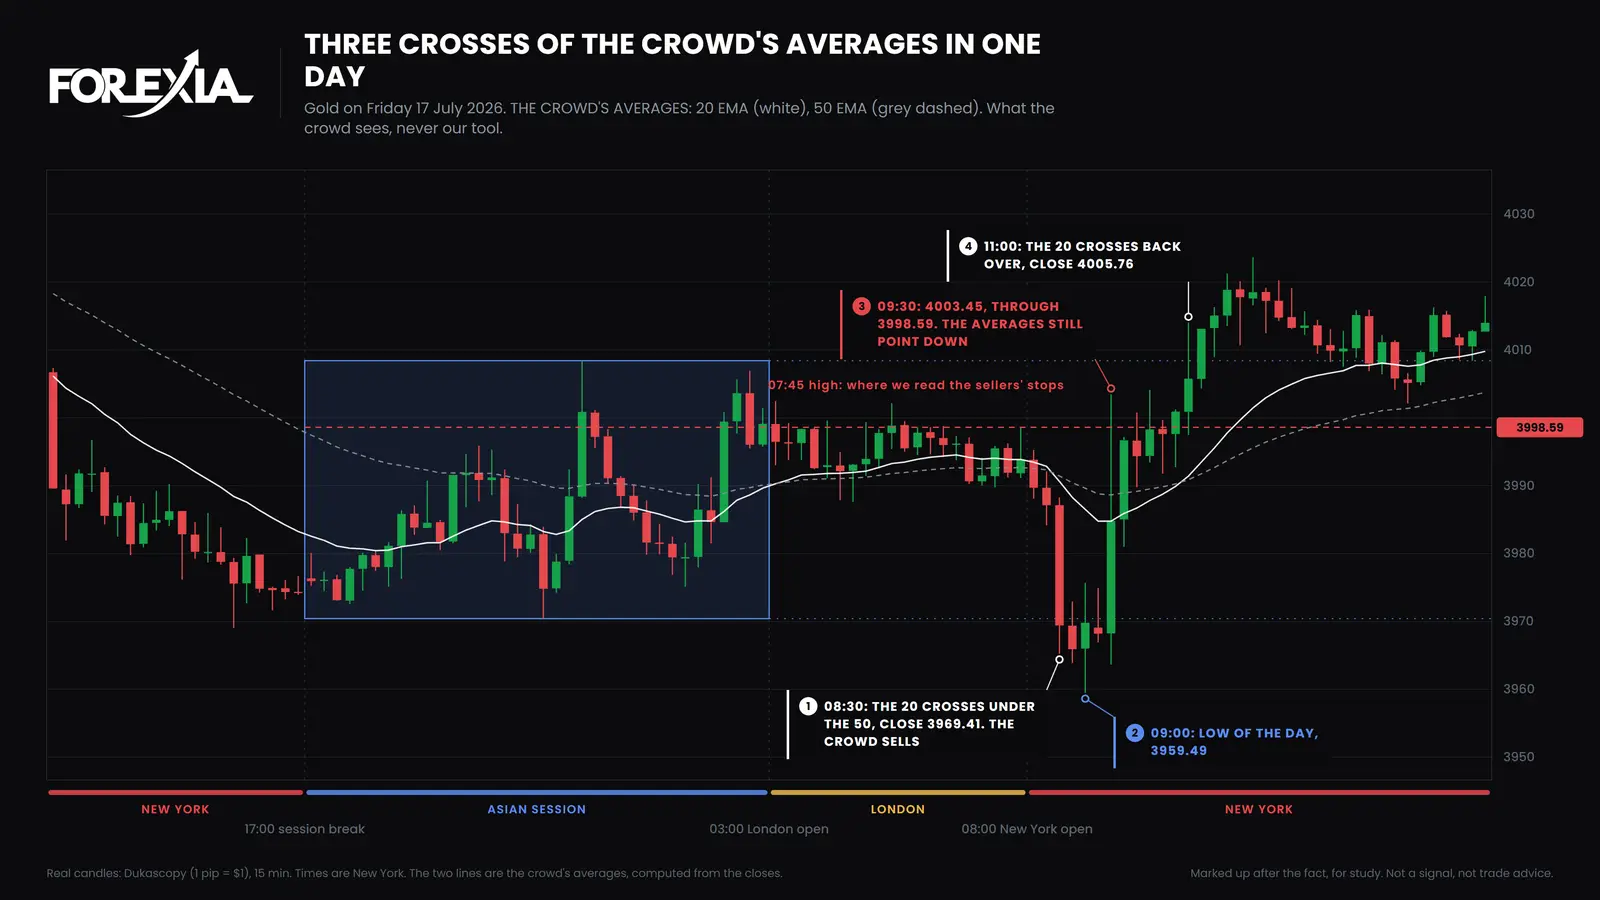
They crossed back up at 11:00, closing at 4005.76. Of the 64 pips from the low to the day's high, 4023.64, 46 were already gone. The day ended at 4013.97, so a buyer on that cross was ahead at the close, by 8 pips. A cross is not always wrong, which is why people keep using them. But a trader following the lines sold within 10 pips of the low, was stopped, and bought back 46 pips over it.
Late one way and early the other: USD/CHF, 30 July 2026
USD/CHF on Thursday 30 July 2026 crossed only twice all day. The Trap's page walks through its stops, so here is what the pair of crosses shows.
The cross up came at 03:30, closing at 0.81706, with 40 pips of a 44-pip rise behind it, measured from 0.81308 with the 17:00 rollover wick left out. The next candle made the high of the day, 0.81747. The cross down came at 05:15, closing at 0.81464, 28 pips under the high. By 10:00 price had reached the low of the day, 0.80386, 136 pips under the high. Core PCE and GDP were out at 08:30.
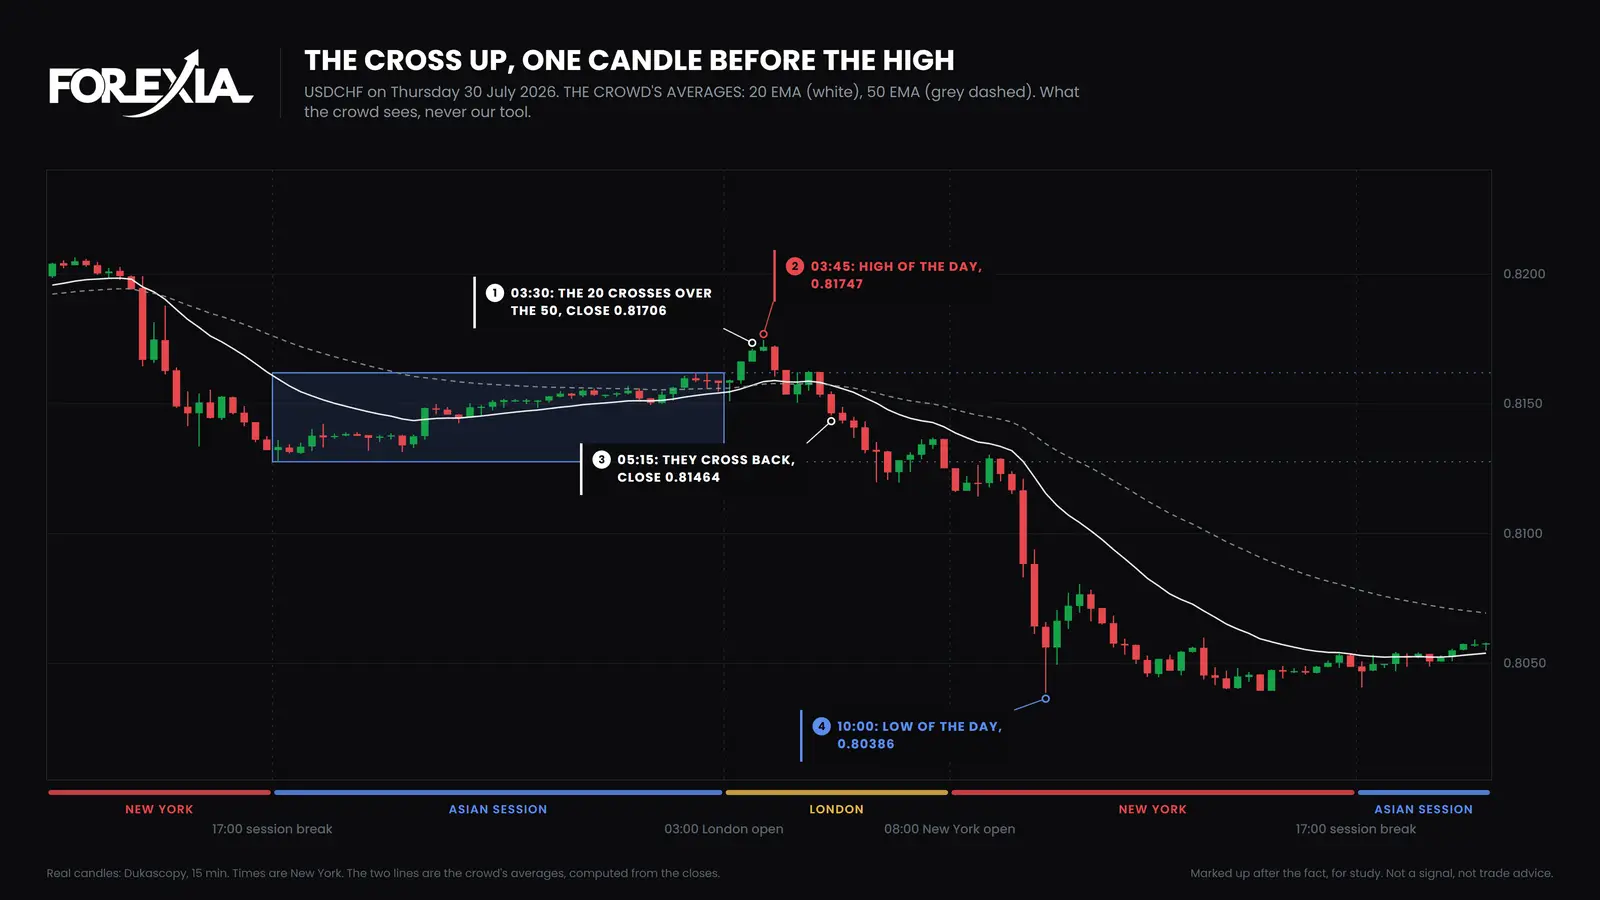
So the same two lines were about as late as they can be on the way up, and early on the way down: 28 of 136 pips done. Nothing on the screen at 03:30 or 05:15 said which kind of cross it was. A count of the median tells you how crosses behave on average, and on any one day it can be far out either way. This day is here because it turned, and a turn seen afterwards is not a setup.
What does each seat see at a cross?
The cross means something different from each of the three seats:
- Retail sees a signal. A clean event with no judgement in it, which is the appeal. The trader we call the NPC takes it as given, and Dumb Money arrives together.
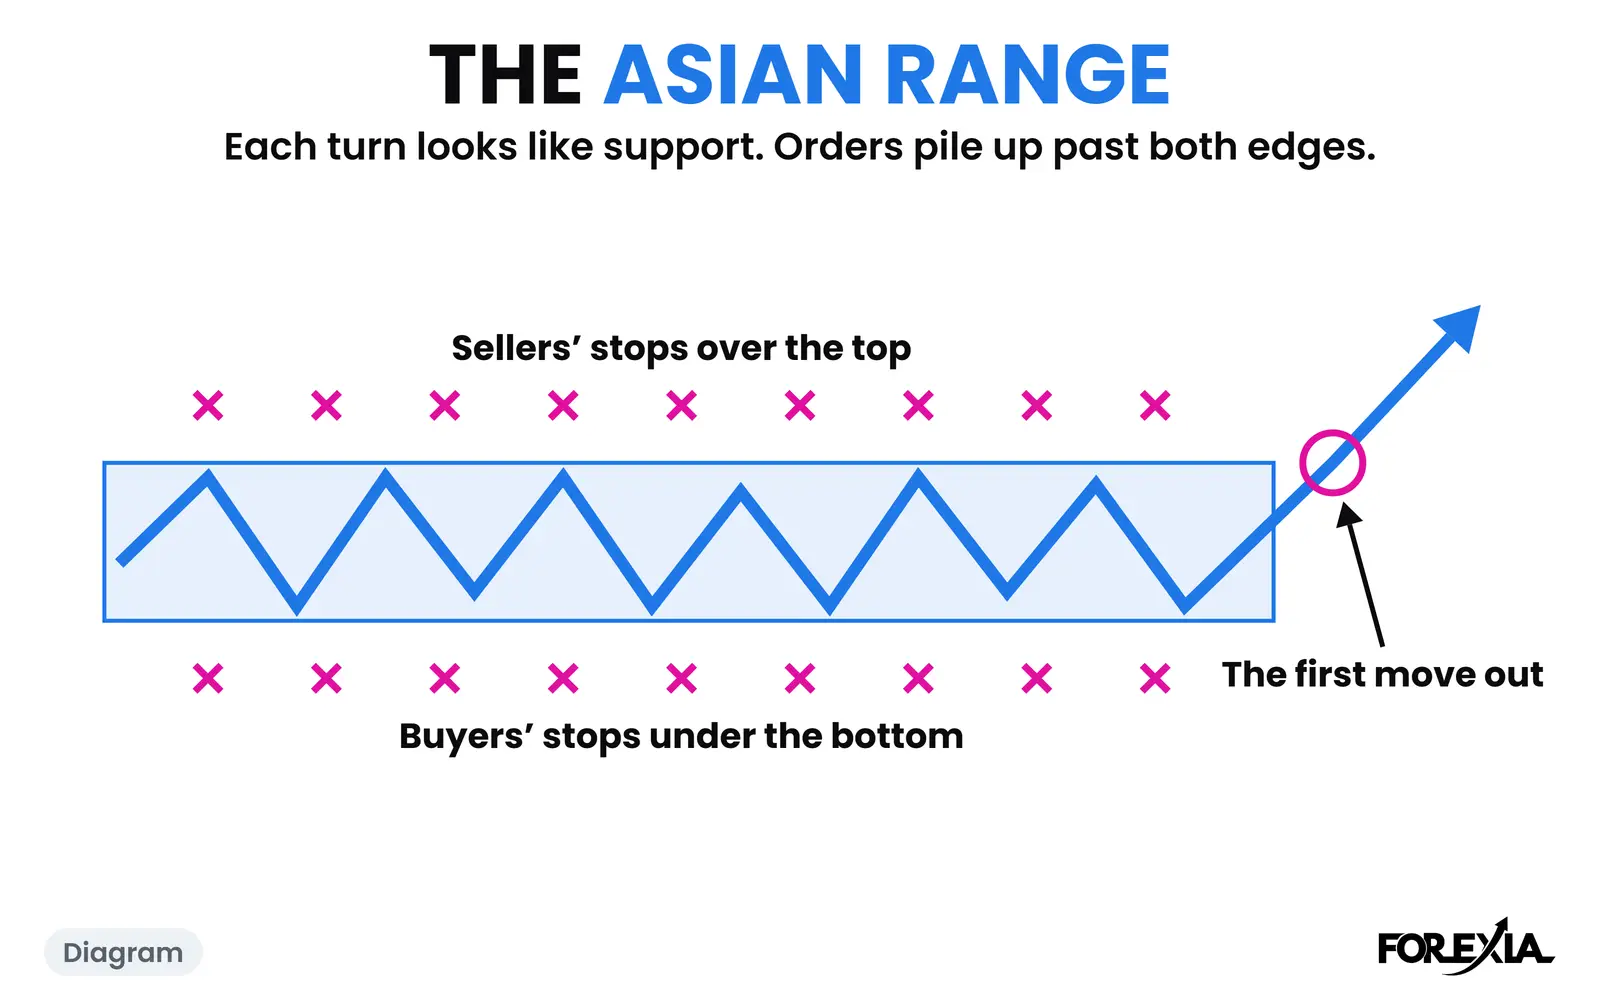
- The market maker, as we read it, sees a crowd getting in at one moment with its stops behind the same swing. That is a pool with a time on it.
- The observer sees the arithmetic. The observer can say how much of the move was gone, and take the averages off the chart. What remains is a level, and levels are what we read.
Is a better setting or a better indicator the fix?
We have no evidence that one is. We know of no reliable ranking of indicators, and no setting changes the order of closes and cross. In our own test of the Forexia setup as a mechanical rule, a 50, 200 and 800 EMA trend rule added to it showed no measurable effect, and neither did RSI divergence. Our setup itself did not make money as a fixed rule, so we are not offering a replacement that does.
We are not saying no one profits with averages. An average can be a fair picture of trend, or an alert for a person to judge. It knows only what the candles know. Readers asking for the best indicator for scalping will find the same answer on that page, and the same crowd logic explains why double tops and double bottoms fail. For the rest of price action trading, without any indicator, start at the hub.
Common mistakes
Each of these treats a line as if it knew more than the candles.
- Expecting the line to be early. On USD/CHF the cross up came one candle before the high of the day.
- Treating the cross back as fresh news. On gold it came 46 pips over the low.
- Tuning the settings until an old chart looks right. A faster pair crosses sooner and more often, and every extra cross is another moment a crowd gets in together.
- Fading every cross. The word does not say that. USD/CHF's cross down was early, and the fall ran another 108 pips.
Course 3 of ForexiaPRO, Reverse Price Action, teaches this read step by step in lesson 3.1.4, The Trap: the Crowd's Averages Cross Late.
Frequently asked questions
Why do moving average crossovers come so late?
Because an average is built from closes already printed, and a cross needs the shorter average to catch the longer one. Price has to travel first. In our count of 1,132 crosses of the 20 and 50 EMA, from 6 April to 1 October 2026, the median cross came with 63% of its move already done. That is measured afterwards, on candles, not trades.
Why do crossovers whipsaw in a range?
When price goes sideways the two averages flatten and sit close together, so small swings flip their order. In our count 444 of 1,132 crosses had crossed back before 17:00 New York the same day. We did not split those by whether the market was ranging.
Do moving average crossovers ever work?
A cross is a fair picture of what has already happened, and some crosses come early in a move: on USD/CHF on 30 July 2026 the cross down came 28 pips into a 136-pip fall. Whether a rule built on crosses pays is a separate test, and this page does not report one. The 50, 200 and 800 EMA trend rule we tried inside our own setup showed no measurable effect.
What is the best indicator for forex trading?
We cannot name one, and we have seen no reliable ranking. Every indicator is worked out from prices that have already traded, so none can lead them. Forexia does not use averages as a tool. Where they appear on our charts, they are labelled as what the crowd sees.