
Liquidity Visualization: Seeing Where the Crowd's Orders Rest Before a Sweep
Liquidity Visualization is using market structure to reverse engineer the retail trader's mindset and see on the chart where their orders rest. It is the habit behind Liquidity Mapping. No indicator does it: you look at the chart as the crowd does, work out what the textbook tells it to do, and that gives you the orders.
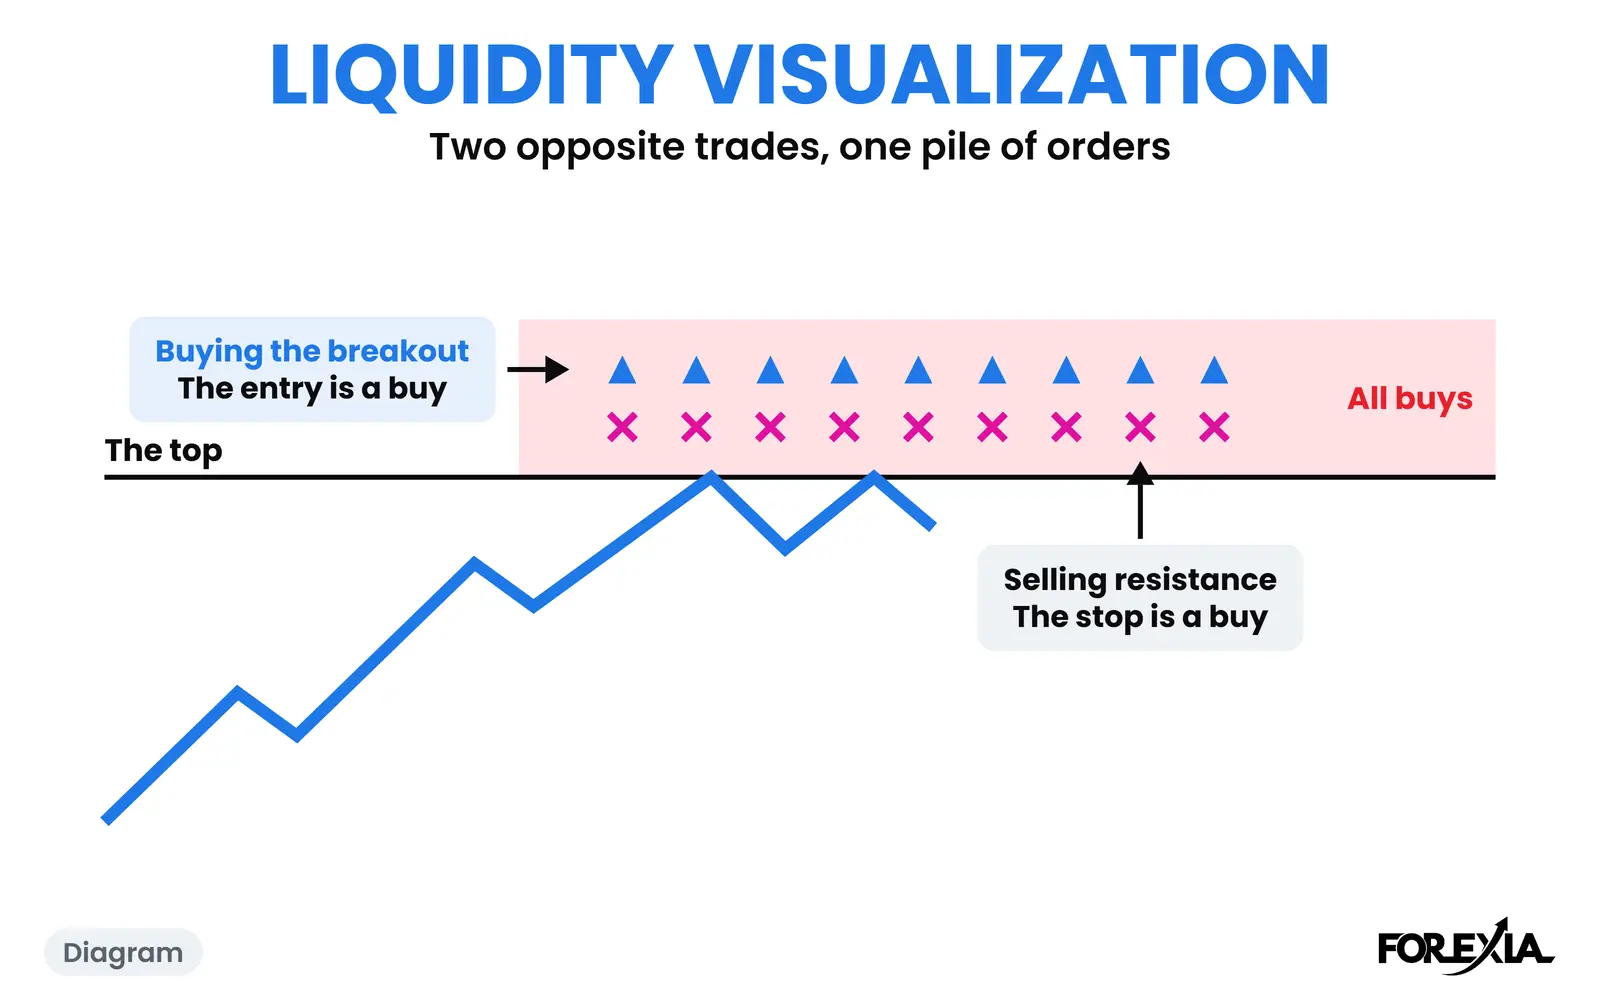
What does Liquidity Visualization look like on a chart?
It looks like reading the night's price action as a set of instructions to the crowd. On GBP/USD on Wednesday 9 September 2026, Asia climbed from 1.35311 to 1.35624, under a pip over Tuesday's high (1.35617). Now take the retail seat.
A trader following the climb sees a breakout coming, and the book says buy over the top. A trader selling resistance sees a double ceiling, and the book puts the stop just above it. Those are opposite trades, and they leave the same order in the same place: a breakout entry is a buy, and the stop on a short is a buy. So we read everything above 1.35624 as buys, before one of them was filled.
London opened at 03:00. That candle closed at 1.35654, over the Asian Box: the break the crowd buys. The 03:15 candle reached 1.35677, 5 pips over the box, and closed at 1.35611, back inside. By 06:00 price was at 1.35301, 38 pips off that high and a pip through the bottom of the box.
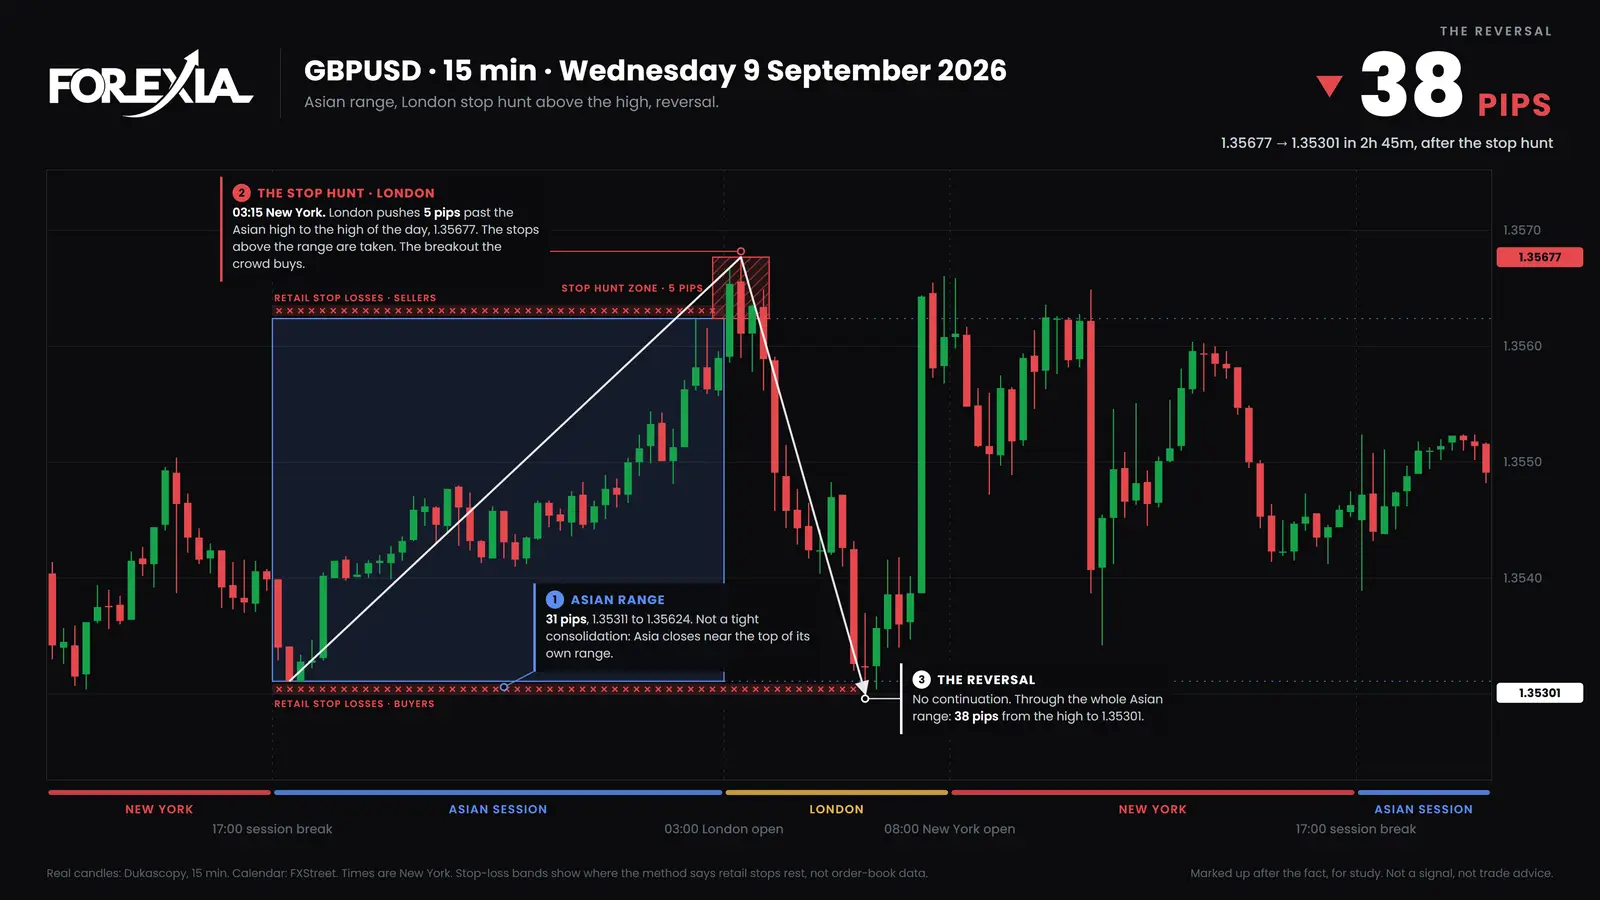
Then look at the rest of the chart. At 07:15 one candle ran from 1.35387 to 1.35644, 26 pips, back over the top of the box. The high of the day held at 1.35677. The read placed the orders. It had nothing to say about that candle.
Liquidity Visualization and a liquidity sweep: how do they relate?
A liquidity sweep is the event, and Liquidity Visualization is the read that comes before it. Most explanations of a sweep start at the wick: price takes the stops past a level and comes back. They say liquidity rests above highs and below lows, and stop there. This word adds the reason, for one chart: whose stops, whose entries, and why at that high and not another.
What is a liquidity sweep explains the term in full. Why stop losses sit above highs and below lows takes up the mechanics, and what counts as an obvious high or low the choice of level. In our words, the sweep is the Stop Hunt.
Liquidity Visualization and Liquidity Mapping: what is the difference?
One is the seeing and the other is the marking. People use the two as one word, so here they are side by side.
| Liquidity Visualization | Liquidity Mapping | |
|---|---|---|
| What it is | A way of reading | A job you do |
| The question | Why are orders here, and which way do they point? | Which levels go on today's chart? |
| When | Whenever you read structure | Before the session |
| What you end with | A reason | Lines you can check afterwards |
| On 9 September | Both trades leave buys above 1.35624 | A line at 1.35624 and one at 1.35617 |
The mapping page covers what goes on the chart. This page covers how you know.
How do you see where orders rest?
You start from the picture the crowd sees, because each picture comes with its own instructions. A flat top tells its sellers to put stops above it. A double bottom tells its buyers to put stops under it. A level about to break tells a different group to wait just past it with an entry. Then turn each order round: a buyer's stop is a sell, a seller's stop is a buy.
We read the reason this matters from the bigger player's side. A large buyer cannot fill against other buyers. It needs many sellers in one place, and past an obvious low is such a place. That is why the stop is the order to look for, not the entry. Much of this builds in the Window of Tolerance, the calm hours when the crowd places its orders. Taking the retail seat on purpose comes from Perceptual Positioning.
What do traders get wrong about Liquidity Visualization?
Three readings cost the most.
- It is an indicator. Search the phrase and you find tools that shade the chart. Nothing on a forex chart shows resting orders, ours included. The bands we draw are a reading.
- Seeing only your own order. Mark your entry and nothing else, and you have read half the line.
- The read is a prediction. It says where the orders are likely to be, not what happens next, as that 07:15 candle shows. A reversal seen afterwards is not a setup, and our own test of this setup as a mechanical rule did not make money.
Which words does Liquidity Visualization lead into?
Four sit next to it.
- Liquidity Mapping: marking the pools of stops on the chart before the session.
- Perceptual Positioning: seeing the same chart from the retail trader's, the market maker's and the observer's seat.
- The Stop Hunt: price driven into clustered stops, commonly called a liquidity sweep.
- The Window of Tolerance: the calm Asian range in which most traders place their orders.
Where is Liquidity Visualization taught?
Course 1 of ForexiaPRO, Reading the Map, teaches this read step by step in lesson 1.2.1, The Chart Is a Map of Orders, the same lesson as Liquidity Mapping.
Related words
Frequently asked questions
What is Liquidity Visualization?
It is using market structure to reverse engineer the retail trader's mindset and see where their orders rest. Forexia's own wording is: “I use market structure to reverse engineer the retail trader mindset and visualize liquidity on the charts.”
Can you actually see liquidity on a forex chart?
Not directly. Spot forex trades over the counter, so no public book shows resting orders. What you can see is the structure every trader is looking at, and what the textbook tells them to do about it. The orders are inferred from that, and the inference is a reading, not data.
Is Liquidity Visualization the same as Liquidity Mapping?
No. Liquidity Visualization is the seeing: working out why orders rest at a level and which way they point. Liquidity Mapping is the marking: drawing those levels on today's chart before the session. The first is the habit behind the second.
Does Liquidity Visualization predict a liquidity sweep?
No. It tells you where a sweep would find orders, not whether one will come or what price does after it. On GBP/USD on 9 September 2026 the read placed the buys above 1.35624, and a single candle at 07:15 New York later ran back 26 pips, which nothing in the read could say.