How to Spot Reverse Price Action: Reading a Pattern Backwards on a Real Gold Day
Dylan Forexia7 min read
You spot reverse price action by looking behind a pattern instead of at it. A pattern sends a crowd into a trade, that trade leaves stops on the chart, and what price does to those stops is the thing to watch. No candle shape or indicator marks it. It is a reading, and it shows most clearly on a real day.
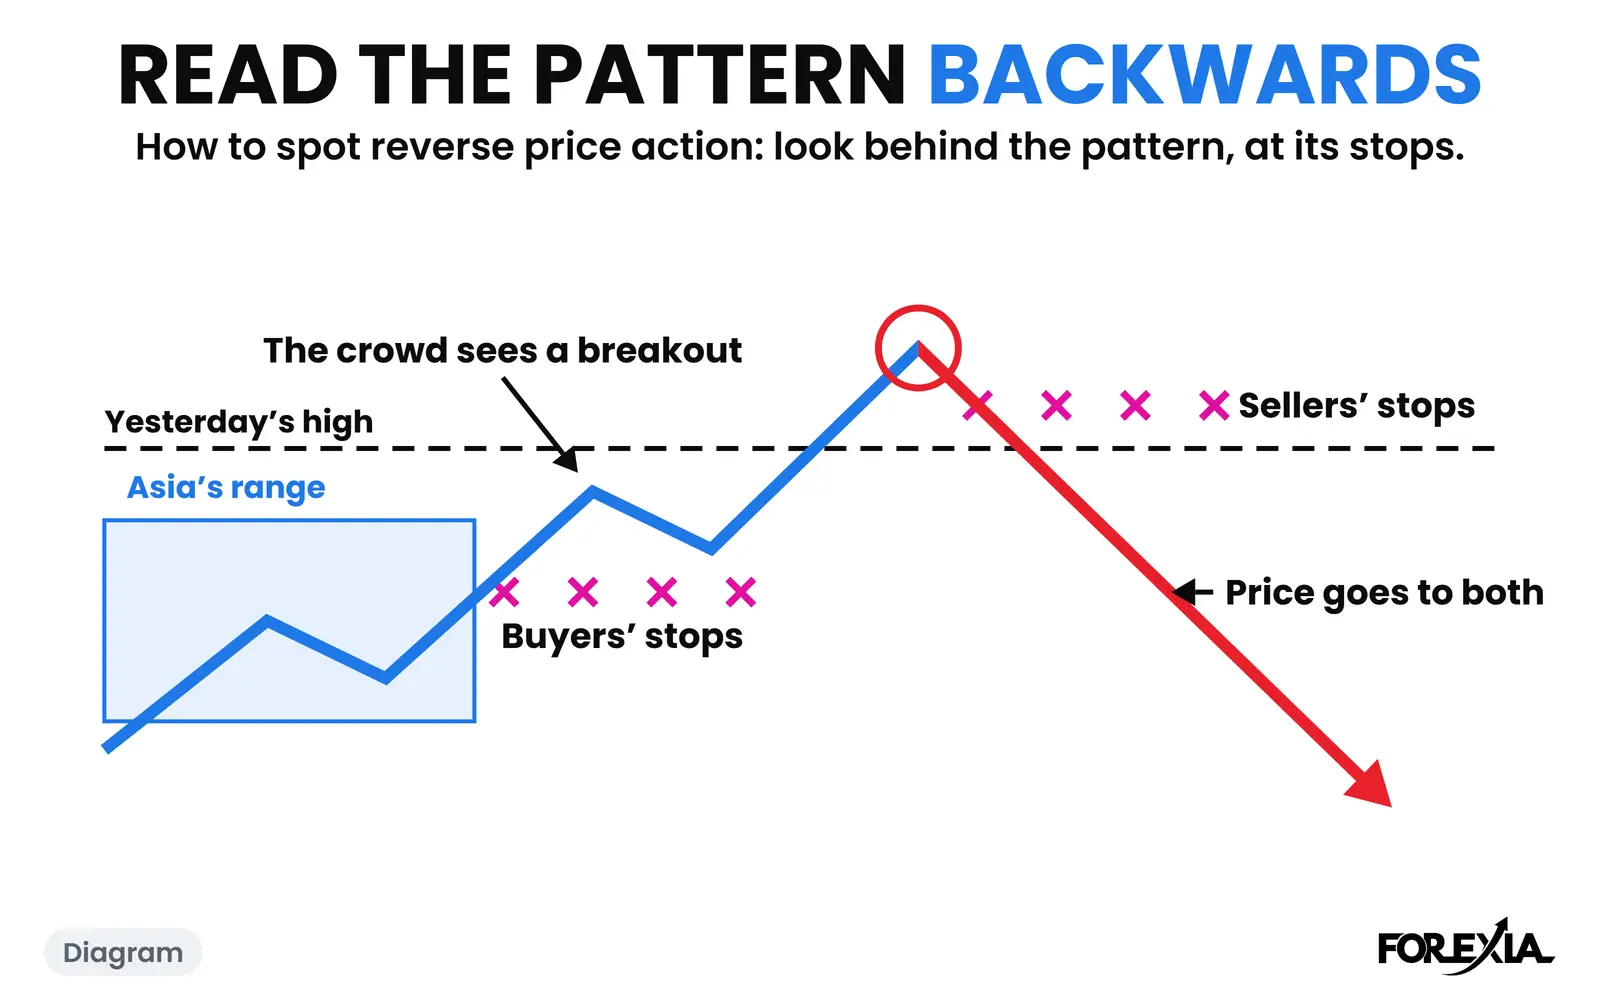
Reverse Price Action is reading a pattern backwards. The glossary page defines the word. This page shows what to look at, on a large move on gold and a tiny one on USD/CHF. Times are New York, candles are 15-minute Dukascopy, and on gold $1 counts as 1 pip.
How is this different from spotting a reversal?
Most guides to a price action reversal ask whether price is about to turn. They look at a lower low in an uptrend, a pin bar at a level, divergence on RSI, a jump in volume, or several of those at once. Those are questions about direction, and the answers come from the same candles. In our count on the price action trading hub, pin bars and engulfing candles moved price no further than any other new high or low.
This read is about people rather than direction. On the gold day below, one breakout put a crowd in and left two sets of exits close by, and those exits are what the page looks at. That is why Perceptual Positioning matters here: the same chart reads differently from each seat. What comes out is a place on the chart rather than a forecast, and marking such places is what Liquidity Mapping is for.
How to spot reverse price action on a real gold day
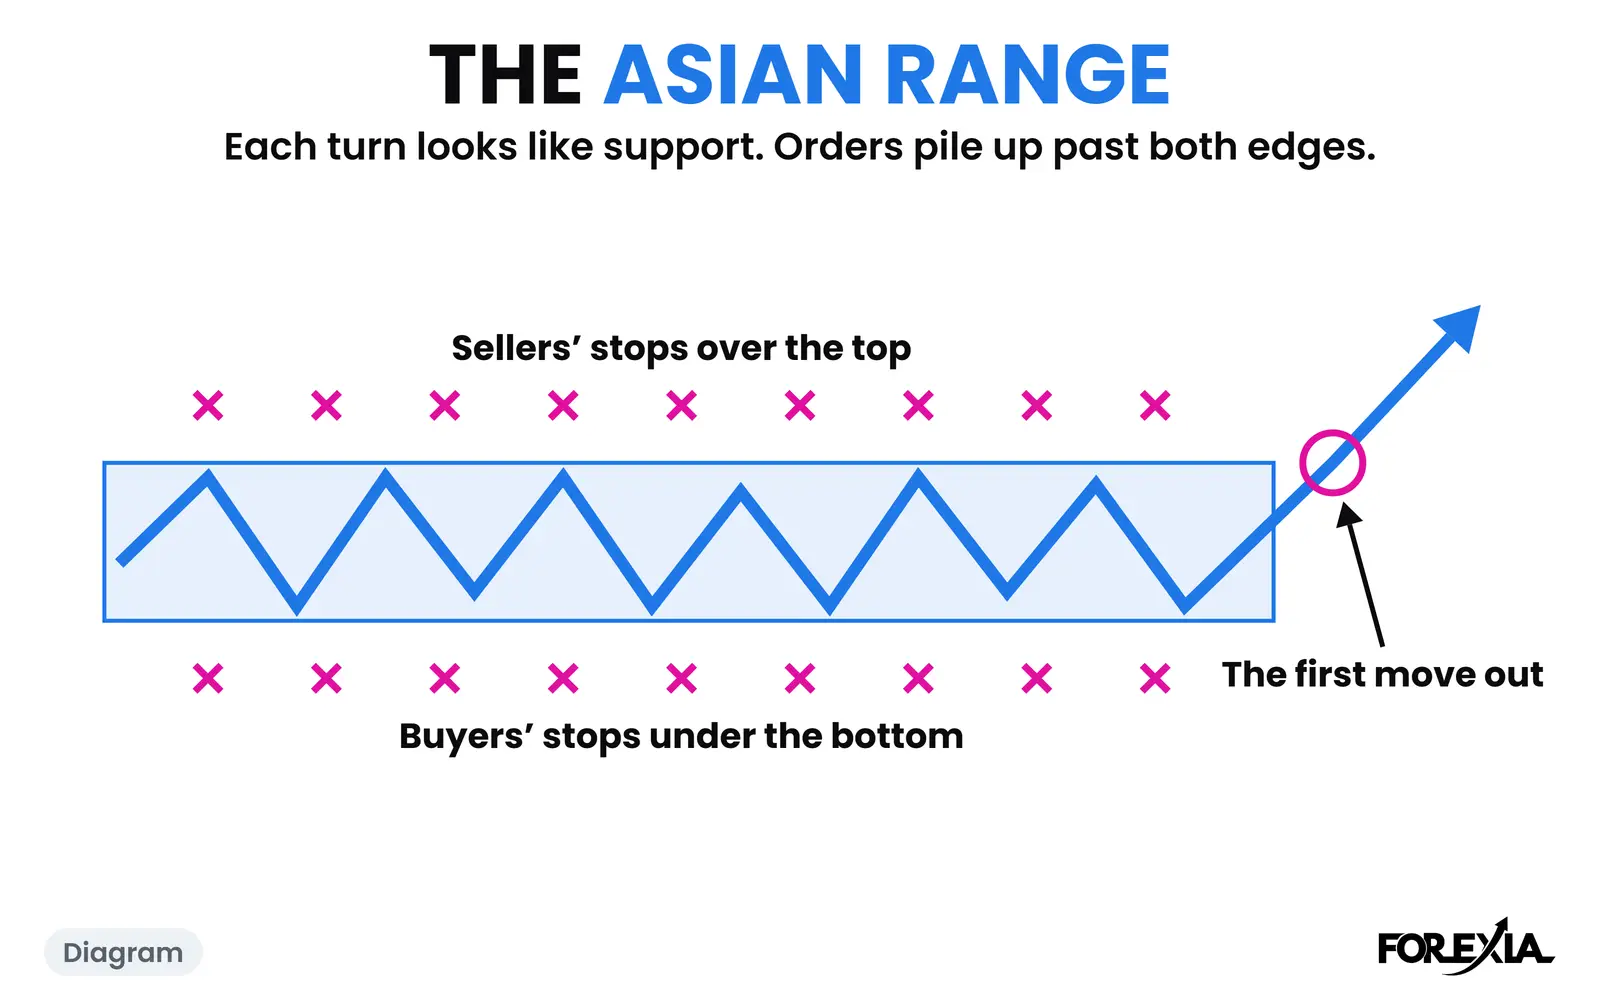
Gold on Friday 25 September 2026 opened on a clear Asian range of 40 pips, 4255.93 to 4295.44. Thursday's high sat just above it at 4302.86. Only medium-impact items were on the calendar: a Fed speaker at 05:15, durable goods at 08:30 and consumer sentiment at 10:00.
At 06:00 a textbook trader saw something simple. Price had leaned on the top of the range for over an hour, with highs at 4297.02 and 4297.66. The 06:00 candle then ran from 4294.56 to 4307.98 and closed at 4307.10, 12 pips over the range and 4 over Thursday's high. That is a London breakout through a level the whole market can see, and the crowd buys it.
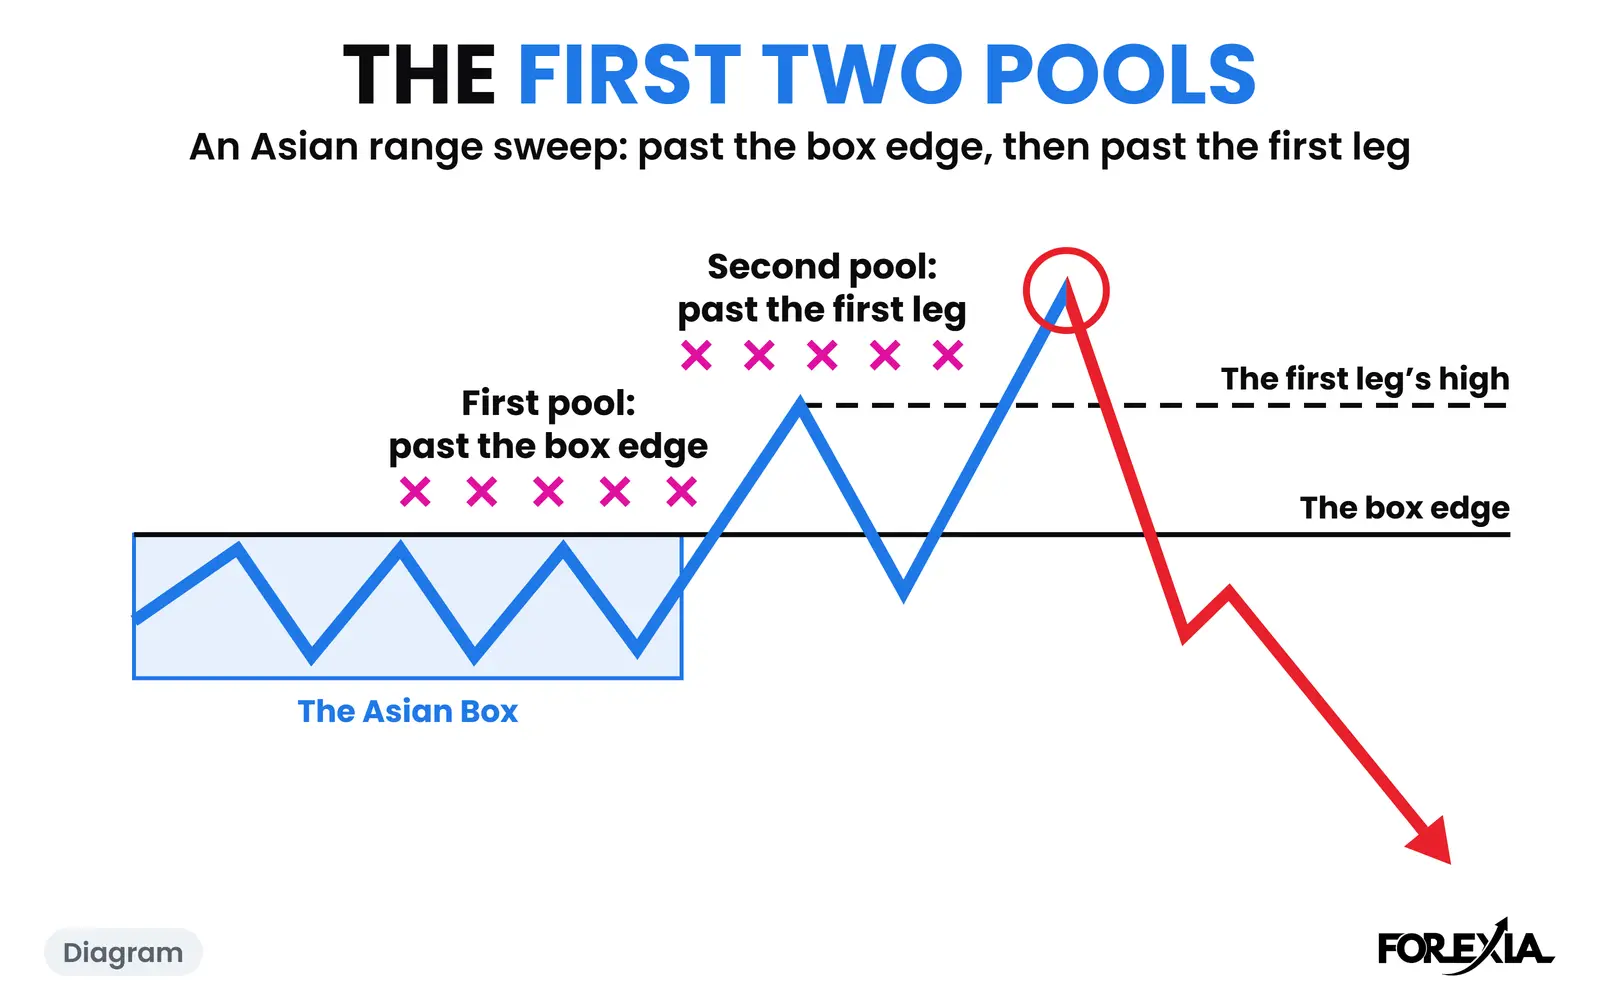
That decision left everyone somewhere. The new buyers had stops under the breakout candle's low, 4293.73, and under the top of the range, 4295.44: two lines 2 pips apart. Anyone who sold Thursday's high earlier had a stop just over 4302.86, and that stop is a buy order. So within about 10 pips of the breakout there were two sets of exits, one on each side of it, and either one was a pile of orders.
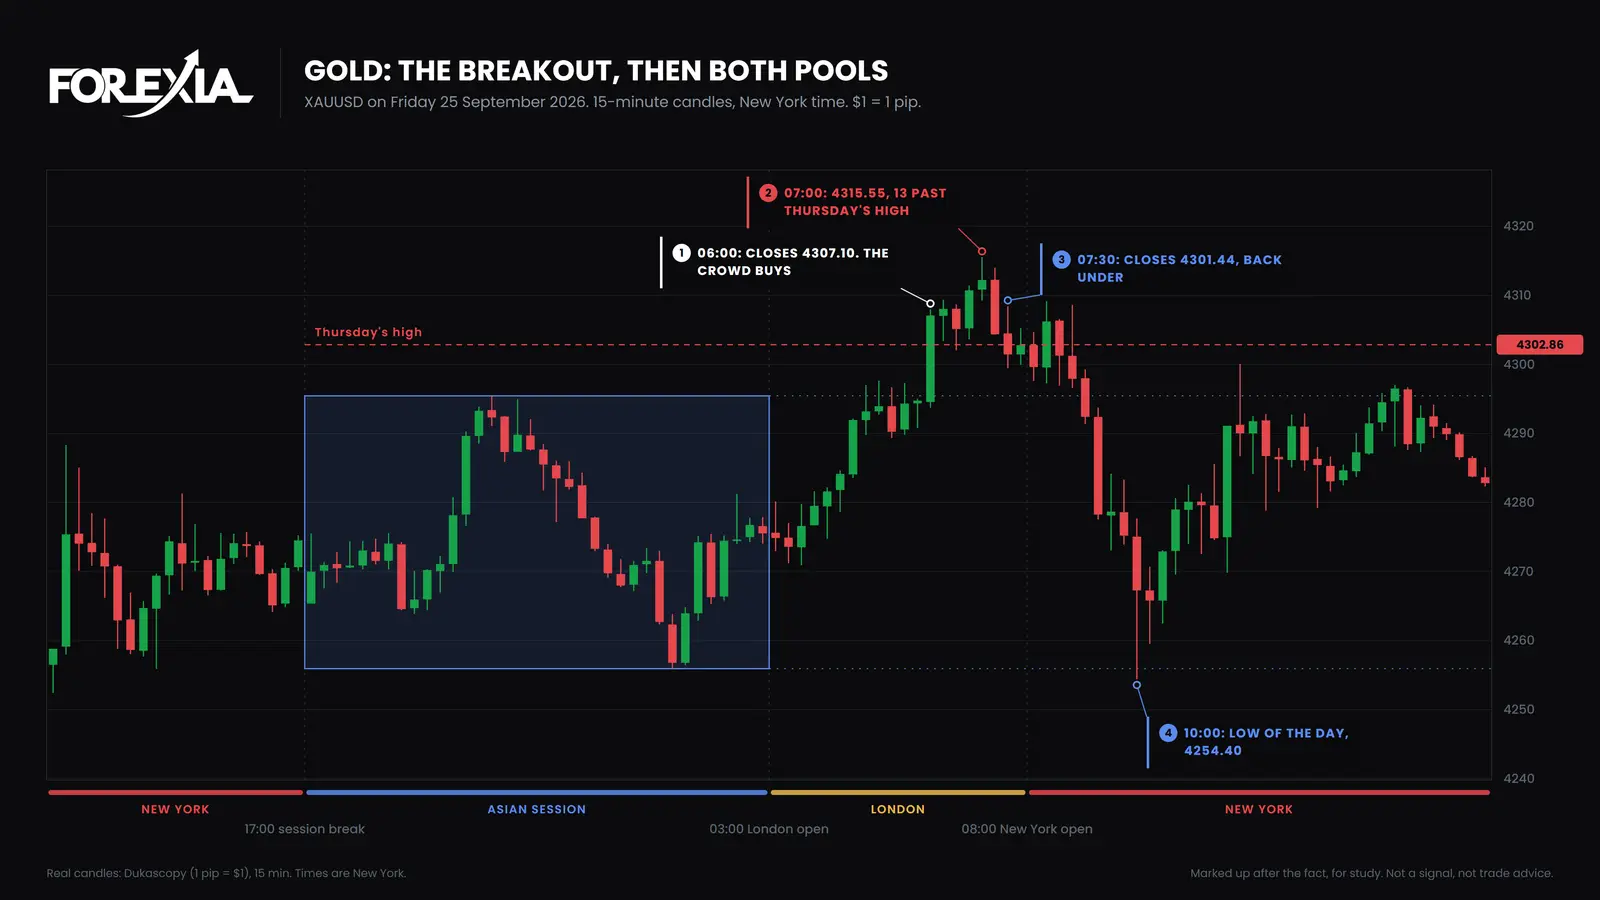
At 07:00 price reached 4315.55, 13 pips past Thursday's high and 20 over the range. We read that as the stop hunt, the liquidity sweep of the stops over that high. The 07:15 candle fell to close at 4304.35, still over the level. The 07:30 candle closed at 4301.44, 1 pip back under it. That is the close back, and all it says is that price went past a line and came back.
It did not stay clean, and this is the part charts tend to hide. The 08:15 candle closed at 4306.23, back over Thursday's high. Someone reading this live would have had doubts for the next hour. The 09:00 candle then went to 4291.40, under both of the buyers' lines, and the 09:15 candle closed at 4278.24. By 10:00, on a medium-impact sentiment release, price was at 4254.40, 61 pips off the high. The day ended at 4282.81.
Both pools went, in the order they were closest. The sellers' stops went first and the buyers' stops second. We read the place and the hour as no accident: London was open, the range was clear and a visible high sat right above it. That is a reading, not a record. Who took the other side of that buying is something no chart can tell you.
What do the three seats see on that day?
The seats keep the facts apart from the reading. The three seats on gold's morning look like this:
- Retail sees a breakout, then a pullback, and then either a bargain or a stop. Each candle looks like a new decision.
- The market maker's seat, as we read it, sees a crowd that entered one way with its exits in known places. To sell size, you need buyers, and a breakout over a known high brings them together.
- The observer sees a line, a push past it, a close back, a close over it again, then a fall. The observer can state all of that from the candles, and cannot say who sold.
What does a small one look like?
It looks like almost nothing, which is why it is worth seeing. USD/CHF on Wednesday 29 July 2026 had an Asian range of 29 pips, 0.81690 to 0.81977, with Tuesday's high above it at 0.82048. At 08:15 price reached 0.82048, exactly on that high, and turned. The crowd has two trades here: sell the old high with a stop just over it, or wait to buy the break.
Price fell back to 0.81817 by 10:30, which made the first trade look right. Then the 10:45 candle ran to 0.82038. At 12:30 a slow, ordinary candle reached 0.82066, 2 pips past both the first high and Tuesday's high, and closed at 0.82050. Nothing was due on the calendar until the Fed at 14:00. Two highs with a pullback between them is a double top, and in our words an M.
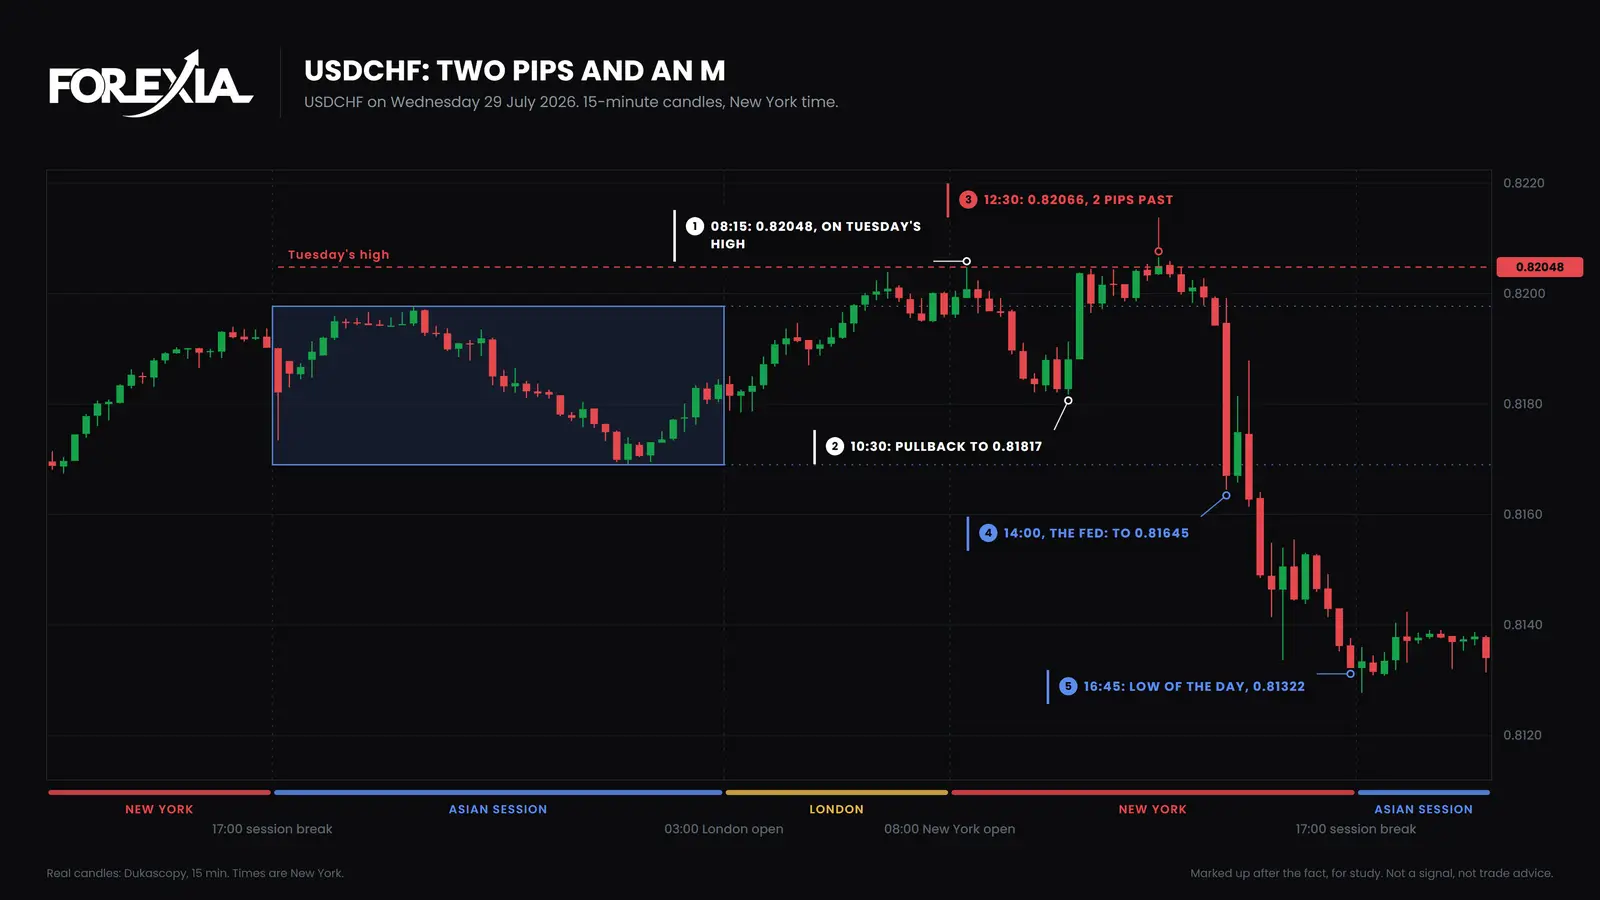
The next candle closed at 0.82035, a pip back under. Price had already slipped to 0.81947 when the Fed's decision came. That candle fell to 0.81645, and the day ended on its low, 0.81322, 74 pips under the high.
Be careful what you take from this. The read did not know the decision. Nobody reading this chart at 12:45 knew which way a central bank would move the dollar, and on the same minute other dollar pairs moved with it, so this is one dollar move and not several confirmations. What the read knew was where the stops sat. Two pips was enough to reach them.
What can you not know at the time?
Plenty, and an honest page has to say so.
- Whether price will go to the stops at all. A pool is only a place. Many days never visit it.
- Whether a close back will hold. Gold's closed back over the level 45 minutes later, and only then fell. On other days the fall never comes.
- Who did it. "The market maker" is a seat we read from. No retail chart shows the order book, and we do not claim to know who traded any candle.
We picked these two days because they reversed, and a reversal seen afterwards is not a setup. Our own test of the setup as a mechanical rule did not make money. Both days are good pictures of the read and poor evidence for it.
Your own old charts will show plenty of lines like these that price never went back to, and those days belong in the picture too. The false breakout in forex shows the read on a trendline and a triangle, and why double tops and double bottoms fail shows it on the most drawn shape of all. How to read a forex chart markup explains the charts we publish each week.
Common mistakes
Each of these comes from wanting the read to be simpler than it is.
- Looking for a candle shape. The 07:00 candle on gold was ordinary, and the read rests on where it was.
- Doing the opposite of every pattern. Reading backwards is not a rule to fade whatever you see. Many breakouts are real.
- Stopping the story at 07:30. On gold a candle closed back over the level 45 minutes later.
- Crediting the read with the news. On USD/CHF the Fed moved price. The read only said where the stops were.
Course 3 of ForexiaPRO, Reverse Price Action, teaches this read step by step, starting in lesson 3.1.2.
Frequently asked questions
What is reverse price action?
It is Forexia's word for reading a pattern backwards, starting from the crowd it sends in and the orders that crowd leaves behind. The textbook asks where a pattern says price will go. This read asks why the pattern is there at all.
Can you spot reverse price action before the reversal?
You can see the pattern and mark where its stops are likely to rest before anything happens. You cannot see whether price will go there, or turn when it does. On gold on 25 September 2026 the level closed back at 07:30 and price closed over it again at 08:15. The read gets firmer as candles close, and it can still be wrong.
Do I need an indicator to read a pattern backwards?
No. The read uses the pattern, the levels on the chart and the order in which they were traded. Indicators are calculations on the same candles, so they cannot tell you where stops rest.
Is reverse price action a trading strategy?
It is a way of reading a chart that takes judgement, not a button. Forexia's own test of the setup as a fixed mechanical rule did not make money. A day that reads cleanly afterwards proves nothing about the next one.