
Reverse Price Action: Reading a Pattern Backwards, and What a Fake Breakout Really Is
Reverse Price Action is reading a pattern backwards: why it was built here and now, how textbook traders will react, where their stops sit, and how the bigger players use that pool, then trading the opposite of the textbook read. Price action trading usually starts from a pattern and asks where price goes next. Reverse Price Action starts from the same pattern and asks who it was built for. A fake breakout is the most familiar thing that read explains.
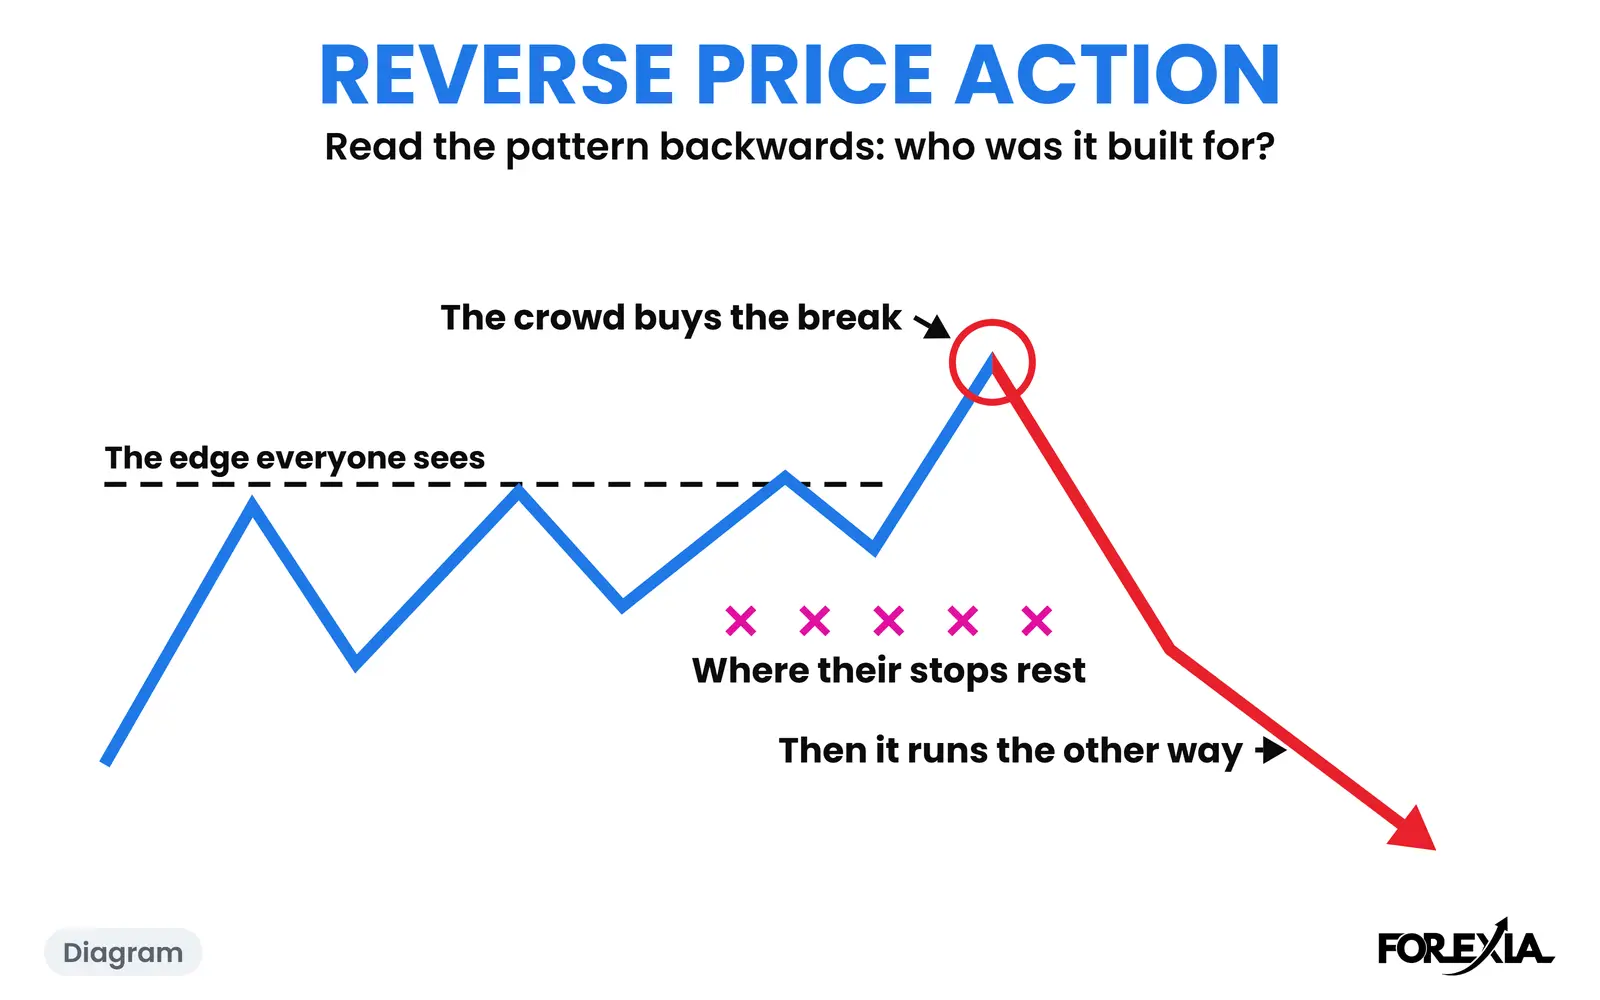
What does Reverse Price Action look like on a chart?
It looks like a familiar pattern with a different question asked of it. On USD/JPY on Tuesday 4 August 2026, the Asian Box topped out at 157.769, with Monday's high 11 pips over it at 157.883. No medium or high-impact release was due for either currency before 08:30 New York. The candles below are the same ones anyone saw that morning.
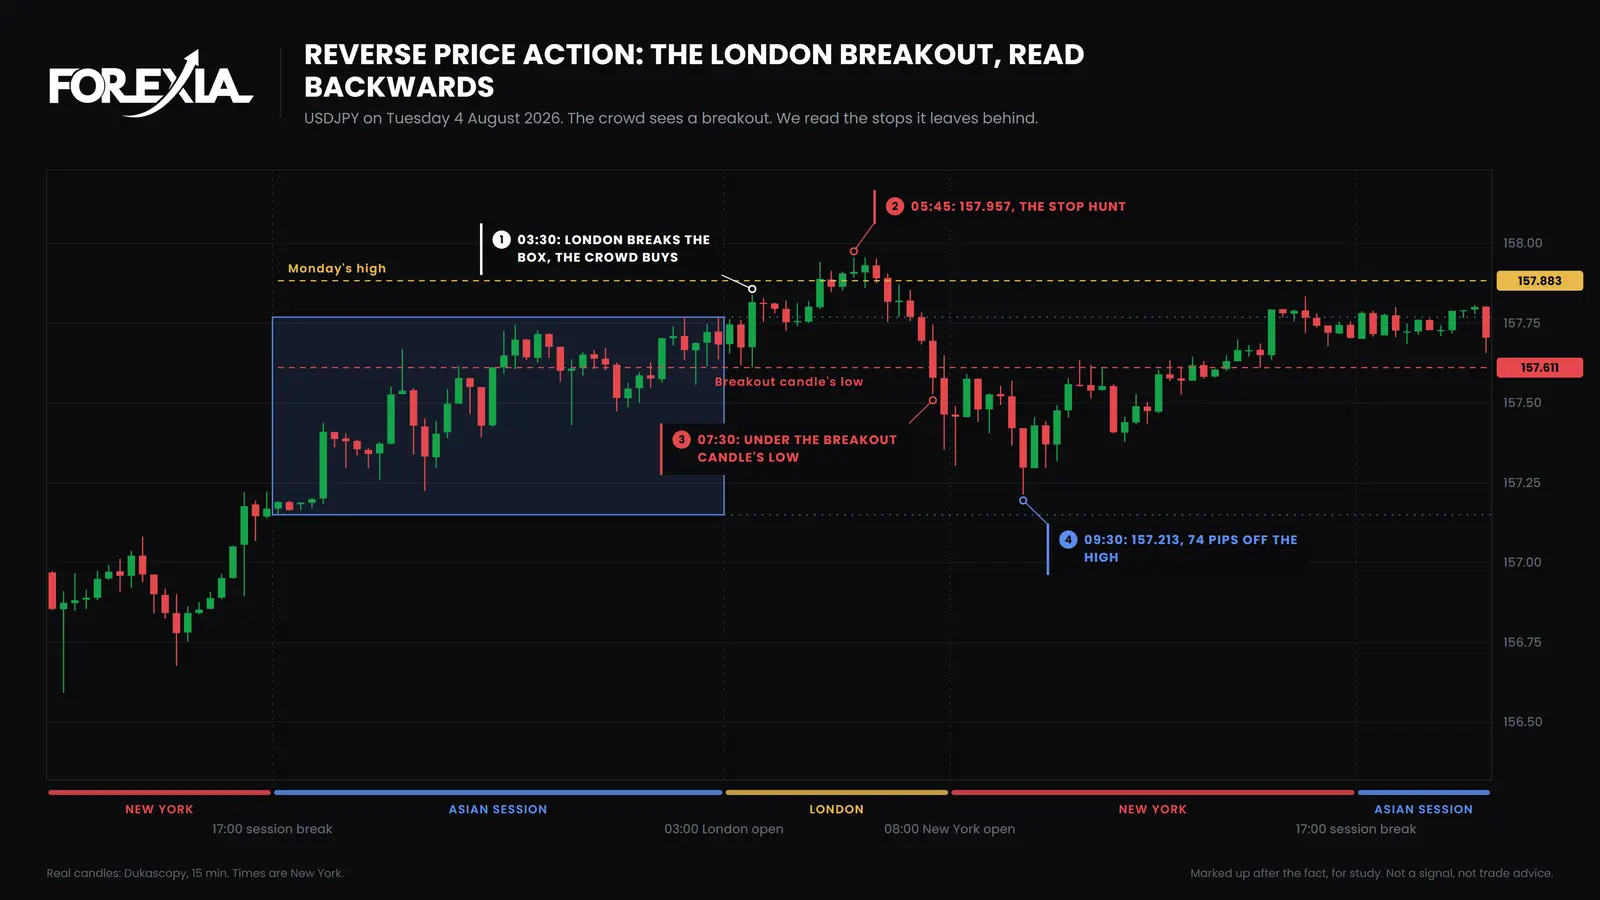
The Three Seats see three different things.
- The first seat sees a breakout. The 03:30 New York candle closes at 157.816, 5 pips over the box: the London Breakout. The textbook says buy, with a stop under that candle's low, 157.611.
- The market maker's seat sees a pool. Anyone who sold Monday's high has a stop just over 157.883, and a stop is an order waiting for a trigger. At 05:45 price reaches 157.957, 7 pips through that high and 19 over the box. We read that as the Stop Hunt, the liquidity sweep.
- The observer reads what came next. From the 06:30 candle on, none closes over Monday's high again: the Close Back. At 07:30 price trades to 157.527, 8 pips under the breakout candle's low, so the buyers' stops go too. At 09:30 it is at 157.213, 74 pips off the high.
The day did not keep falling. It turned inside the box, climbed to 157.834 by 15:45 and ended at 157.704. It was no clean day either: the box was a wide 62 pips, and the fall never left it. The read was about the stops on both sides of one price, not a forecast for the day.
Reverse Price Action and a fake breakout: how do they differ?
A fake breakout is an event, and Reverse Price Action is a way of reading. The guides to fake breakouts ask one question of one candle: was that break real? They offer a close back inside the level, volume, or a higher timeframe to answer it. Volume is thin help here, since spot forex has no central exchange to report it. Reverse Price Action asks an earlier question, of any pattern: who was this built for, and where did it tell them to put their stops? The same question fits a trendline, a triangle, the Third Tap or a crossing of averages.
The other difference is that not every break is fake. We counted seven majors and gold on 15-minute candles from 6 April to 1 October 2026. A level is an edge of the Asian Box, or the previous day's high or low if Asia had not traded past it, and taken means through it after the London open by at least 3% of the average daily range. Of 1,601 levels taken, 1,310 closed back the same day and 291 did not. The Close Back page gives that count in full.
For the keyword itself, see false breakout forex, and stop hunt vs fakeout for the names side by side.
How do you recognise a Reverse Price Action read?
You recognise it by what it looks at. A textbook read names a pattern and a direction. This read names a pattern, the traders it speaks to and the place it told them to hide their stops, which Liquidity Mapping marks before the session. On 4 August that place was one price, because the breakout candle's low and the lows just before it sat together.
How to spot reverse price action walks through a full day. What to do with the read stays in the course.
What do traders get wrong about Reverse Price Action?
Four mistakes come up most.
- Doing the opposite of every pattern. It is not a rule to fade whatever you see. Those 291 levels were real breaks, and they ran.
- Reading one hunt as the whole day. On 4 August, the fall ended inside the box and the afternoon gave most of it back.
- Taking a reversal seen afterwards for a setup. Every day reads cleanly once it is over. Our own test of the setup as a mechanical rule did not make money.
- Claiming to know who did it. Nobody outside can see the orders. "The bigger players" is our reading of the structure, not a fact about any one candle.
Which words does Reverse Price Action lead into?
Four sit next to it.
- The Close Back: the spike that closes back inside the level. The sweep has happened.
- The Third Tap: the perfect third touch of a level, where the trap is set.
- Perceptual Positioning: seeing the same chart from three seats.
- M & W Reversals: an M off the highs or a W off the lows, from a clear Asian range.
Where is Reverse Price Action taught?
Course 3 of ForexiaPRO, Reverse Price Action, teaches this read step by step, starting with lesson 3.1.2.
Related words
Frequently asked questions
What is Reverse Price Action?
It is Forexia's word for reading a pattern backwards: why it was built here and now, how textbook traders will react, where their stops sit, and how the bigger players use that pool, then trading the opposite of the textbook read. It starts from who a pattern was built for, not from where the pattern says price should go.
Is Reverse Price Action the same as trading a fake breakout?
No. A fake breakout is one thing that can happen to one pattern. Reverse Price Action is a way of reading any pattern, including a trendline, a triangle or a crossing of averages. It also has to allow for the break that is real: in our count of 1,601 levels taken on seven majors and gold from 6 April to 1 October 2026, 291 had not closed back by the end of the day.
Does Reverse Price Action work?
It is a read that takes judgement, not a button. Forexia's own test of the setup as a fixed mechanical rule, from 2015 to 2026, did not make money. A day that reads cleanly afterwards is not proof, and nobody outside can see the orders behind a chart.
Do you need indicators for Reverse Price Action?
No. The read uses the pattern, the levels and where the stops sit. Where averages appear on our charts, they are there to show what the crowd sees and where it gets in. They are not part of our toolkit.