USD/CAD Double Top, 1 October 2026: Reading the M Backwards, Then What Price Did
Dylan Forexia7 min read
The USD/CAD double top of Thursday 1 October 2026 made a first high at 1.42582 and a second at 1.42623, then fell 43 pips by the end of the day. We read that second high as a stop hunt: 4 pips past the first, and back under it by the close of the candle. Here is what it looked like at each stage, and what price did next.
Times are New York, candles are 15-minute Dukascopy, and your broker's chart may differ by a pip or so. For the general idea of M & W Reversals, start with the M pattern in forex. This page is one day, and a second to keep it honest.
What did the Asian session leave?
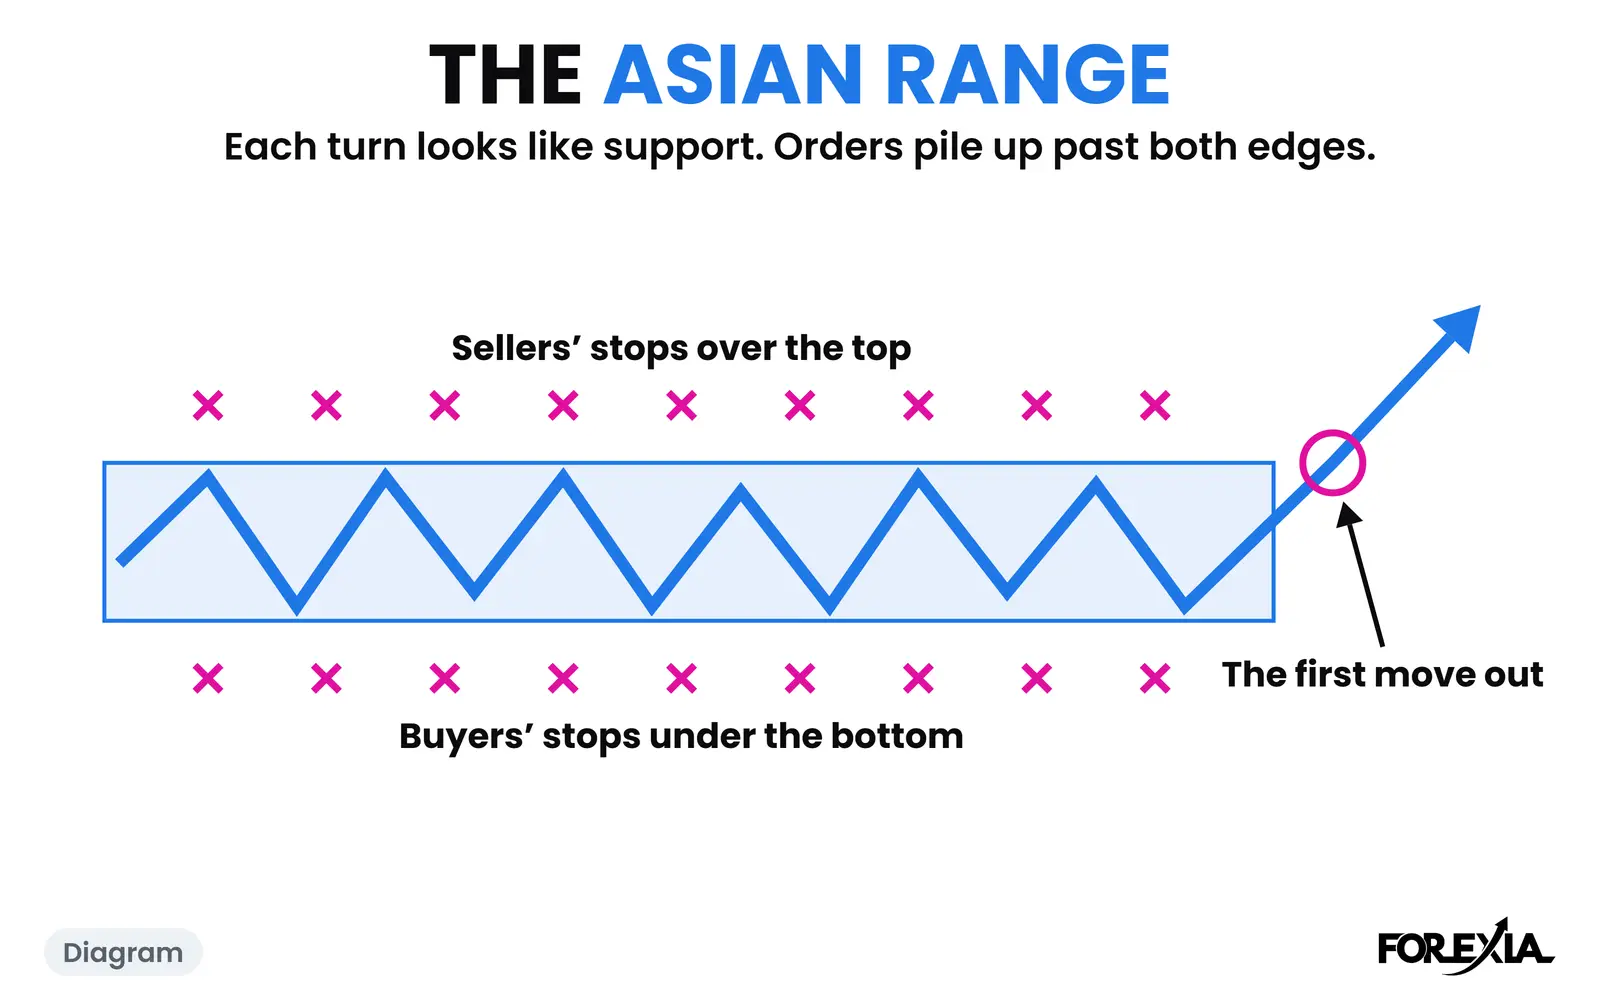
It left a box that was tighter than its raw figure. Our markup gives the Asian range as 34 pips, 1.42158 to 1.42498, but that low is a wick on the first candle after the 17:00 rollover, when spreads often widen, and the next candle's low of 1.42186 is the same story. Leave out those two, and the session's low was 1.42248 and the range about 25 pips. Keep both readings in mind. Wednesday's high, 1.42367, had already been traded through in Asia, so that pool was spent.
The pair had risen all week. By Thursday it was well over the week's open of 1.41296, so the crowd had days of rising prices behind it.
How did the first high of the USD/CAD double top form?
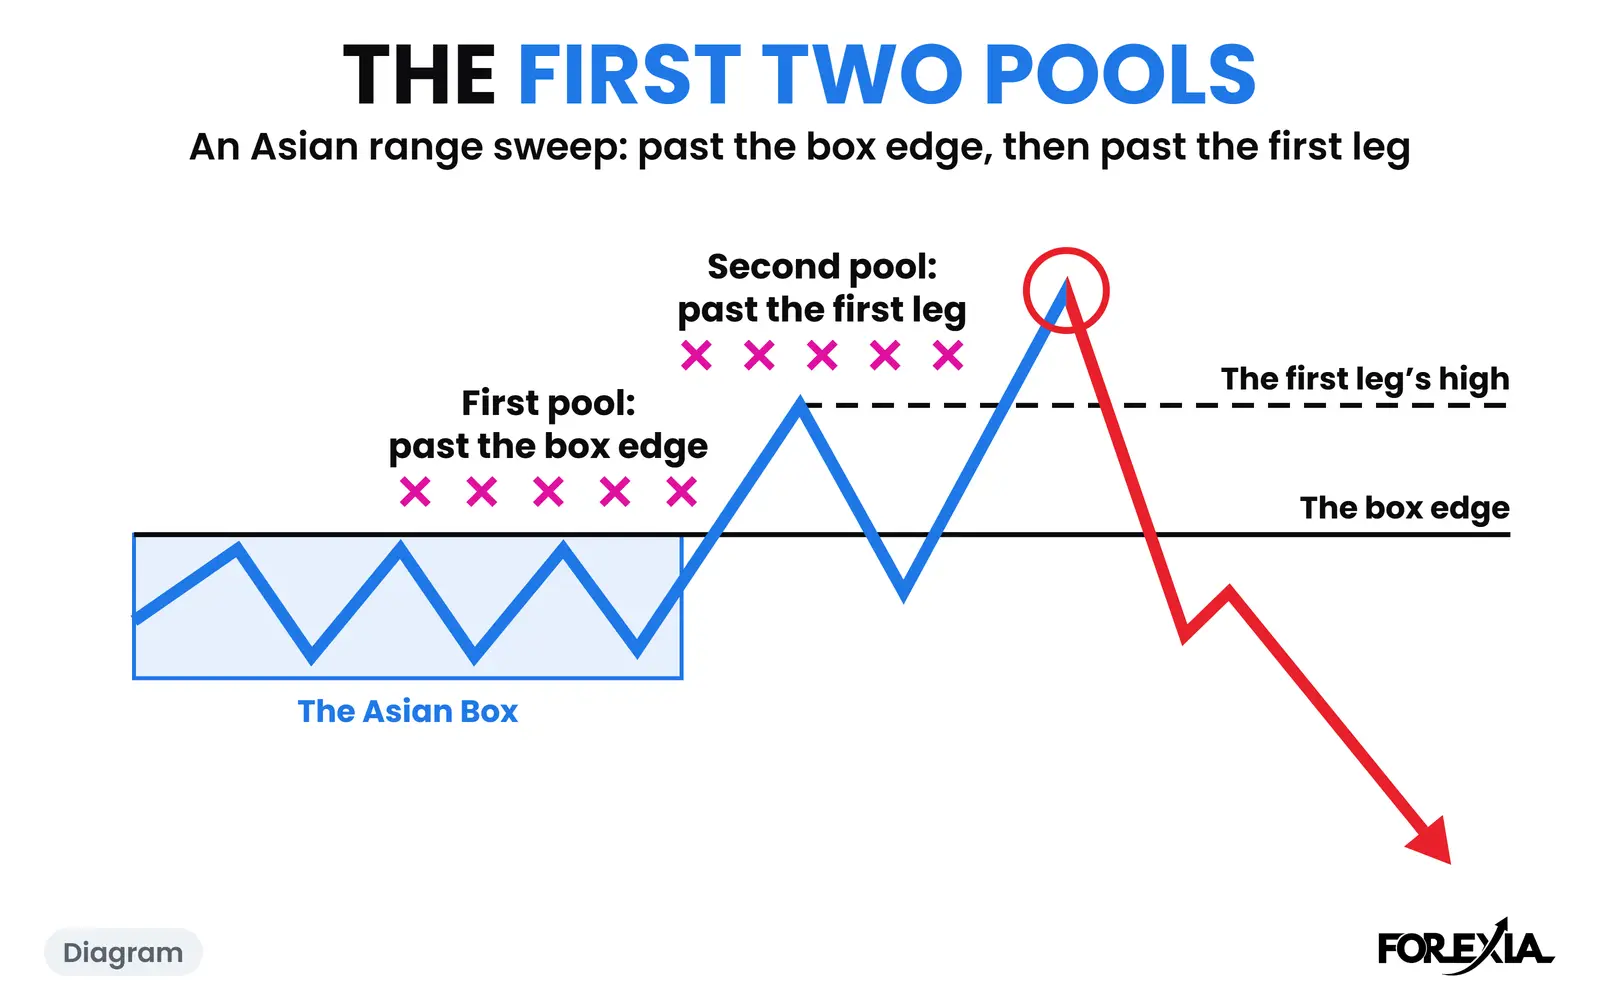
London pushed through the top of the box in one candle. The 05:45 candle ran from 1.42460 to 1.42579 and closed at 1.42572, 7 pips over it, and the 06:00 candle reached 1.42582, 8 pips over. That is the breakout the crowd buys. Sellers' stops over 1.42498 went on the way.
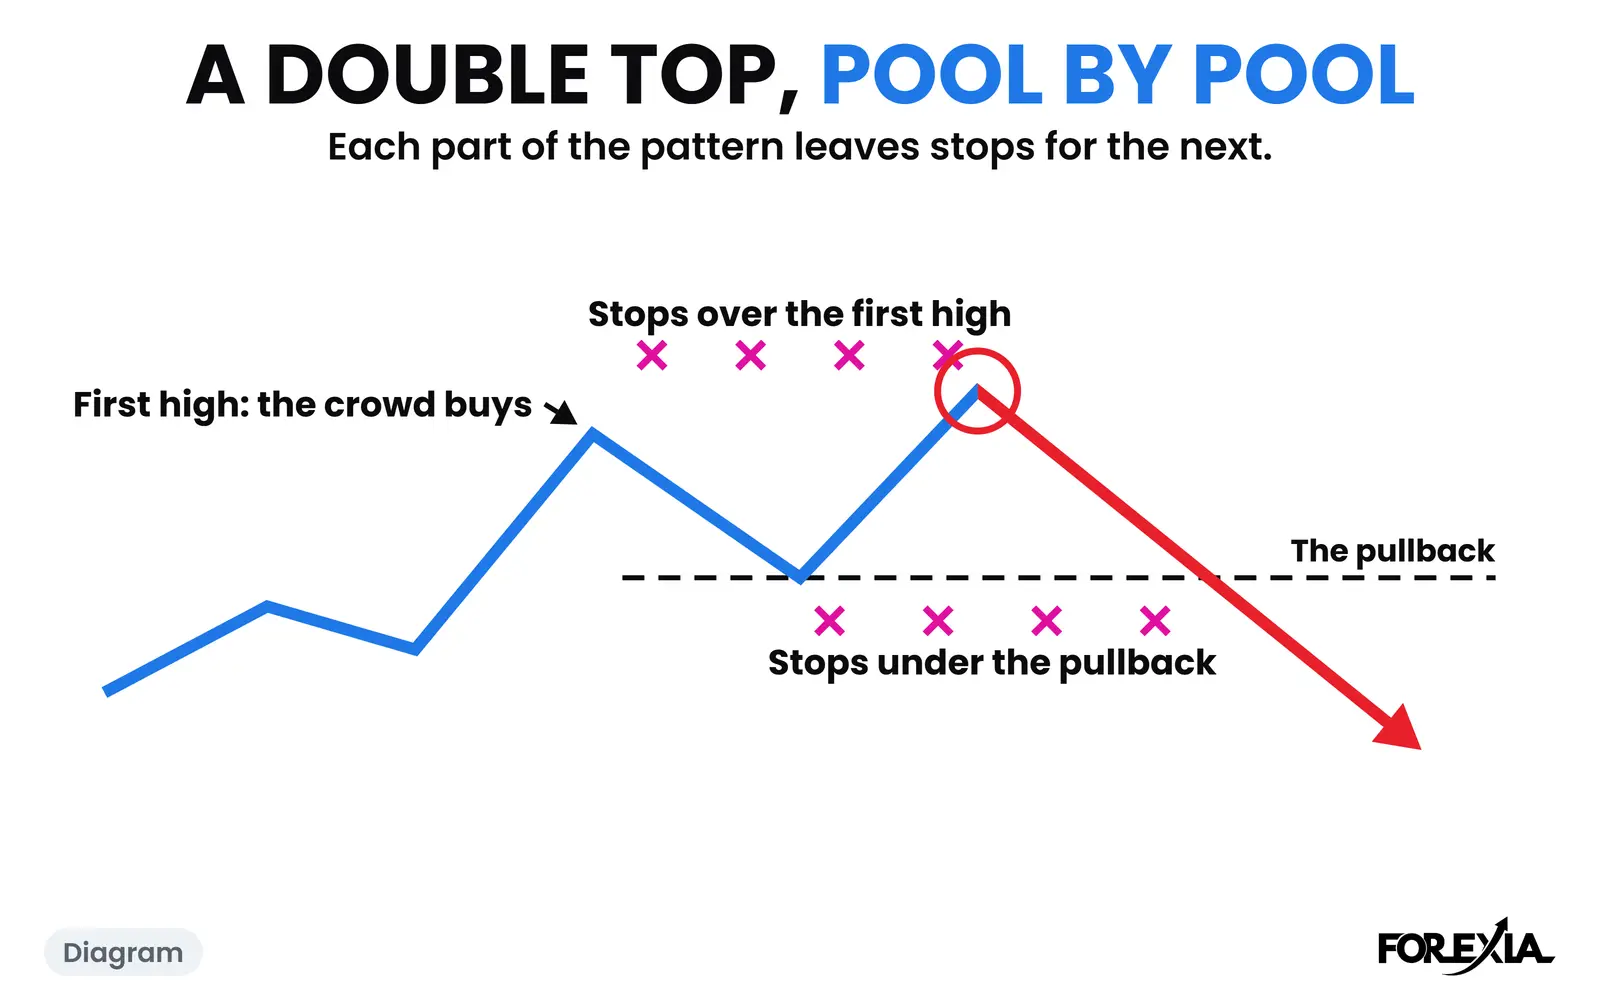
So at 06:00 there were two new groups. Buyers of the break had stops somewhere under the pullback to come. Anyone selling the new high had a stop just over 1.42582. Nothing was on the calendar for the dollar or the Canadian dollar at that hour.
Price pulled back slowly through the US morning. Medium-impact jobless claims at 08:30 and the ISM figure with a Fed speaker at 10:00 came and went. The low came at 09:45, 1.42316, 27 pips under the high, and 10:30 tested near it at 1.42329. That line is the neckline, and from it the book has its signal.
What was the second high hunting?
The stops over the first high. The 11:30 candle opened at 1.42498, traded to 1.42623 and closed at 1.42517. That is 4 pips past the first high and, at the close, about 6 pips back under it, on a range of 15 pips. Nothing for either currency lined up with it. We read that as the stop hunt, a liquidity sweep of the stops over 1.42582, on a candle that gave the crowd a new high of the day to buy.
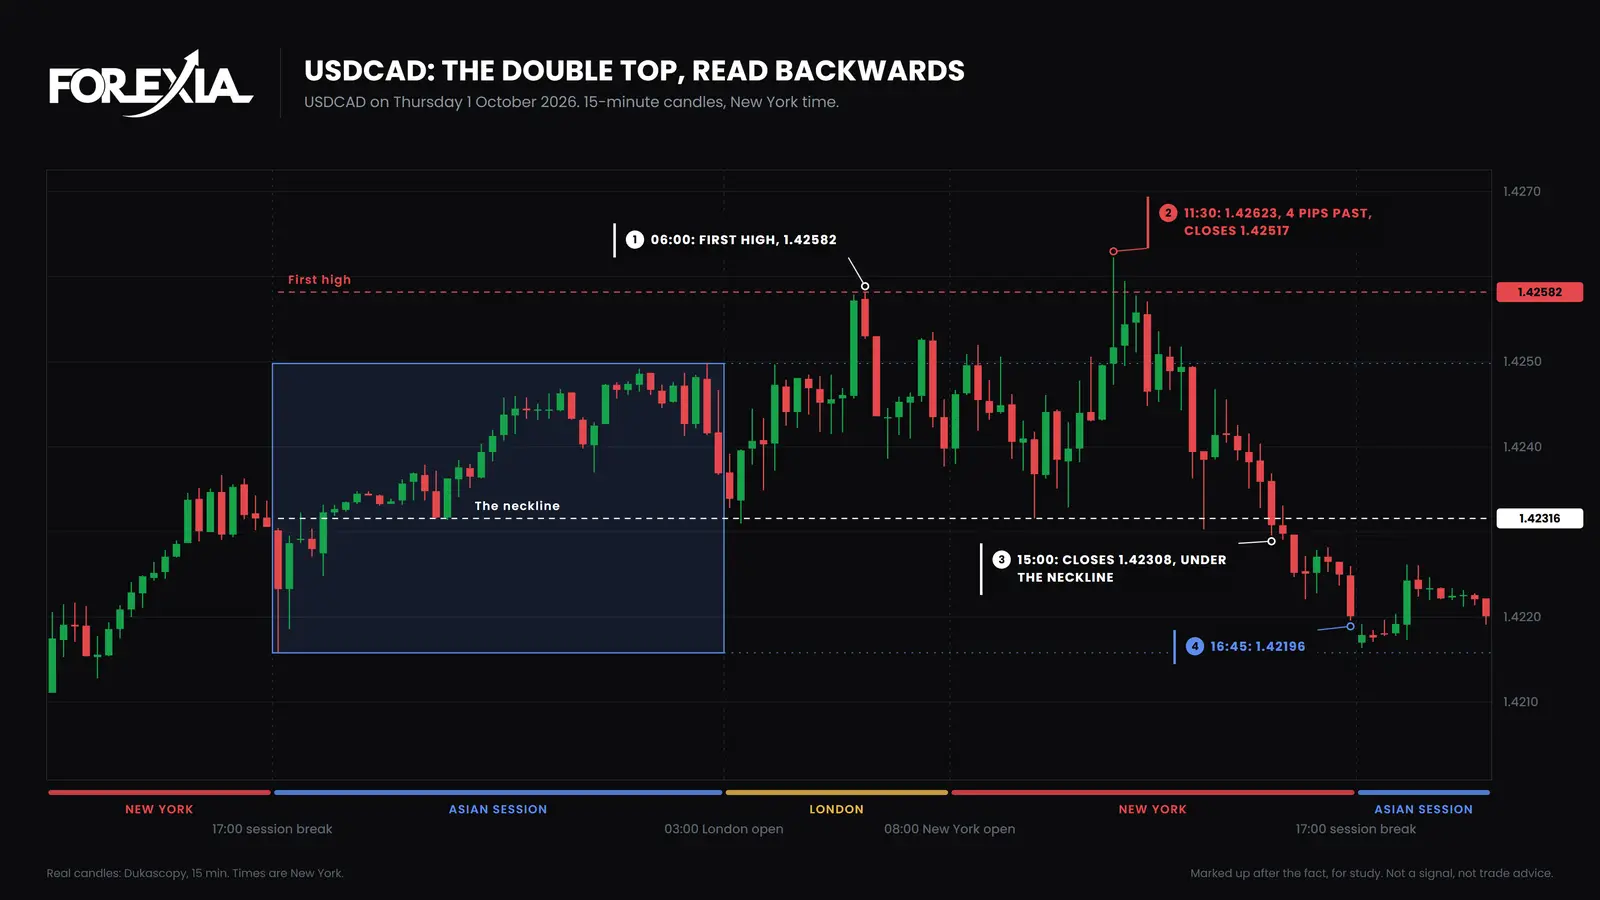
It was not a clean turn. The 11:45 candle went back to 1.42595, a pip over the first high, and closed under it at 1.42544. The next closed at 1.42558. For over half an hour price sat just under the line, and a buyer could still believe. Then 12:15 fell to 1.42448, and at 13:30 price traded to 1.42303, a pip through the neckline, and closed back over at 1.42385.
What did each seat see?
The same candles read differently from each of the three seats.
- Retail saw strength at 11:30: a rising week, a new high. Or it saw a second top to sell, with a stop just over the first. Both trades were on the chart before the candle printed, and the 11:30 candle went through the second one's stop.
- The market maker's seat, as we read it, saw two pools one above the other: stops over 1.42582, and stops under 1.42316. To sell, you need buyers, and a new high of the week brings them.
- The observer saw the order: a line, a run 4 pips past it, a close back on the same candle, a slow fall, a neckline broken. What the observer cannot say is who sold.
What did price do next, and how far did the book's signal get?
The first close under the neckline came at 15:00, at 1.42308, more than three hours after the high. That is the book's sell. By then about 31 of the eventual 43 pips were already gone, so the textbook signal arrived after most of that day's move.
By 15:45 price was at 1.42221. The last candle of the day reached 1.42196, 43 pips off the high, and closed at 1.42201. So the day's fall went through the stops under the neckline.
The book's target is the pattern's height, 31 pips, under the neckline. It did not come on Thursday. On Friday, US payrolls at 08:30 took price to 1.42014, within a pip of it. By 15:00 that same day price was back at 1.42611, a pip short of Thursday's high. That high held as the high of the week by one pip.
So this is a day that did what the shape says, with a neckline signal that caught the last quarter of the day's fall, and a book target that came near only on a release the next day, followed by a full round trip. Those facts all belong on the page.
What did a similar read do three days earlier?
It went the other way first. A case that only shows the winners teaches the wrong thing, so here is EUR/USD on Monday 28 September 2026, read the same way from the other side.
Asia ran 1.13735 to 1.13912, 18 pips, with Friday's low just under it at 1.13682. The 06:15 candle went to 1.13660, 2 pips past that low, and closed at 1.13726, back over. The crowd sold the break, and that close back looked like the end of it. Two and a half hours later, the 08:45 candle did almost the same: 1.13658, then a close at 1.13702.
The next candle closed at 1.13625. It went straight through both wicks. At 09:30, with the ECB's president due to speak, price went to 1.13569, and at 10:45 it reached 1.13531, the low of the day, 15 pips under Friday's low. Only then did it turn, with a double bottom of sorts under the level, and the 12:15 candle ran to 1.13879, 35 pips off the low. The day ended back at 1.13703.
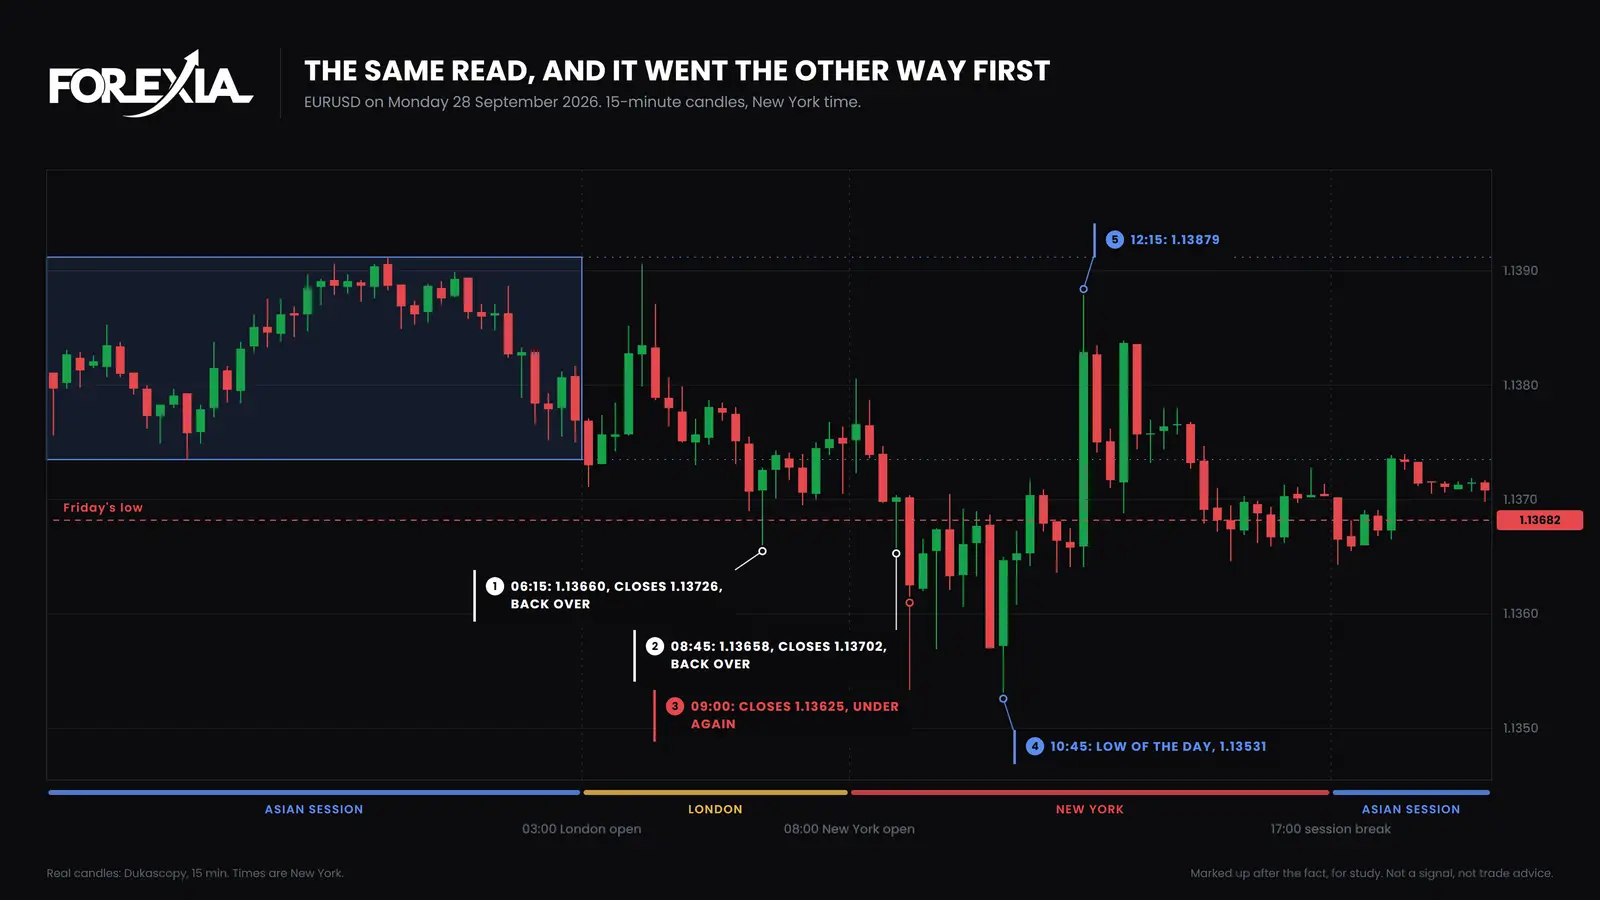
Same kind of level, same kind of candle, and two close backs that both gave way. The stop hunt had another leg, then another. Our stop hunt guide has the wider picture.
What does one double top prove?
Nothing, by itself, about the next. These two days are read after the fact, and we chose them. In our count of double tops and bottoms on 15-minute candles, on seven dollar majors and gold from 6 April to 1 October 2026, most of the 983 shapes never closed through the neckline that day before going past the peak. Our price action page has that count, and it covers shapes on candles and not trades. Run as a mechanical rule, our own test of the setup did not make money.
For more dated days, the USD/CAD M from May 2026 is the same shape on an earlier week, and our forex chart markups add more every week.
Common mistakes
All four would have made this day look cleaner than it was.
- Stopping the story at the close back. The next candle went a pip past the first high again.
- Quoting the raw range without looking at it. The 34-pip figure rests on a rollover wick.
- Crediting the neckline. By the time it gave the signal, most of the day's move was gone.
- Showing only the clean days. EUR/USD three days earlier went through two close backs first.
Course 3 of ForexiaPRO, Reverse Price Action, teaches this read step by step in lesson 3.4.1, Ten Real Days of Reverse Price Action: the Read, Then the Result.
Frequently asked questions
Was this USD/CAD double top a stop hunt?
We read it as one. The second high, 1.42623 at 11:30 New York, ran 4 pips past the first and closed back under it, with no release lined up with the candle. Nobody outside can see the orders, so who traded it and why cannot be shown from the chart.
Did the USD/CAD double top reach the book's target?
Not that day. The pattern's height, 31 pips, measured from the neckline at 1.42316, sat lower than the day's 1.42196. On Friday's US payrolls candle price came within a pip of it, at 1.42014, and later that day it was back at 1.42611, a pip short of Thursday's high.
Why does the markup say the Asian range was 34 pips, when it looks tighter?
Because the first two candles after the 17:00 rollover printed wicks down to 1.42158 and 1.42186, when spreads often widen. Leaving those two out, the session's low was 1.42248 and the range about 25 pips. The markup keeps the raw figure and we say which is which.
Does this day show the pattern works?
No. One day cannot show that, and we picked this one because it turned. EUR/USD three days earlier, on the same read, went past two close backs before it turned. Our own test of the setup as a mechanical rule did not make money.