How to Read the COT Report: One Real Row, From the Feed to the Index
Dylan Forexia10 min read
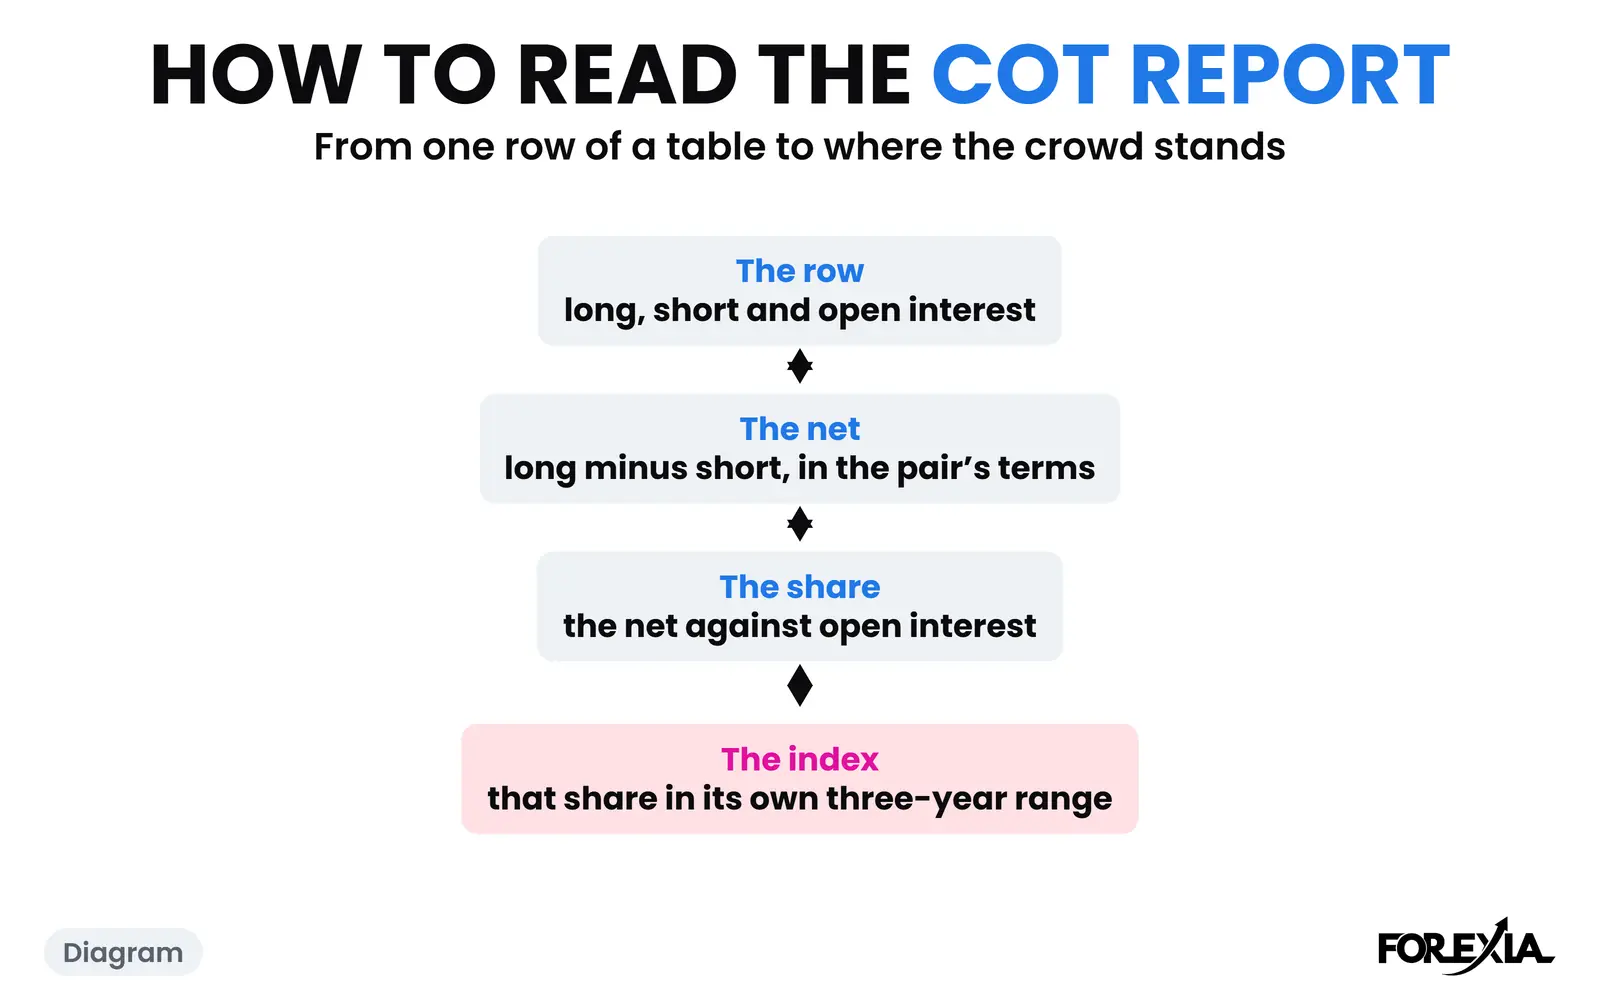
To read the COT report, find your market's row, subtract the large speculators' shorts from their longs, divide by open interest, and compare that share with its own three-year range. Turn the yen, franc and Canadian dollar round first. Below is one real row worked in full, with the columns most guides skip.
Our guide to the Commitment of Traders report says what it is and who files it. This page is the routine, on the Australian dollar as counted on Tuesday 20 October 2026 and published on Friday 23 October. Every position figure comes from the CFTC's feed, and every price from our 15-minute Dukascopy candles, named by when they open, in New York time.
How do you read the COT report? Start with one row
Start with the contract, not the pair. We use the legacy report, futures only, from the CFTC's COT page or its public feed. Which report to choose is a question for legacy vs disaggregated vs TFF. Our row is "Australian Dollar - Chicago Mercantile Exchange", code 232741, 100,000 Australian dollars a contract. Open interest, the contracts not yet closed, was 333,010, down 6,454 on the week.
| Non-commercial long | Non-commercial short | Spreading | Commercial long | Commercial short | Nonreportable long | Nonreportable short | |
|---|---|---|---|---|---|---|---|
| Contracts | 98,419 | 225,711 | 1,279 | 201,947 | 87,022 | 31,365 | 18,998 |
| Change on the week | +30 | +10,023 | −1,125 | −5,184 | −13,739 | −175 | −1,613 |
| Share of open interest | 29.6% | 67.8% | 0.4% | 60.6% | 26.1% | 9.4% | 5.7% |
| Traders | 38 | 18 | 7 | 39 | 22 |
Non-commercial means the large speculators, whom we call the crowd. Commercial means traders using the futures to hedge. Nonreportable is what is left once every position above the reporting level is taken away, so it has no trader count.
Does the row add up?
Yes, and checking it teaches the most useful thing in the table. Every long has a short, so each side must reach open interest.
- Longs: 98,419 + 1,279 + 201,947 + 31,365 = 333,010.
- Shorts: 225,711 + 1,279 + 87,022 + 18,998 = 333,010.
So the three net positions add up to zero: speculators 127,292 short, commercials 114,925 long, small traders 12,367 long. A crowd is never the whole market. Here the commercials held most of the other side.
The small traders are not your broker's clients, either. Spot forex is outside this report altogether. And the crowd here is not Dumb Money, our word for the retail herd: these are large funds and trading firms.
How do you get the net position, and which way round is it?
Subtract the short column from the long column and leave spreading out. Spreading is a trader's equal long and short positions, so it carries little bet on direction.
98,419 − 225,711 = −127,292 contracts.
Australian dollar futures run the same way round as AUD/USD, so that is a net short of the pair. The yen, franc and Canadian dollar do not, and why the yen COT looks backwards sets out the trap. A turned-round row comes further down.
What is the share, and why not use the net alone?
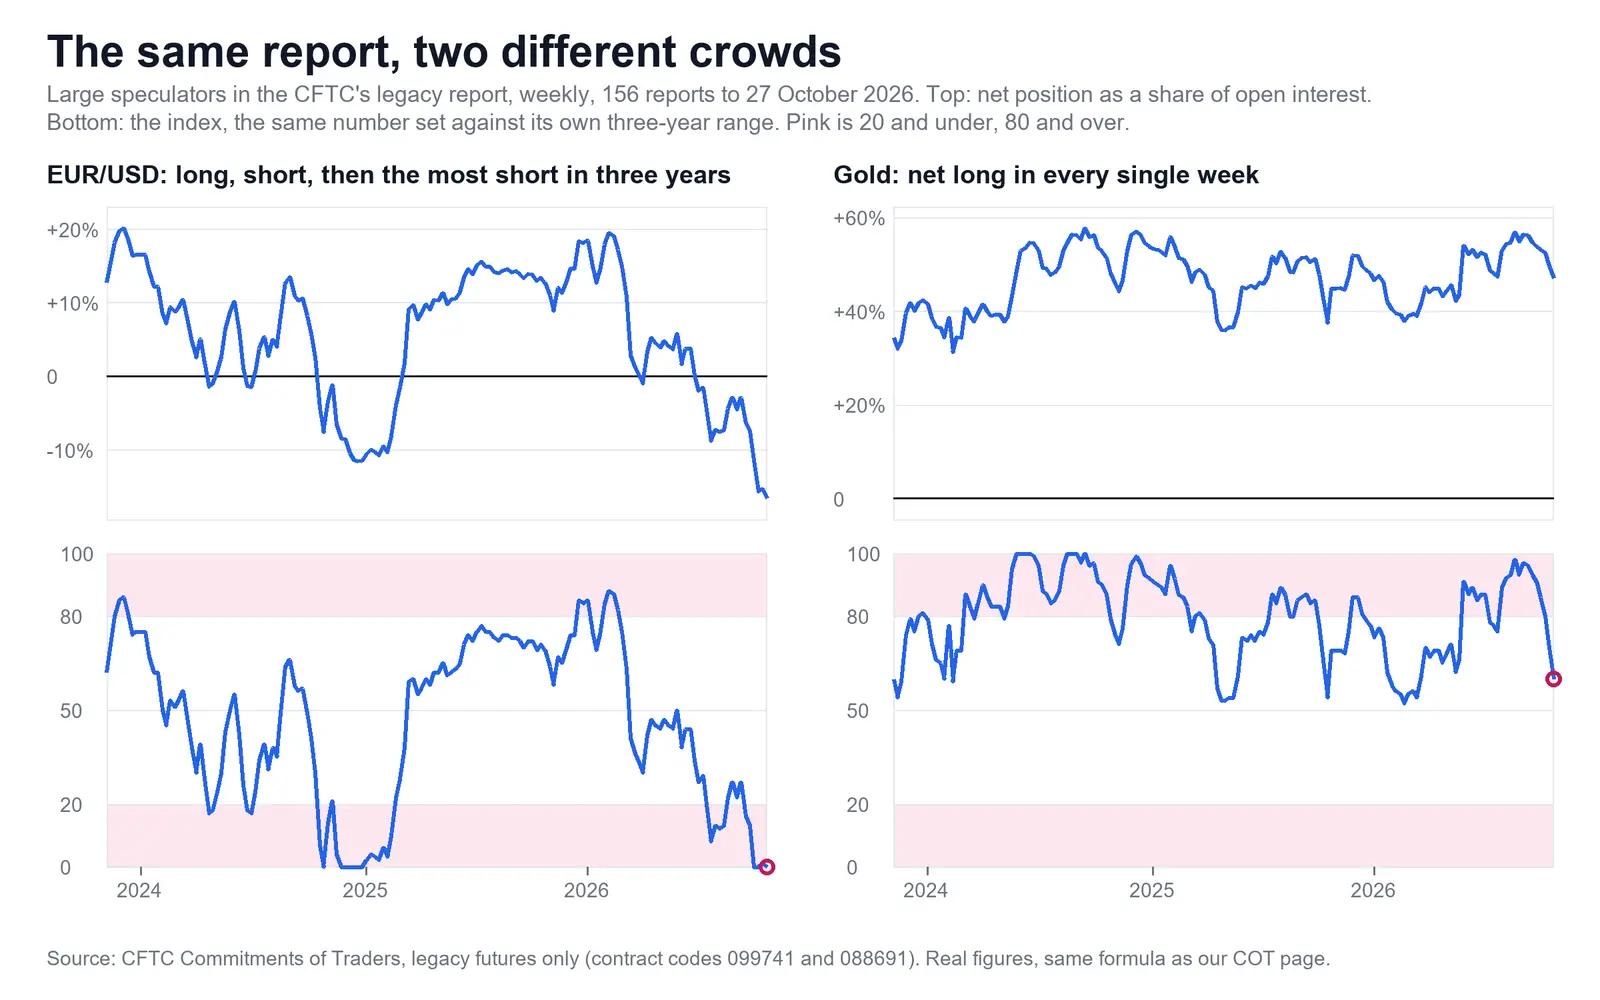
The share is the net divided by open interest: −127,292 ÷ 333,010 = −38.2%. The report nearly hands it to you, because 29.6% − 67.8% is the same figure.
Use it because open interest moves. On this contract it fell from 493,141 on 15 September to 306,488 on 22 September, by 186,653 contracts in the week around September's quarterly expiry. The net went from 38,906 short to 46,814 short, about a fifth bigger. The share went from 7.9% to 15.3%, nearly double. A chart of raw contracts would have shown a small change.
Where does the index put that share?
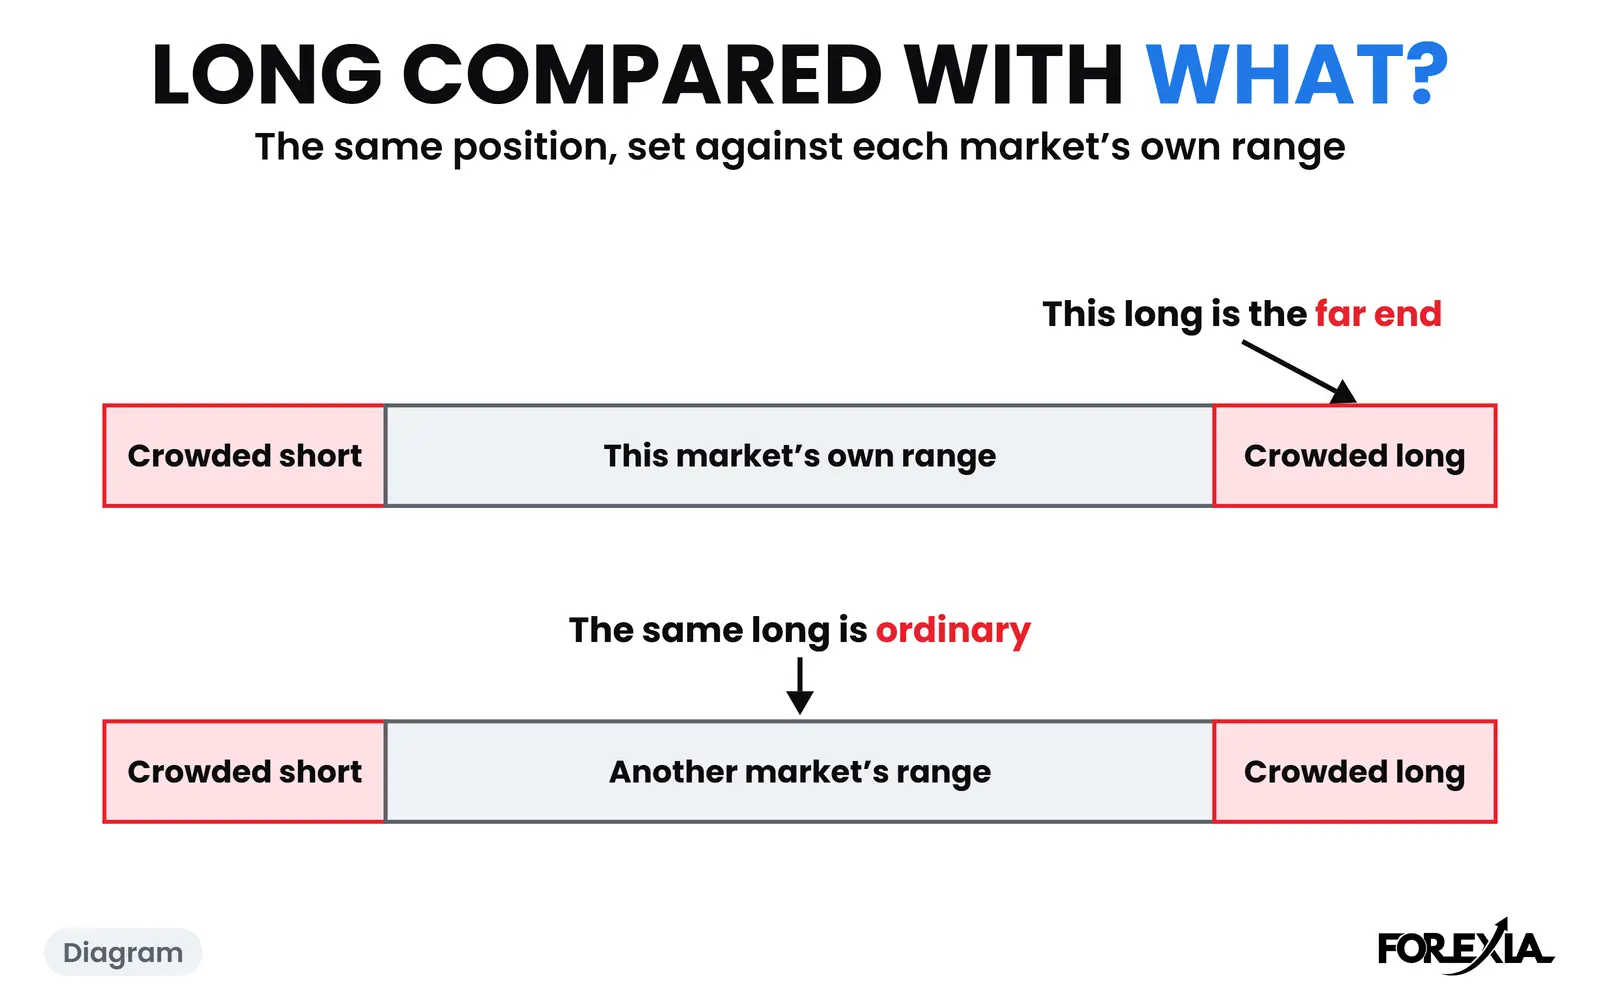
At 17, near the short end of the crowd's own range. The index asks where this share sits between the lowest and highest of the last 156 reports, which here run from 31 October 2023:
- Lowest share: −52.6%, on 26 August 2025.
- Highest share: +30.9%, on 31 March 2026.
- Index: (−38.2 − −52.6) ÷ (30.9 − −52.6) × 100 = 14.4 ÷ 83.5 × 100 = 17.
The week before it was 22, so this was the first report under the line of 20 that we call crowded since 2 December 2025. On 12 May the same group was net long 84,990 contracts at an index of 98. It crossed most of its range in just over five months.
The CFTC publishes no index. Ours is one choice among several, as what the COT index means explains, and what counts as a COT extreme compares the lines.
How did the crowd get there?
The change columns answer that, and a net cannot. This week longs rose by 30 and shorts by 10,023, so the whole move was new selling. Over the four weeks from 22 September, shorts rose by 70,364 and longs fell by 10,114, while AUD/USD went from 0.71144 to 0.70022 at Tuesday's close, 112 pips lower.
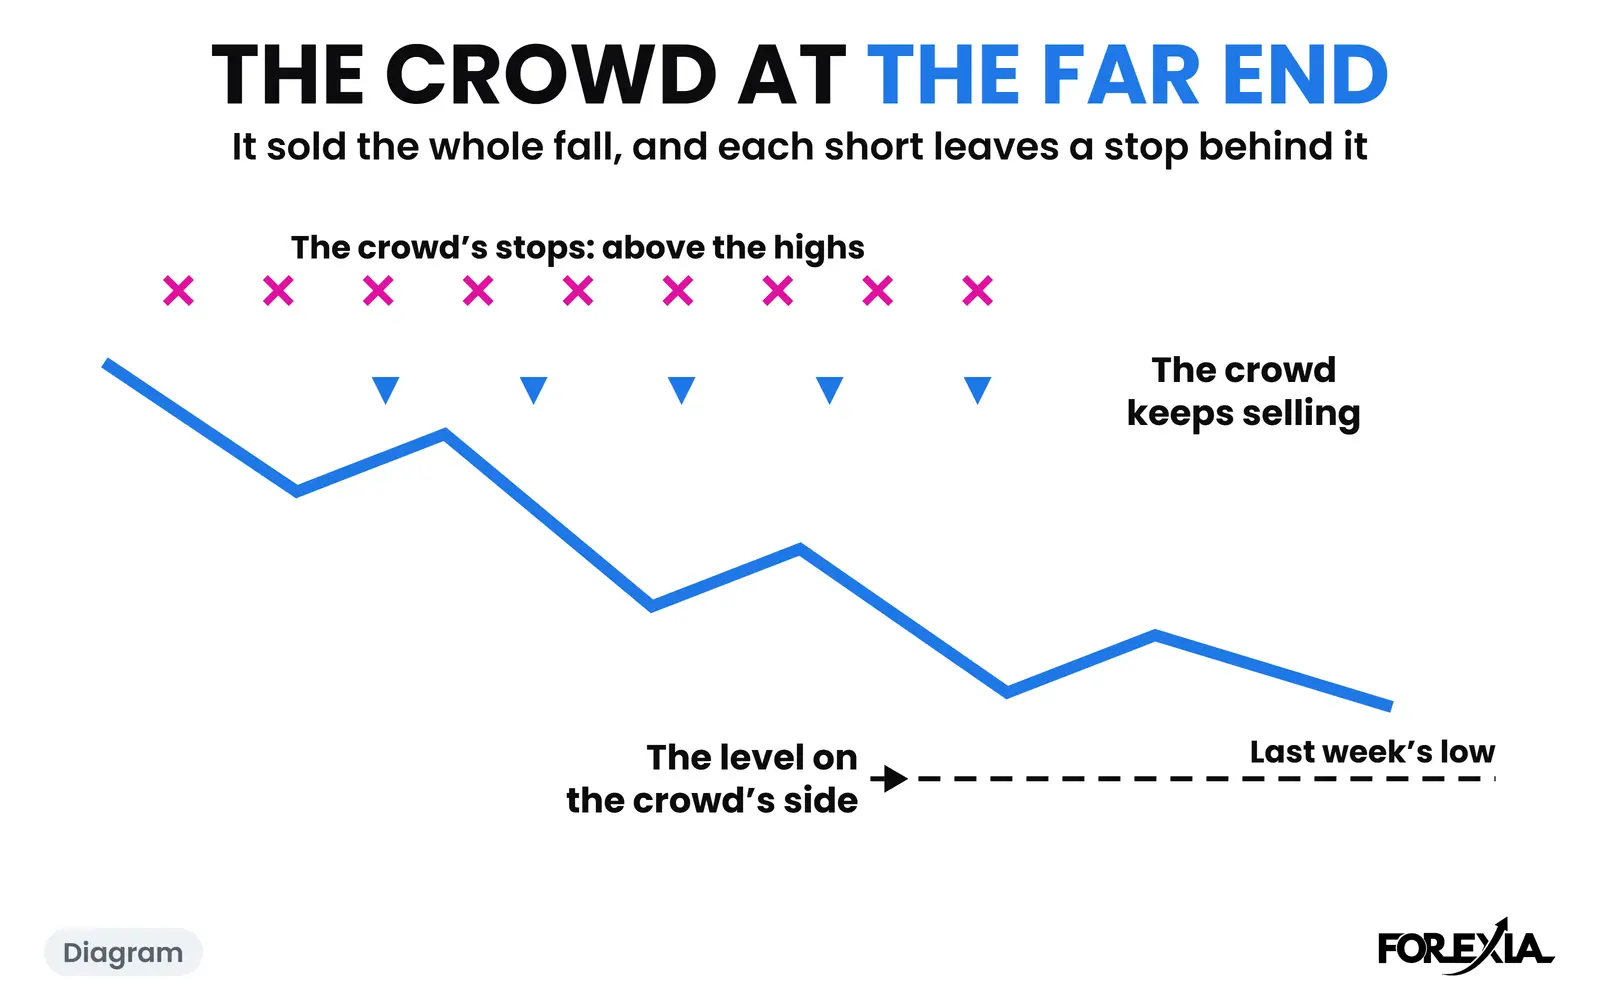
The same net can come from new shorts or from longs leaving. We read those differently. A new short has to be bought back one day, often from a stop above the highs. A long that has left has nothing more to do. That is our reading, and the report holds no stop orders.
How many traders is "the crowd"?
On this row, 18 non-commercial traders on the short side. They held 67.8% of open interest, an average of about 12,500 contracts each. The 38 on the long side averaged about 2,600.
The report's long format goes further. Its concentration ratios give the share held by the four and eight largest traders, whichever group they are in. That Tuesday the four largest held 74.0% of all short positions and 42.6% of all long ones. We cannot say those four are speculators.
Compare the Canadian dollar below, counted on 11 August, where 46 non-commercial traders were short and the four largest of any kind held 28.2% of all short positions. So "the crowd" is a word of ours. On this row it means 18 accounts on the crowded side, and a few of them closing could move the index a long way without any change of mind among the rest.
Does the TFF report tell the same story?
Not on this row. The Traders in Financial Futures report sorts the same contract on the same Tuesday by type of business:
| Group | Long | Short | Net |
|---|---|---|---|
| Asset managers | 80,700 | 209,439 | −128,739 |
| Leveraged funds | 88,761 | 36,264 | +52,497 |
| Dealers | 125,601 | 65,327 | +60,274 |
Picture a speculator and you probably picture a hedge fund. In TFF the leveraged funds were net long, and the big short sat with asset managers, who may be hedging something the report cannot show. The two reports sort traders differently, so these are not provably the same accounts. We keep the legacy series because it means the same thing on all eight markets, and we read TFF beside it as a check on the label.
What does a turned-round row look like?
The Canadian dollar counted on Tuesday 11 August 2026 is one. The row says 12,854 long and 186,216 short, with open interest of 364,104. In the futures that is 173,362 short, and a reader who sees "funds short" may sell USD/CAD. Long Canadian dollars is short the pair, so turned round this is 173,362 long USD/CAD, a share of +47.6%. Against a range of −12.5% to +55.8%, the index is 88.
Friday's report also describes Tuesday. USD/CAD closed that Tuesday at 1.39222. When the report came out at 15:30 on 14 August, price was near 1.38733, 49 pips lower. How old the data is has a page of its own.
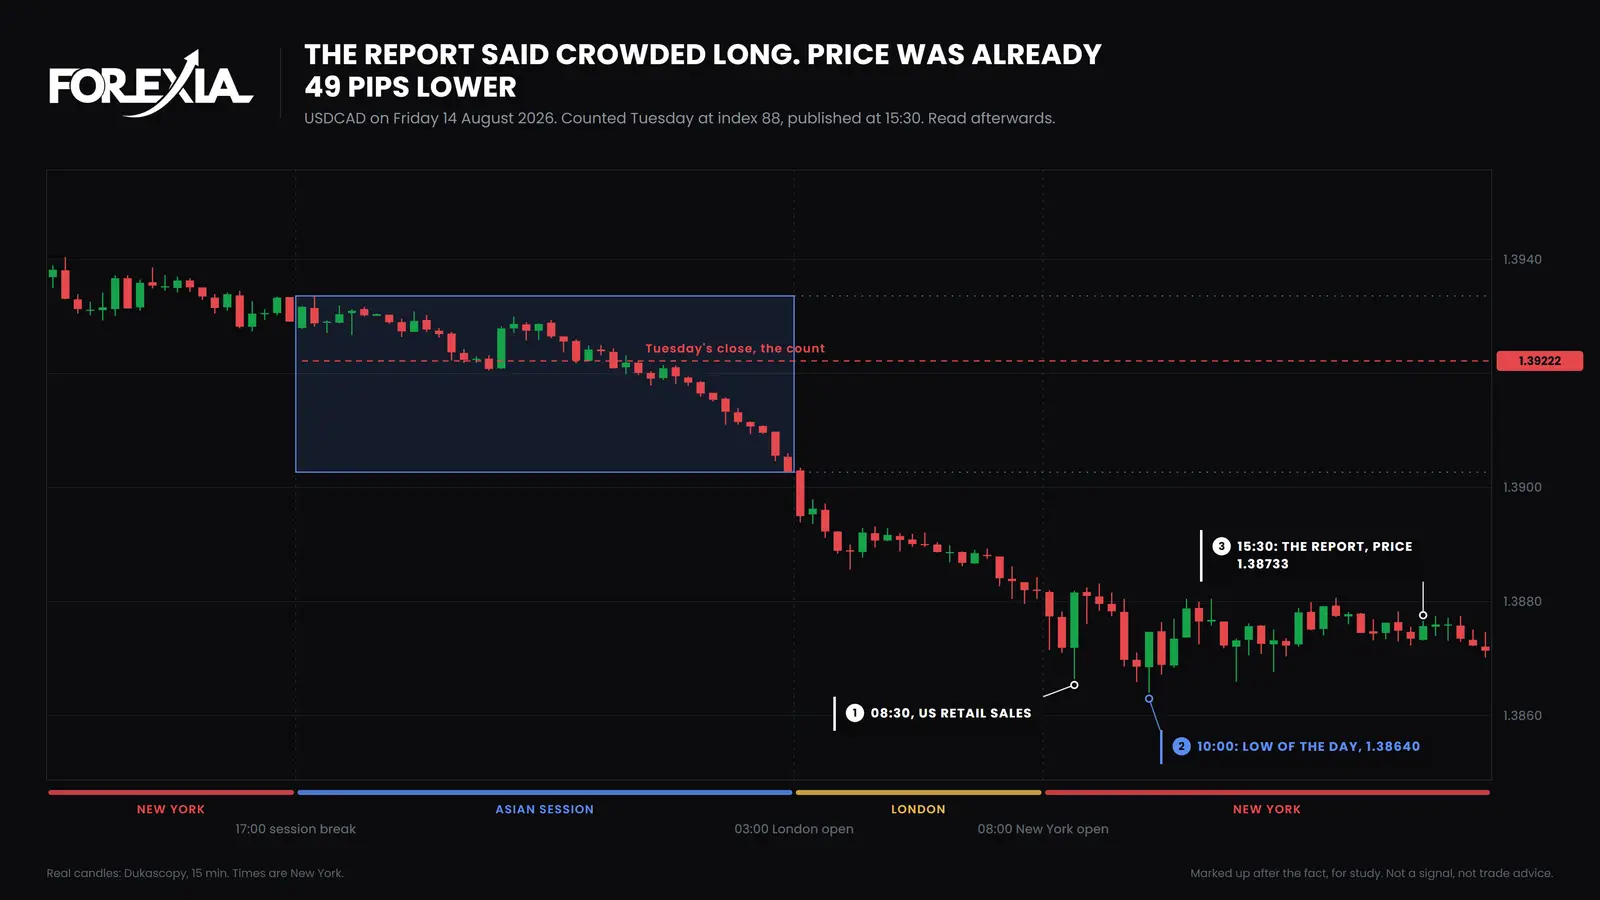
Now follow the reading. It reached 81 on 23 June, with USD/CAD closing at 1.42093, and stayed at 80 or over for nine reports. By 11 August price was 287 pips lower and the crowd had added 26,570 contracts. A crowded reading did not stop it being wrong for seven weeks, and it said nothing about when that would end. By 15 September the net long was down to 37,577, an index of 34, with price at 1.39144, about where it had been on 11 August, after trading as low as 1.37318 on 21 August. Most of the position went while price went nowhere in the end.
This market also leans one way. It was crowded long in 82 of the 156 reports to 29 September 2026, so an 80 here says less than an 80 on the euro.
What does a finished reading look like?
One sentence, written down: on 20 October the crowd on AUD/USD was net short 127,292 contracts, 38.2% of open interest, index 17, built on new shorts, with 18 accounts on the short side.
On this row we read the short side of AUD/USD as the one not to join, which is Fade the Crowd. The row said nothing about whether price would rise. For one week read through several groups and followed for a fortnight, see the COT report on EUR/USD.
Here is what price did after that sentence, read afterwards. Last week's high, one of the week's highs and lows, was 0.70381, from Friday 23 October. Price first traded over it on Sunday evening, 25 October, and closed over and back under it several times in the next three days. On Wednesday 28 October the 14:30 candle, with the Fed's press conference, closed over it at 0.70551, and the closes stayed over. At 21:15 New York that night price reached 0.70676, 30 pips above. We read that run as the stop hunt, a liquidity sweep of the stops above the level, because a short crowd's stops rest above the highs. The Fed is a plain explanation for the move, the report holds no stop orders, and nothing shows anyone aimed at that price. The 04:30 candle on Thursday closed back under it at 0.70358, which is the close back.
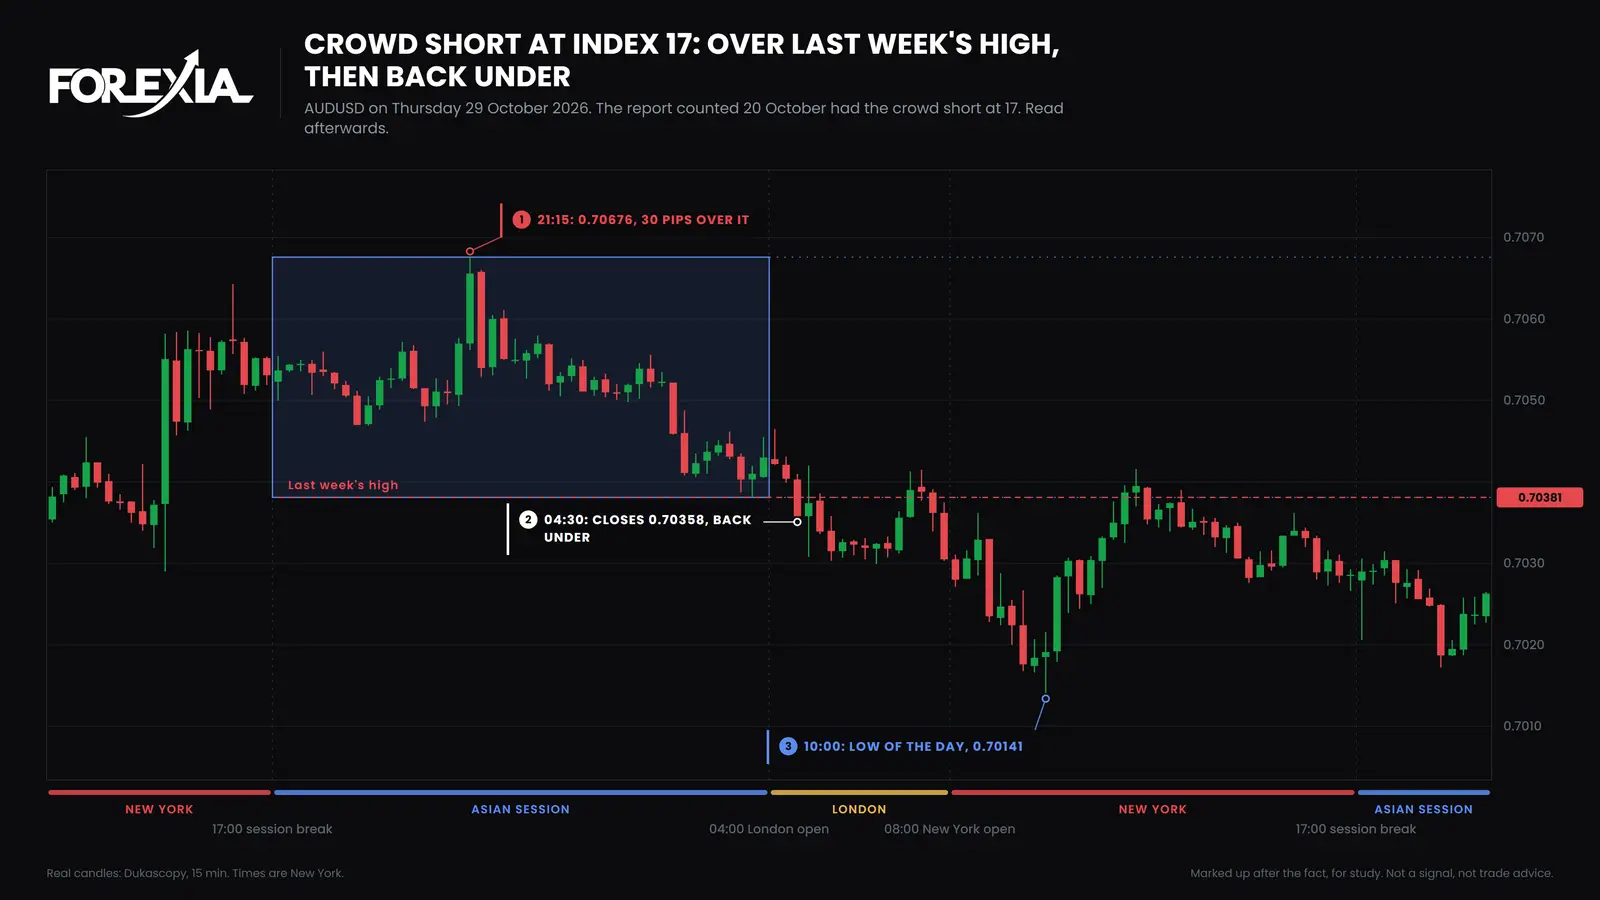
By 10:00, after US growth and inflation data at 08:30, price was at 0.70141. The day ended at 0.70286. That fall went the crowded side's way, while price still sat above the 0.70022 of Tuesday 20 October. The report counted on Tuesday 27 October, published on Friday 30 October, had the crowd at 16, and it was counted before the Fed and before that high. One day seen afterwards is not a setup, and it does not show the reading worked.
What can you not read from the report?
Quite a lot, whichever way you use it:
- Who. The four largest traders are unnamed, and the groups are broad.
- Why. A short may be a bet or a hedge. No column says.
- When. USD/CAD shows that a reading can last for months.
- Spot forex. It counts US futures, and it is a sample of the wider market.
We tested the report as fixed rules, once with the crowd and once against it. In words: joining a crowded side lost, and fading it is promising and not proven.
What goes wrong when people read it?
Four errors come up most, and the row above has a check for each.
- Comparing nets across markets. A share compares better, and an index compares each market with itself.
- Reading a short in the futures as a short of the pair. Check which way round the contract runs.
- Treating a low index as a low position. USD/CAD's speculators at 34 were still net long.
- Mixing formats. Futures only and futures and options combined give different figures, so keep to one.
Course 1 of ForexiaPRO, Reading the Map, teaches this read step by step in lesson 1.3.4, Reading This Week's Report.
Frequently asked questions
Which columns of the COT report do I need?
For the net position, the large speculators' long and short, which the legacy report labels non-commercial, and open interest. The week's change columns then show whether new shorts or departing longs moved the net. The number of traders and the concentration ratios show how few accounts hold it.
Why does another site show a different COT index for the same week?
Because the CFTC publishes no index, so every site chooses its own. Some use raw contracts in place of a share of open interest, and some use a window of six months or a year. Ours is the net as a share of open interest over 156 weeks. Check the formula before comparing two numbers.
Should I read the commercials or the large speculators?
We follow the large speculators, because one group then means the same thing on all eight markets. Commercials are mostly the other side of that position: in any row the three groups' net positions add up to zero. On the Australian dollar on 20 October 2026 commercials were net long 114,925 against the speculators' 127,292 short.
Do I need to turn every market round?
No, only the futures quoted the opposite way to the pair. Yen, Swiss franc and Canadian dollar futures need turning round for USD/JPY, USD/CHF and USD/CAD. The euro, pound, Australian dollar, New Zealand dollar and gold do not.
Does a low index mean price will rise?
No. An index of 17 says the crowd is near the short end of its own three-year range. It holds no information about when, or whether, price turns. USD/CAD stayed at 80 or over for nine reports in 2026 while price fell, so a reading can sit at an extreme for months.