Why Does Price Spike Both Ways on FOMC? One Minute, Two Pairs, Two Candles
Dylan Forexia8 min read
Why does price spike both ways on FOMC? A Fed day has two known minutes, the decision and the press conference, and each brings orders in at once. We read the spikes as stops firing on both sides of thin quotes. "Both ways" means three separate things, though: inside one candle, across the two minutes, and across two pairs. Real days show each.
The Federal Open Market Committee meets eight times a year on a published calendar. On the Fed days on our calendar the decision came at 14:00 New York and the press conference at 14:30. Four of the eight meetings also bring the committee's economic projections. The read that applies News-Induced Liquidity to those minutes is On FOMC. All times here are New York, and a candle is named by the time it opens.
Why does price spike both ways on FOMC?
Start with what is new at 14:00. A statement, a rate, and on some meetings projections all land together, and at 14:30 the chair starts talking. That is real news, arriving twice, and people can honestly change their minds between the two. Any explanation has to start there.
Our read adds the stops. By 14:00 a quiet day has left levels close to price on both sides, with orders resting past each. When quotes are thin, one triggered stop can push price into the next, and the same can happen in the other direction seconds later. That can print a spike each way with nobody aiming at anything.
Nobody outside can separate those causes, because spot forex has no public order book. So the rest of this page sticks to what prices show, and they show three kinds of "both ways".
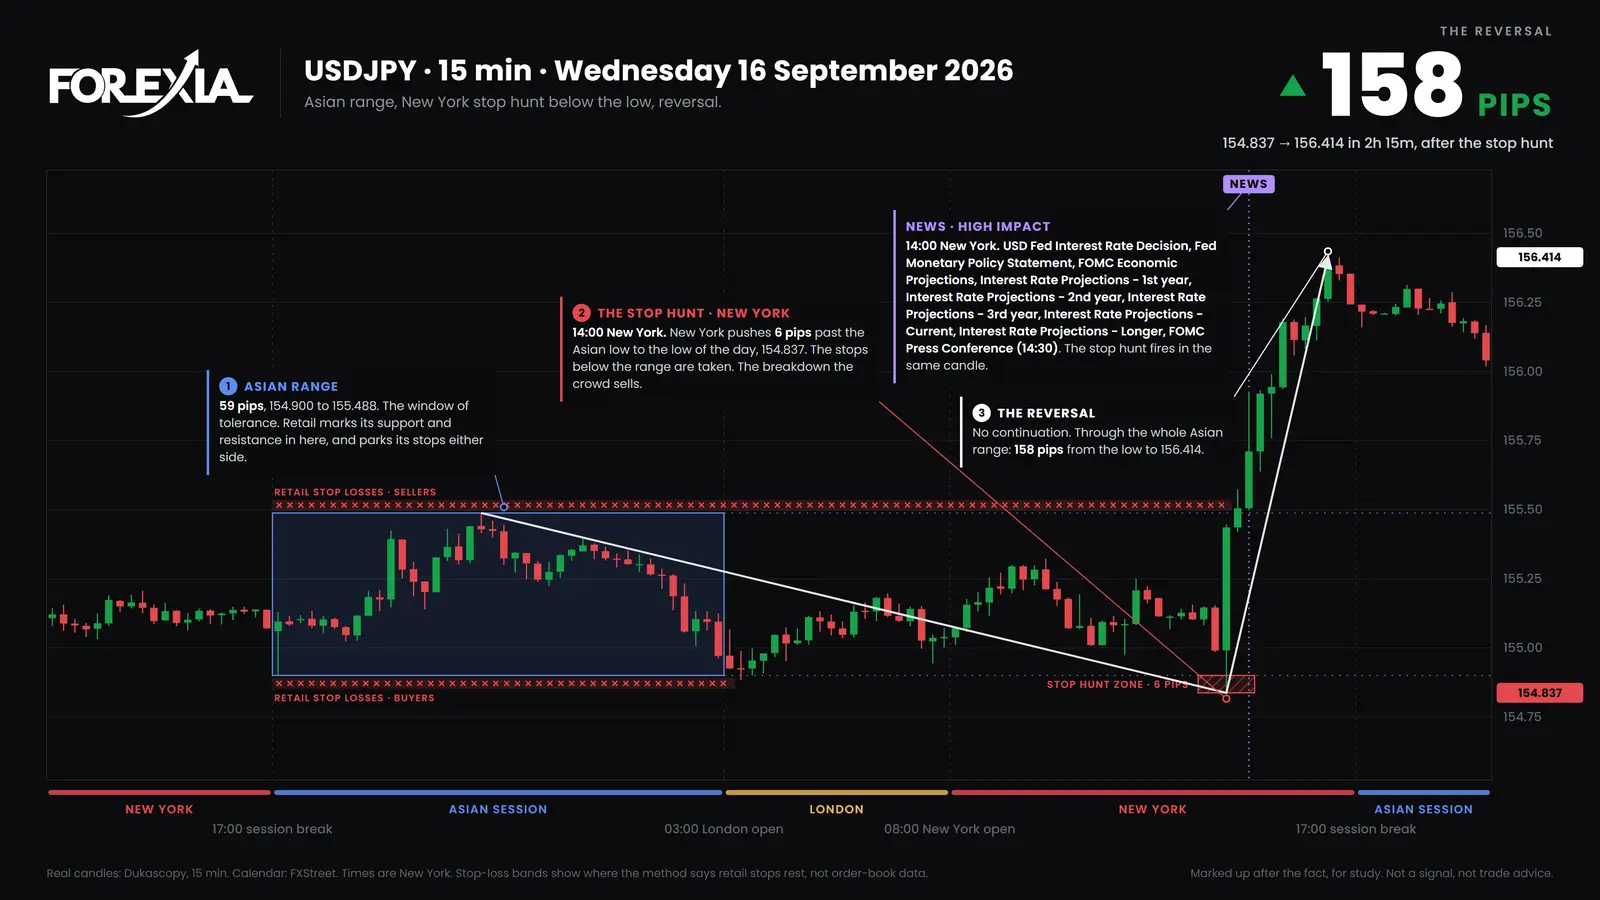
Two pairs, one minute: AUD/USD and USD/JPY, 16 September 2026
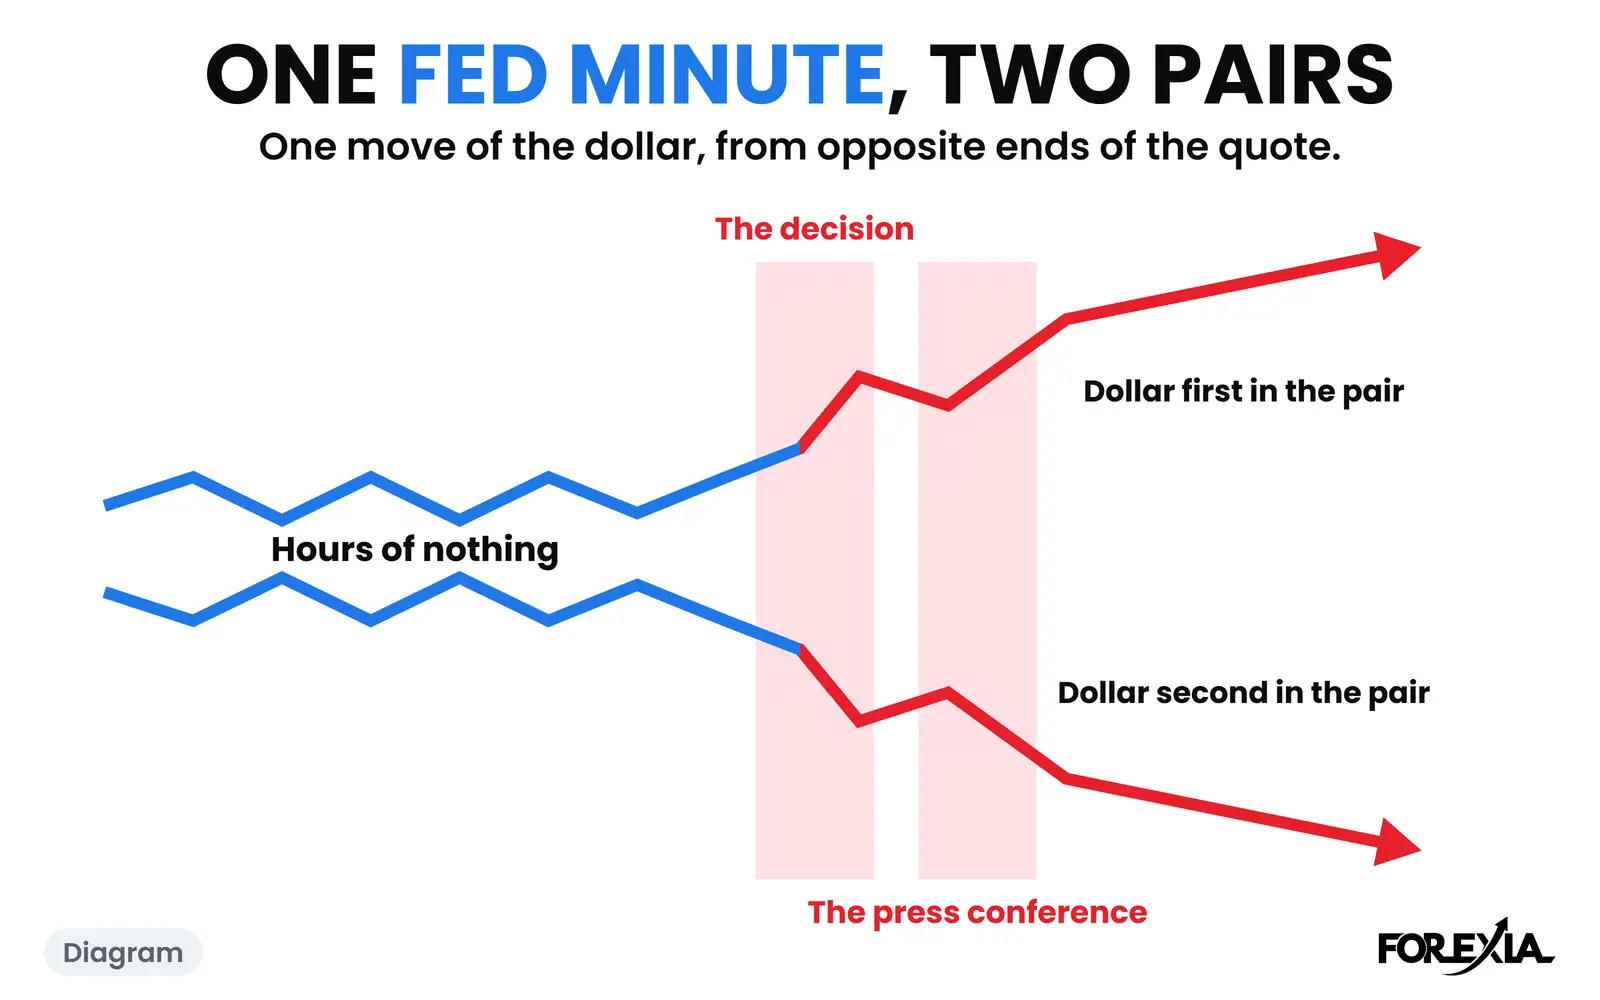
The first kind is the one traders notice on two charts at once. On Wednesday 16 September 2026, AUD/USD made its high of the day and USD/JPY its low in the same minute.
Here is the first minute of the decision on each, from one-minute candles:
| 14:00 minute | Open | High | Low | Close |
|---|---|---|---|---|
| AUD/USD | 0.71350 | 0.71395 | 0.71246 | 0.71255 |
| USD/JPY | 154.991 | 155.120 | 154.837 | 155.106 |
AUD/USD went 4.5 pips over its open and 10 under it. USD/JPY went 15 pips under its open and 13 over it. So each pair ran both ways inside sixty seconds, and our data cannot say which end came first. Each closed the minute near the side the dollar was heading, down on AUD/USD and up on USD/JPY, because the dollar is the second currency in one quote and the first in the other.
That is the key to the day. All eight of our markets closed the 14:00 candle on the same side of a stronger dollar: EUR/USD, GBP/USD, AUD/USD, NZD/USD and gold down, USD/JPY, USD/CHF and USD/CAD up. We read that as one move of the dollar. Two opposite charts on one minute are not two opposite ideas, and they are not two confirmations either.
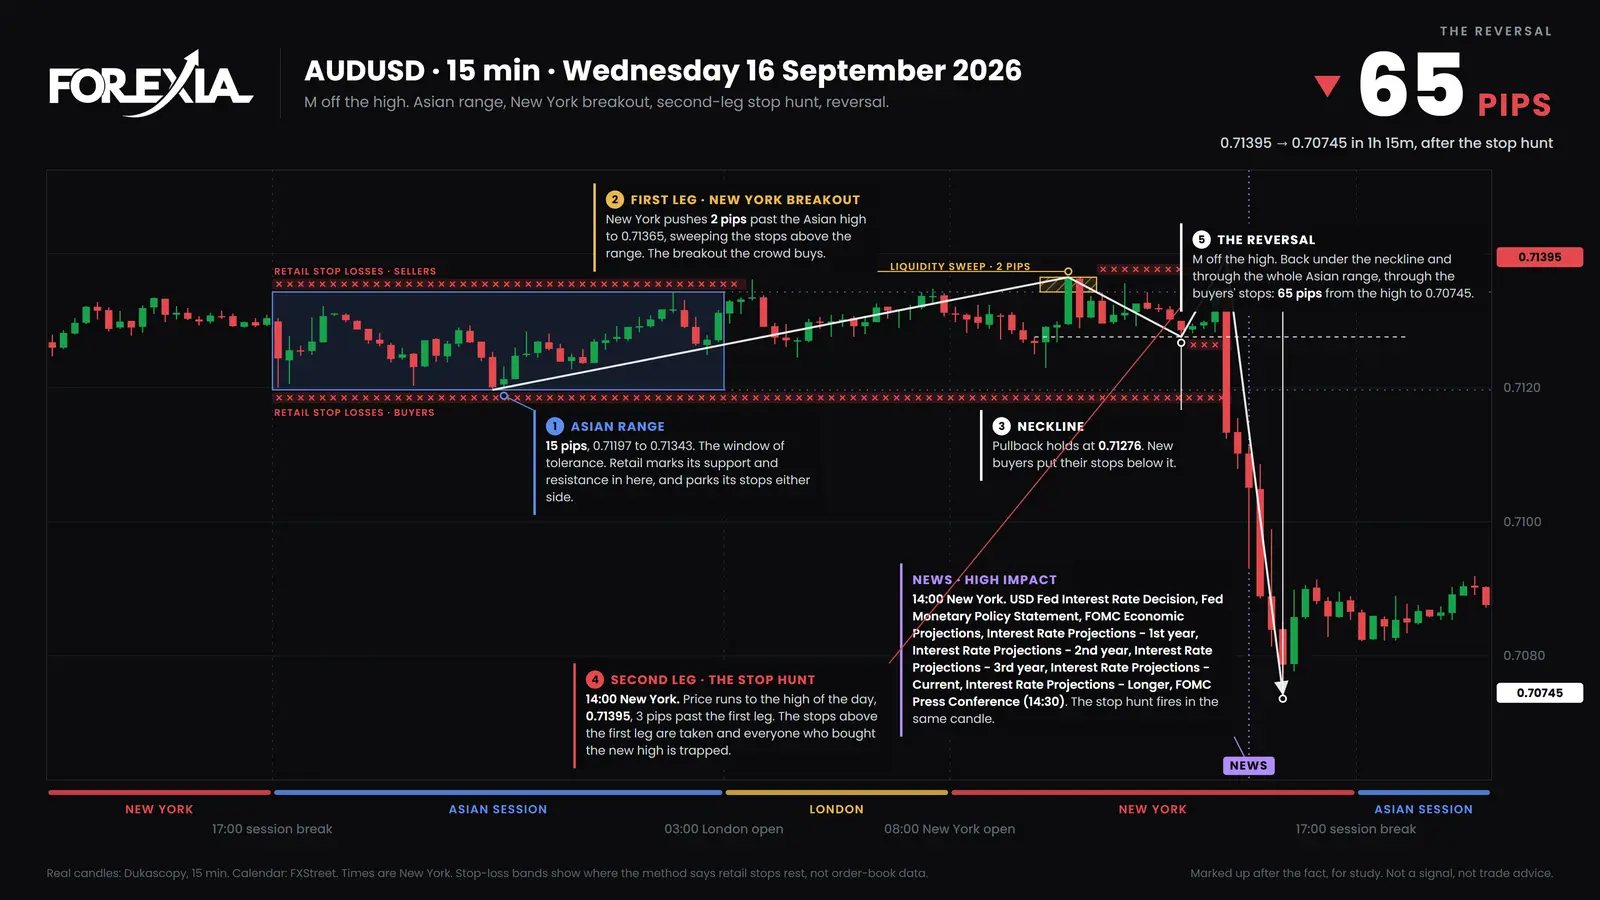
The two candles then went their ways at their own speed. AUD/USD closed the 15-minute candle at 0.71133, near its low and 6 pips under the Asian Box. USD/JPY closed at 155.436, a pip under its high, after going 6 pips under the Asian low of 154.900 and 5 under London's low of 154.884.
The second minute: what the press conference did
The second kind of "both ways" is the two minutes disagreeing, or one candle undoing part of the last. On 16 September the press conference candle went further the same way on both pairs, and then gave a good part of it back before it closed.
- AUD/USD. The 14:30 candle ran from 0.71113 to 0.70930, 18 pips down, and closed at 0.71051, 12 pips off its low.
- USD/JPY. It ran from 155.498 to 155.926, 43 pips up, and closed at 155.711, 22 pips off its high.
Neither candle held an end of the day. AUD/USD's low came on the 15:15 candle at 0.70745, and USD/JPY's high on the 16:15 candle at 156.414. Our count says that is the rule for this candle. On four Fed days and eight markets from 29 April to 16 September 2026, the 14:30 candle held the day's high or low on none of 32 market-days. A candle holds when its high is the day's high or its low the day's low, session break to session break, on 15-minute candles. The 14:00 candle held on 5 of 32, all five on 16 September, and on 20 of 998 on other days. Four Fed days is very few, on one feed, with eight markets moving on one dollar, and it counts candles, not trades.
One candle, both ways: USD/CHF, 29 July 2026
The third kind is the one that does the most damage, because it can stop both sides. It came on the press conference on Wednesday 29 July 2026, a meeting with no projections.
USD/CHF had already made its high at 12:30, 0.82066, 2 pips through Tuesday's high of 0.82048 and an hour and a half before the Fed. We read that as the second leg of an M, the Second Leg Climax. So the decision came with the top already in. A high that early is no evidence anyone knew anything, and our calendar has no US or Swiss release at that time to explain it.
The 14:00 minute printed 0.81992 and 0.81659, 33 pips with both ends inside sixty seconds, and it closed at 0.81690. The 15-minute candle closed at 0.81670, and the next candle rose to 0.81815. Then the press conference candle opened at 0.81746, and this time the minutes show its order:
- 14:30. Down to 0.81692, 5 pips under its open.
- 14:31 and 14:32. Up to 0.81879, 13 pips over its open.
- 14:36 to 14:44. Down all the way to 0.81614, 13 pips under its open and 3 under the decision candle's low. The candle closed at 0.81627.
So that one candle went 13 pips each way from its open, with the low in its last minute. A seller of the decision with a stop over the 14:15 candle's high of 0.81815 went at 14:31. A buyer of the bounce with a stop under the decision low went at 14:44. Both sides lost inside one candle. Price then kept falling, to the low of the day at 16:45, 0.81322, 74 pips off the high.
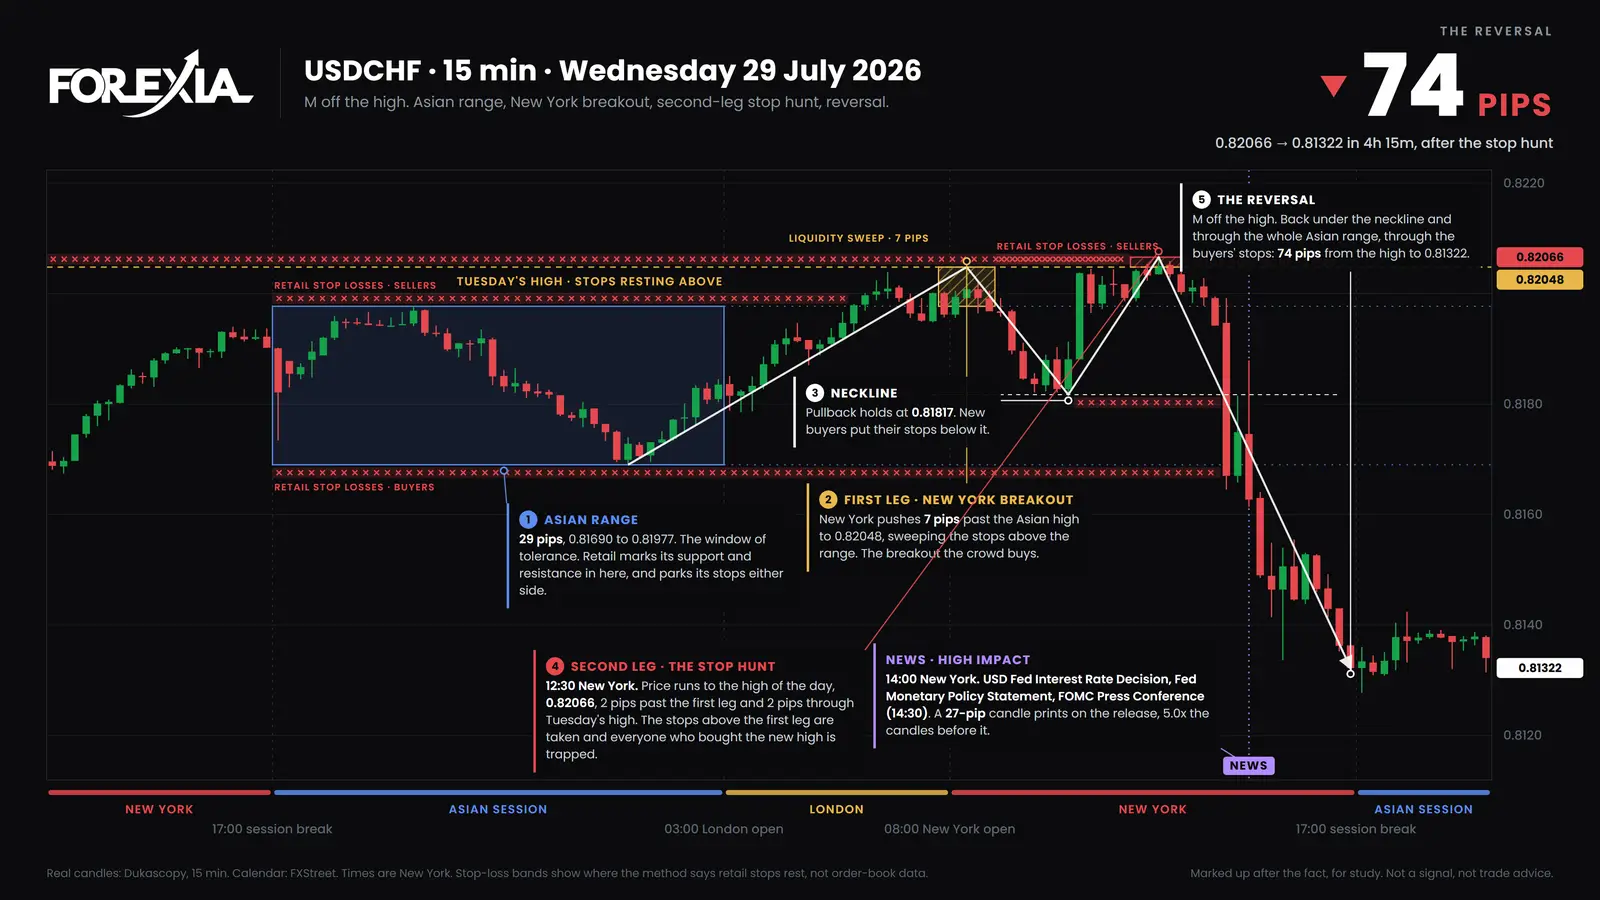
Neither Fed candle held anything that day, on this market or on the other seven. That is the usual Fed day, and 16 September is the striking one. We chose both.
What did each seat see?
The Three Seats split these candles as follows.
- Retail listened for one word to set the dollar's direction. On 29 July USD/CHF's press conference candle went 13 pips each way, and no single word explains both.
- The market maker, as we read it, had two levels 17 pips apart on 29 July: the 14:15 candle's high at 0.81815 and the decision candle's low at 0.81645. The press conference candle went through both. That anyone aimed at them is a reading, not something a chart shows.
- The observer wrote down the order. Over the 14:15 high at 14:31, under the decision low at 14:44, and a close at 0.81627 near the bottom. That much can be stated from the prices.
Is a move like this an FOMC stop hunt? Sometimes, and the name comes afterwards. USD/JPY's 14:00 candle on 16 September took the stop hunt's shape, a liquidity sweep of the stops under the box. AUD/USD's candle crossed the whole box in one go. USD/CHF's press conference was neither: the high was already in and the candle just ran both ways on its way down.
Common mistakes
Four habits make a Fed day look more readable than it is.
- Reading two pairs as two signals. AUD/USD and USD/JPY on 16 September were one move of the dollar. The same goes for gold.
- Treating the decision candle's low as the floor. On USD/CHF on 29 July the 14:30 candle went 3 pips under it, in its last minute, after first running 13 pips over its open.
- Trusting a candle's close in that half hour. USD/JPY's decision candle closed a pip under its high, and the first minute of it had gone 15 pips under its open. A close says where the candle stopped, not who survived it.
- Expecting a Fed candle to hold the day. On 29 July neither did, on any of the eight markets. USD/CHF's high was an hour and a half old at the decision, and its low came two and three quarter hours after it.
What happens in the hours before is on what price does before the FOMC decision, and a Fed day we read wrong is in FOMC news trading in forex. The committee itself is explained in what FOMC means in forex, and other markets on 16 September are in the markups of 14 September 2026. The wider guide to news trading forex sets the Fed beside the other releases. These days were picked afterwards. A move seen afterwards is not a setup, and our own fixed rule of fading hunts on high-impact releases lost money after costs.
Course 2 of ForexiaPRO, The Chaos Pattern, teaches this read step by step in lesson 2.3.3, NFP, CPI, FOMC: One Read, Three Calendars.
Frequently asked questions
Why does price spike both ways on FOMC?
A Fed day has two known minutes, the decision at 14:00 New York and the press conference at 14:30, and each brings orders in at once. We read the spikes as stops firing on both sides of thin quotes. On USD/JPY on 16 September 2026 the first minute went 15 pips under its open and closed 12 over it. Who was behind it, no chart can show.
Why did two pairs go opposite ways on the same Fed minute?
Because the dollar sits on opposite sides of the two quotes. AUD/USD falls when the dollar rises and USD/JPY rises. On 16 September 2026 AUD/USD made its high and USD/JPY its low in the same minute. We read that as one move of the dollar and not as two separate turns, which is why it is not two confirmations.
What is a stop hunt on FOMC?
It is price running through the stops past an obvious level on a Fed minute and closing back. USD/JPY's 14:00 candle on 16 September 2026 went 6 pips under the Asian range and closed near its high. It happens less than the name suggests: on our count the decision candle held the day's high or low on 5 of 32 market-days, all on that one day.
Is there an FOMC forex strategy that works?
We cannot name one. Guides offer positioning before the decision, trading the first move or waiting for the press conference. We have not tested those on Fed days alone, and our own fixed rule of fading hunts on high-impact releases lost money after costs. A move seen afterwards is not a setup.