CPI Stop Hunt: What EUR/USD Did at 8:30 on 11 September 2026
Dylan Forexia9 min read
A CPI stop hunt is price running through the stops past an obvious level on the minute US inflation data lands, then closing back past it. On EUR/USD on Friday 11 September 2026 the 08:30 candle went 21 pips under London's low, spent ten minutes closing under it, and finished 4 pips back above it. Below is that morning, minute by minute, and a CPI morning that took nothing.
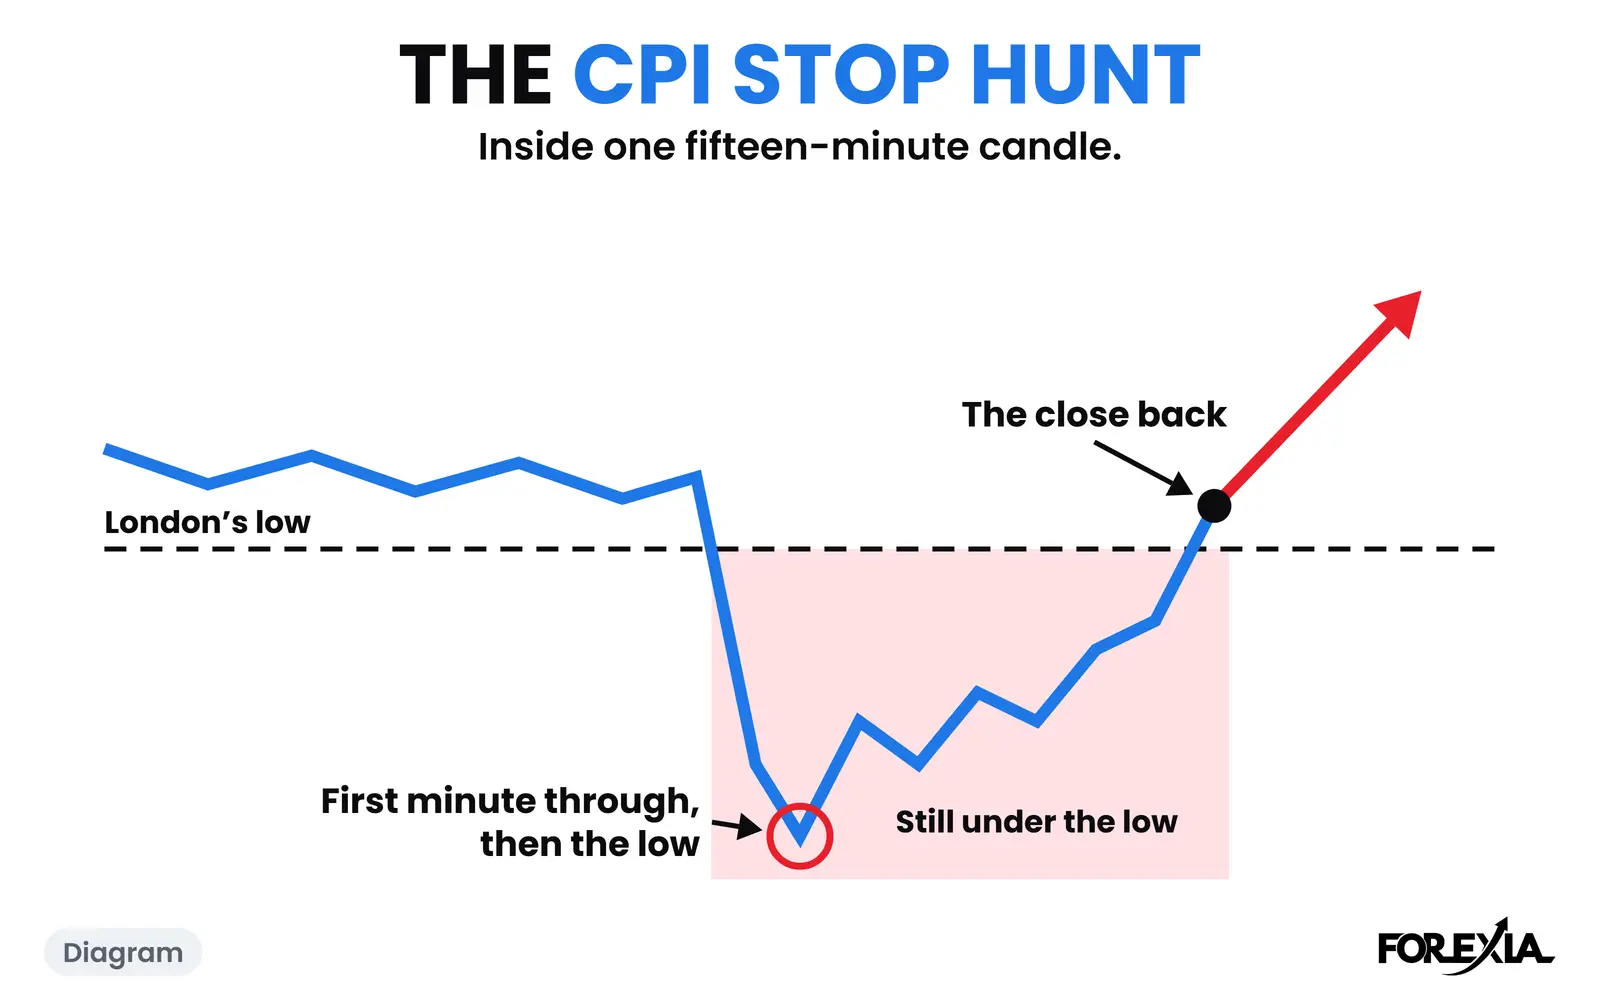
CPI is the US Consumer Price Index, out at 08:30 New York around the middle of the month. The stop hunt is our word for what most traders call a liquidity sweep. The read that applies News-Induced Liquidity to this release is On CPI, and that page walks the morning's levels. This page goes inside the candle. All times are New York, and a candle is named by the time it opens.
How does CPI affect the forex market?
The textbook says it runs through the dollar. A number hotter than forecast means rates stay higher, so the dollar rises and EUR/USD falls. A cooler one does the reverse. Traders watch the gap against the forecast and the core figure as much as the headline, and spreads widen around the minute. What CPI means in forex explains the number.
That rule is about the number, and we have not tested it. We do not quote the print here, because the read does not use it. The question on this page is narrower: what did the candle do to the levels the morning had left?
The CPI stop hunt on EUR/USD, 11 September 2026
By 08:30 the morning had built a map. Thursday's low was 1.15921. The Asian Box was 18 pips, 1.15997 to 1.16174. London sold down through it and through Thursday's low, reaching 1.15899 on the 06:45 candle, 10 pips under the box. That is the breakdown the crowd sells. We read two kinds of order under that low: the stops of anyone who bought it, and the sells of anyone waiting for a break. Then five small candles sat just above it, until the 08:15 candle closed at 1.15961.
Here is the release, from one-minute candles on the same feed. London's low of 1.15899 is the line to watch.
| Minute | High | Low | Close | Against London's low of 1.15899 |
|---|---|---|---|---|
| 08:30 | 1.15970 | 1.15723 | 1.15749 | Through it by 18 pips |
| 08:31 | 1.15783 | 1.15693 | 1.15755 | The low of the day, 21 pips through |
| 08:32 | 1.15823 | 1.15731 | 1.15801 | Closes 10 pips under |
| 08:35 | 1.15857 | 1.15813 | 1.15846 | Closes 5 pips under |
| 08:39 | 1.15883 | 1.15846 | 1.15864 | Tenth close under in a row |
| 08:40 | 1.15924 | 1.15849 | 1.15913 | First trade and first close back above |
| 08:43 | 1.15932 | 1.15900 | 1.15927 | First close back above Thursday's low too |
| 08:44 | 1.15944 | 1.15904 | 1.15943 | The 15-minute candle closes here |
Three things stand out that a 15-minute chart hides.
The low came in the second minute, not the first. Whoever sold the first minute's close at 1.15749 saw 6 more pips of profit and then a slow climb against them.
For ten minutes this was a real break by any measure on the screen. Every minute from 08:30 to 08:39 closed under London's low. A trader on a one-minute chart had no reason to call it a hunt.
And two levels closed back at different times. Price closed over London's low at 08:40 but did not close over Thursday's low until 08:43. Only the 15-minute close at 1.15943 sat clearly above both, 4 pips and 2 pips. That candle is the Close Back, on the release candle itself.
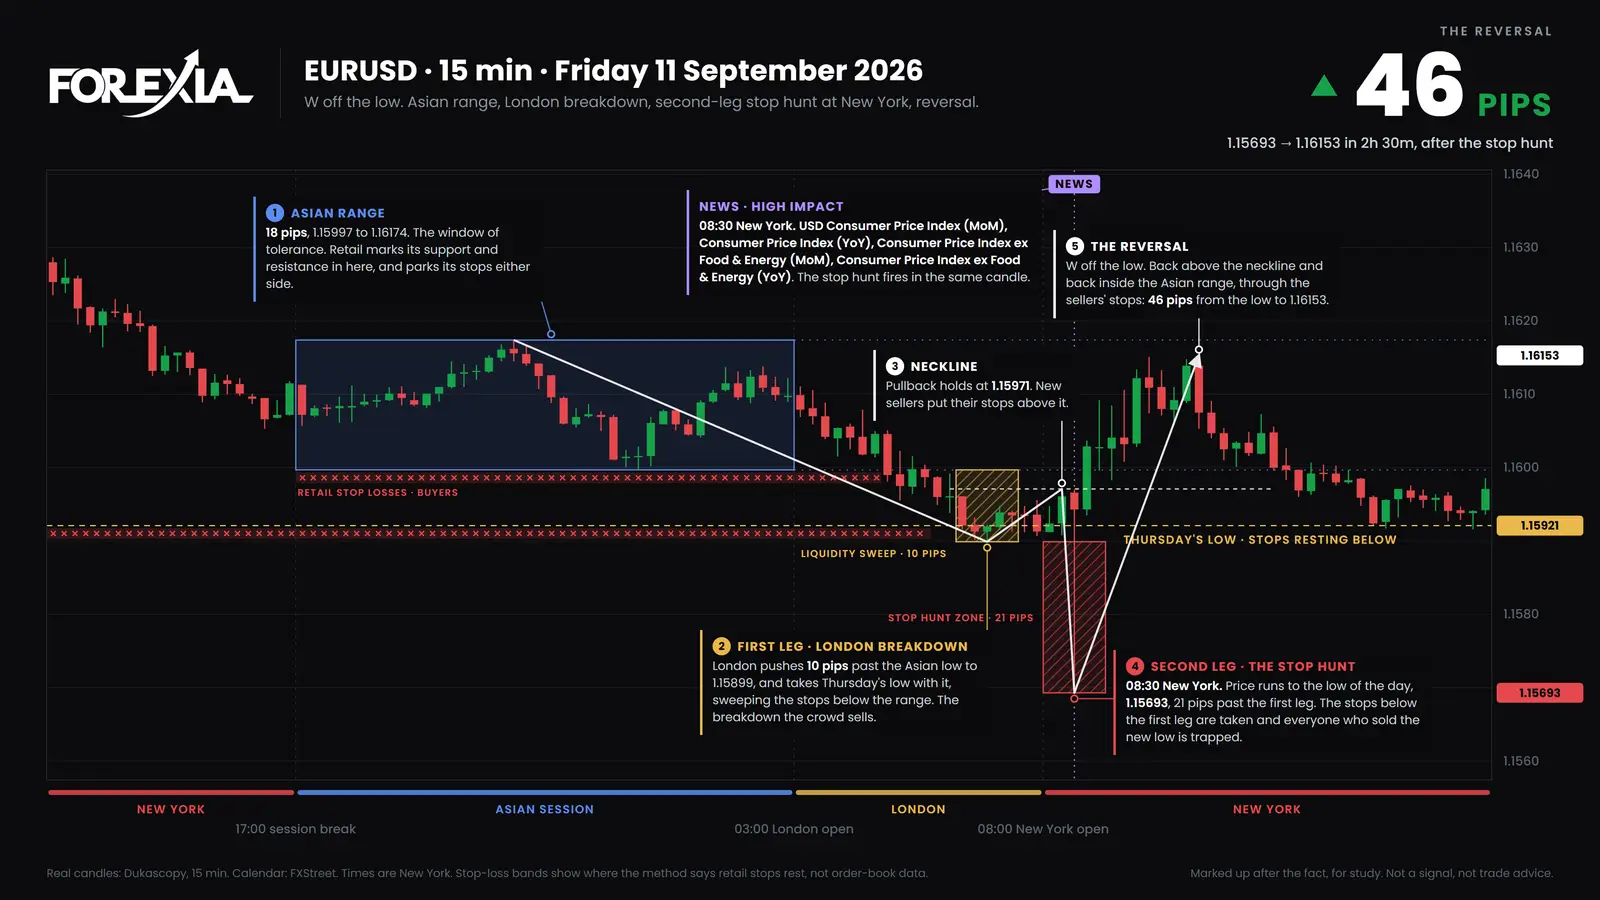
The next candle closed back inside the box at 1.16029, and for two hours every close stayed in it. The 11:00 candle's high of 1.16153 was 46 pips off the low. It was a high, not a close: that candle closed at 1.16075. Our calendar also has the University of Michigan survey and the ECB's president at 10:00, so not all of this is the CPI number. By 14:45 price was back at 1.15917, and the day ended at 1.15971. The low held, the bounce did not last, and a stop hunt promises nothing past the next few hours.
The same candle held the low on three other markets that morning: GBP/USD, AUD/USD and gold. USD/JPY's 08:30 candle ran 57 pips over its open and 31 under it, 87 in all, and held nothing. It was one release and one dollar, with very different shapes, so these are not four confirmations.
A faster one: USD/JPY, 14 July 2026
The depth and the time are both different on our second CPI morning, and the order is the same. The box was 24 pips, 162.228 to 162.468. Monday's low sat far under it at 161.645. At 04:30 London ran 18 pips under the box to 162.052 and closed at 162.209, and New York opened under the box too.
The CPI candle opened at 162.133. Its first minute fell to 161.601, 4 pips through Monday's low and the low of the day, and closed at 161.664, already 2 pips back above that low. So where the euro took ten minutes, the yen took one. The 15-minute candle closed at 161.732, 9 pips above Monday's low.
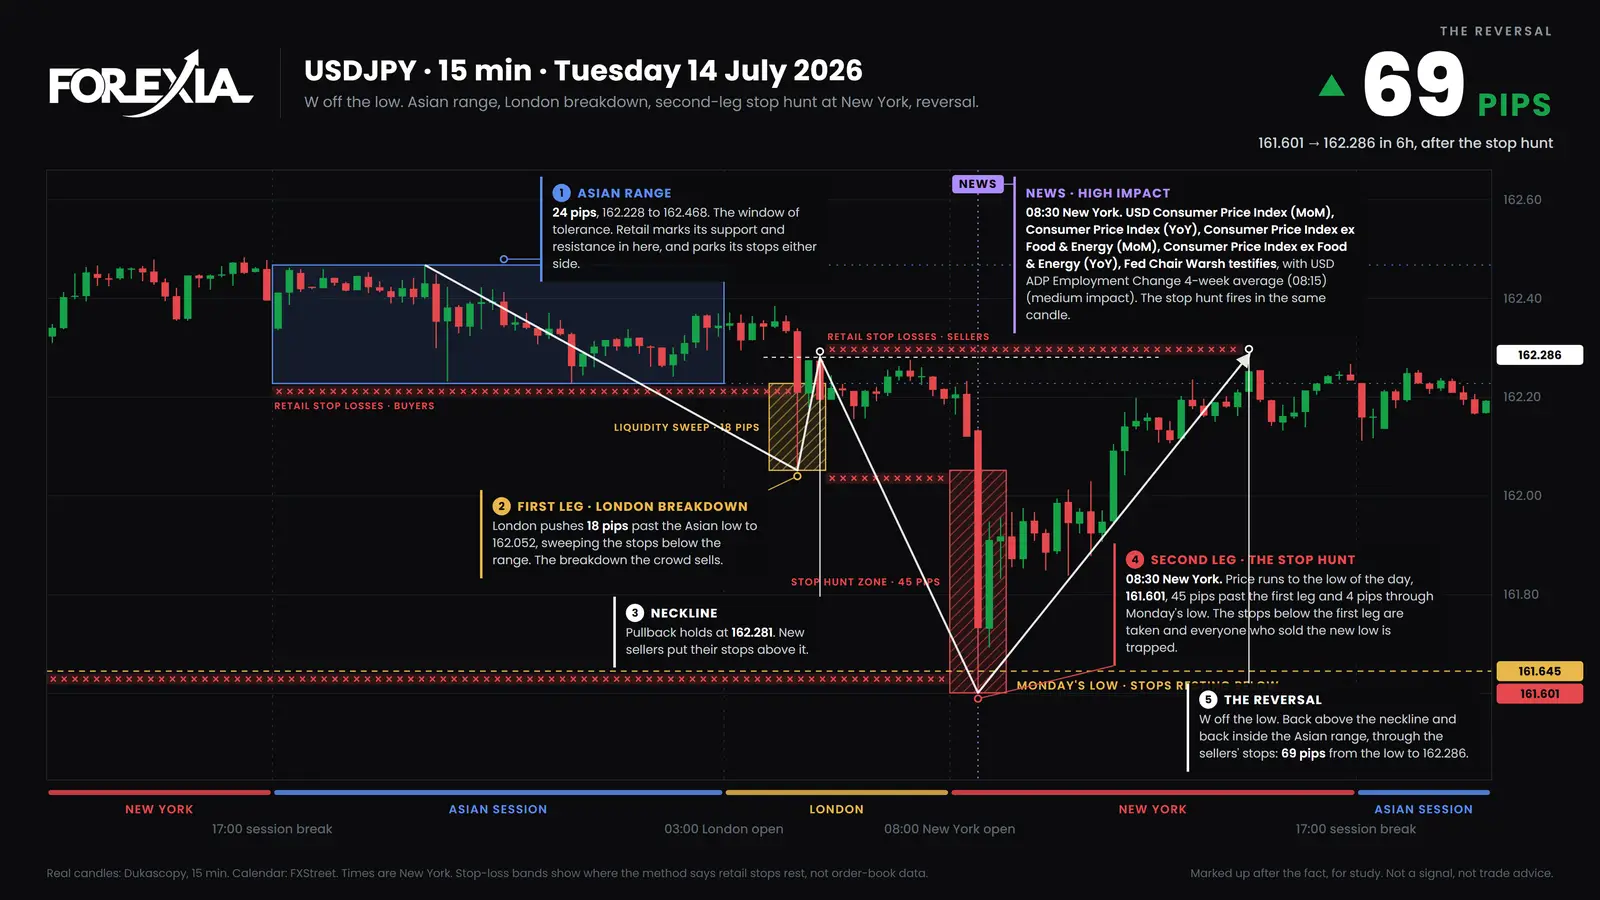
The way back took all day. The 14:30 candle reached 162.286, 69 pips off the low, and its close at 162.253 was the first back inside the box, more than six hours after the release. Our calendar has the Fed chair testifying from 08:30 and again at 10:00, and the ECB's president at 09:00, so this morning had more than one voice in it.
On both mornings the minute ran a previous day's low, and the release candle closed back above it. Two days is no pattern. It is what the shape looks like.
A CPI morning with no stop hunt: EUR/USD, 12 May 2026
Most write-ups skip this kind of day, and it is a real answer to "what will CPI do". Same pair, same release, four months earlier. The box was 38 pips, 1.17497 to 1.17876. London had already fallen through it and through Monday's low of 1.17447, reaching 1.17348 on the 07:00 candle.
The 08:30 candle opened at 1.17404, ran from 1.17357 to 1.17474, and closed at 1.17471. That is 12 pips, and it stayed inside London's range. It took no level at all. The low of the day came nearly three hours later, on the 11:15 candle at 1.17216, 13 pips under London's low, with nothing high-impact for either currency on our calendar near it.
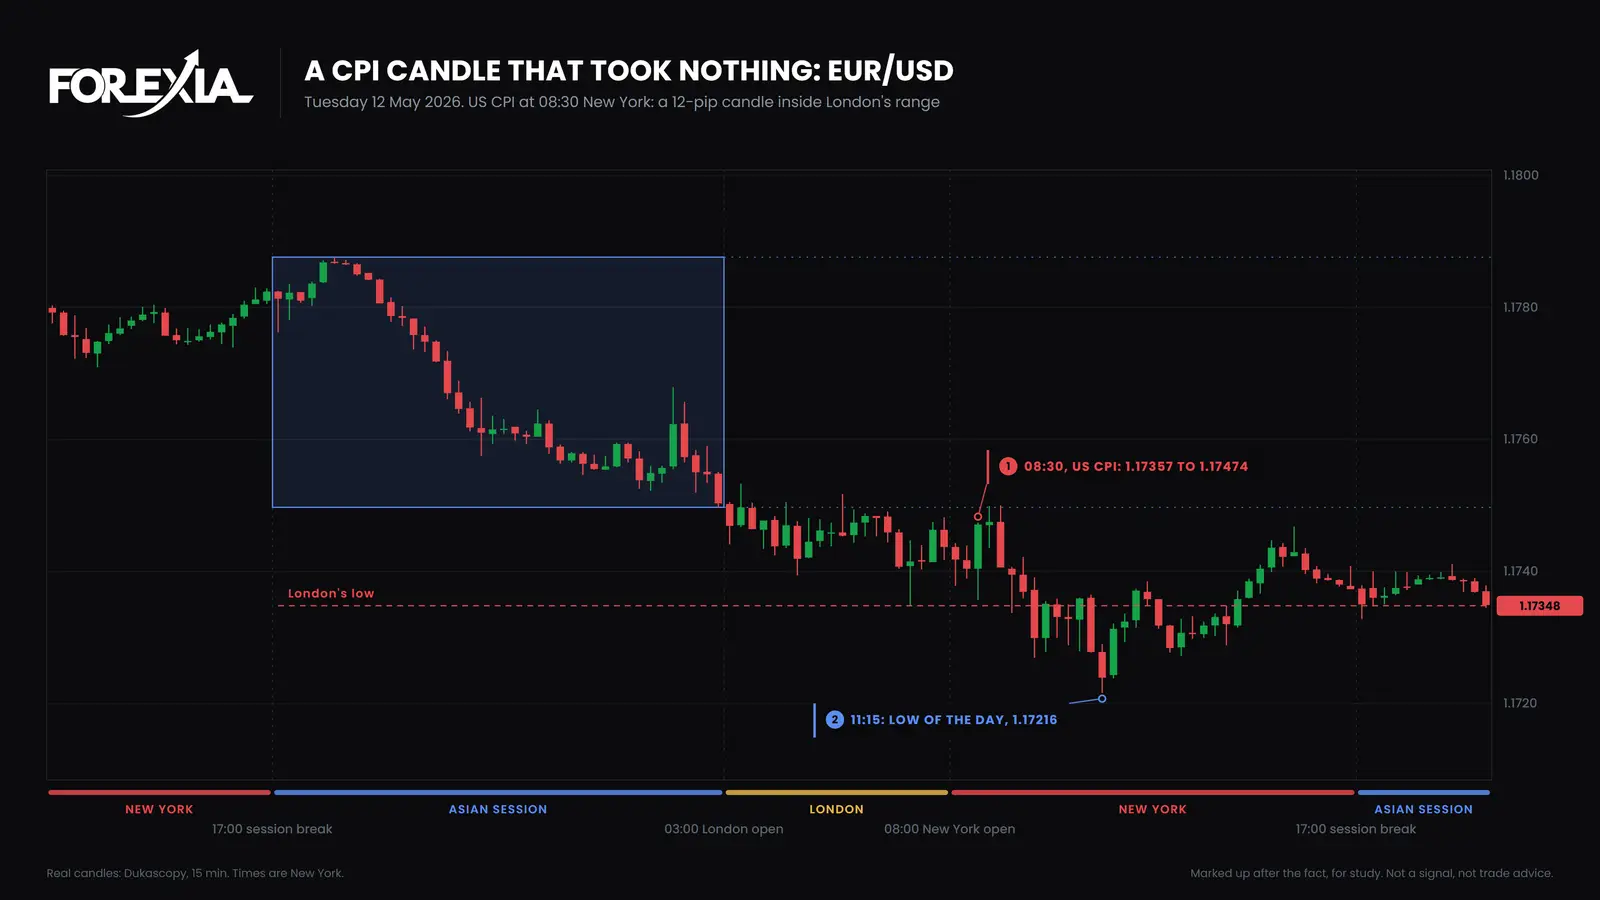
The minute was on the calendar, and the orders did not come, or we could not see them. On that morning the 08:30 candle held an end of the day on none of our eight markets.
We counted the six CPI reports on our calendar from 10 April to 11 September 2026, on seven majors and gold, 48 market-days of 15-minute candles. A candle holds when its high is the day's high or its low the day's low, session break to session break. It held on 12 of the 48, 5 highs and 7 lows, and on no market at all on two of the six mornings. Six reports is few, on one feed, with eight markets moving on one dollar. It counts candles, not trades. On CPI has the count by report, and the news trading guide sets it beside the other releases.
What did each seat see on 11 September?
The Three Seats split the morning.
- Retail sold the first minute, because a drop of 18 pips through a marked low looks like the answer. Its close at 1.15749 was 6 pips from the low of the day.
- The market maker, as we read it, had ten minutes under London's low to fill orders in, while every one-minute close still said break. Nobody outside can see those orders, and a thin market could print the same candle with no one aiming at it.
- The observer could not tell a hunt from a break at 08:35 either, and nobody could. What could be stated by 08:45 was the order: a close over London's low at 08:40, and over Thursday's at 08:43.
Common mistakes on a CPI morning
Five readings cost the crowd most on these mornings.
- Taking the 08:30 minute's close for the answer. At 1.15749 it was 15 pips under London's low. The same 15-minute candle finished only 2 pips under where it opened.
- Timing the turn. Ten one-minute closes stayed under London's low on the euro, and on USD/JPY the first minute was already back above Monday's low. The clock is no guide.
- Missing what the candle ran. On both days it went through a previous day's low: Thursday's at 1.15921 on the euro, Monday's at 161.645 on the yen. Both were on the chart before London opened.
- Expecting a hunt on every print. EUR/USD on 12 May took nothing.
- Expecting the 46 pips to last. The 11:00 candle closed 8 pips under its high, and by 14:45 price had traded 1.15917.
As a CPI forex strategy none of this is a plan, and how to trade CPI takes the plans people use. These mornings were picked afterwards. A reversal seen afterwards is not a setup, and our own fixed rule of fading hunts on a high-impact release lost money after costs, as the stop hunt guide sets out. More of the same week is in the markups of 7 September 2026, and why price spikes, then reverses, after news takes the wider question.
Course 2 of ForexiaPRO, The Chaos Pattern, teaches this read step by step in lesson 2.3.5, CPI Day, Minute by Minute.
Frequently asked questions
What is a CPI stop hunt?
It is price running through the stops past an obvious level on the minute US inflation data lands, then closing back past that level. On EUR/USD on 11 September 2026 the 08:30 candle went 21 pips under London's low and closed 4 pips back above it. Most traders call the same move a liquidity sweep. Who caused it, no chart can show.
How does CPI affect the forex market?
The textbook rule is that a hotter number than forecast lifts the dollar and pushes EUR/USD down, and a cooler one does the reverse. It is about the gap against the forecast, and it is widely taught. We have not tested it. On 11 September 2026 EUR/USD fell 27 pips from its open and then ended the candle 2 pips under that open, inside the same 15 minutes.
How long does a CPI stop hunt take?
There is no fixed time. On USD/JPY on 14 July 2026 the first minute went through Monday's low and closed back above it. On EUR/USD on 11 September 2026 ten minutes in a row closed under London's low. Two days is no sample, but until a candle closes back, a hunt and a real break look the same.
Does every CPI release have a stop hunt?
No. On EUR/USD on 12 May 2026 the CPI candle was 12 pips inside London's range and took no level. Of six CPI mornings from 10 April to 11 September 2026, the 08:30 candle held the day's high or low on no market at all on two, and on 12 of 48 market-days overall.