Why Does the London Breakout Fail? Watch It From the Crowd's Seat
Dylan Forexia8 min read
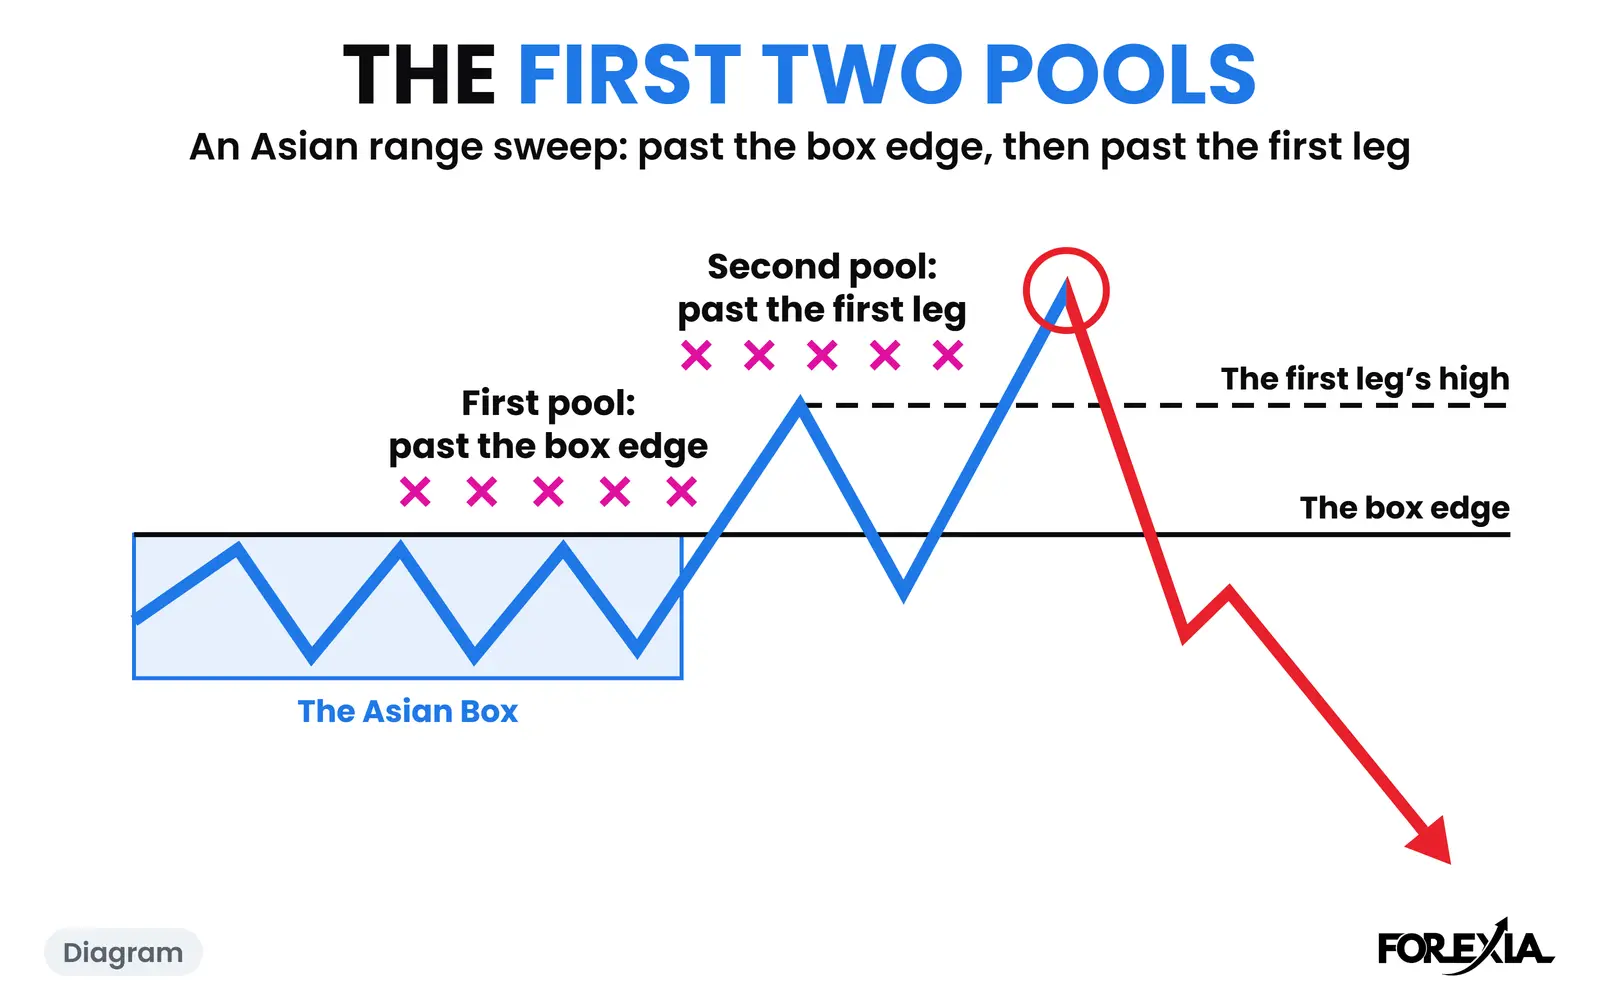
Why does the London breakout fail? Our reading is that the crowd enters together on a line everyone can see, with its stops in the same few places behind it, so its orders become a queue for anyone trading the other way. It does not always fail. On our count, the break stood all day on 194 of 745 days.
That is what happened on two real days below, and the third is the same pair on the day its break held. The London Breakout is our word for that first move out of the night's range, and this page watches it from the seat of the person buying it.
Why does the London breakout fail so often?
Because a break out of a quiet range brings together everything a large trader would want on the other side. We read five things working at once.
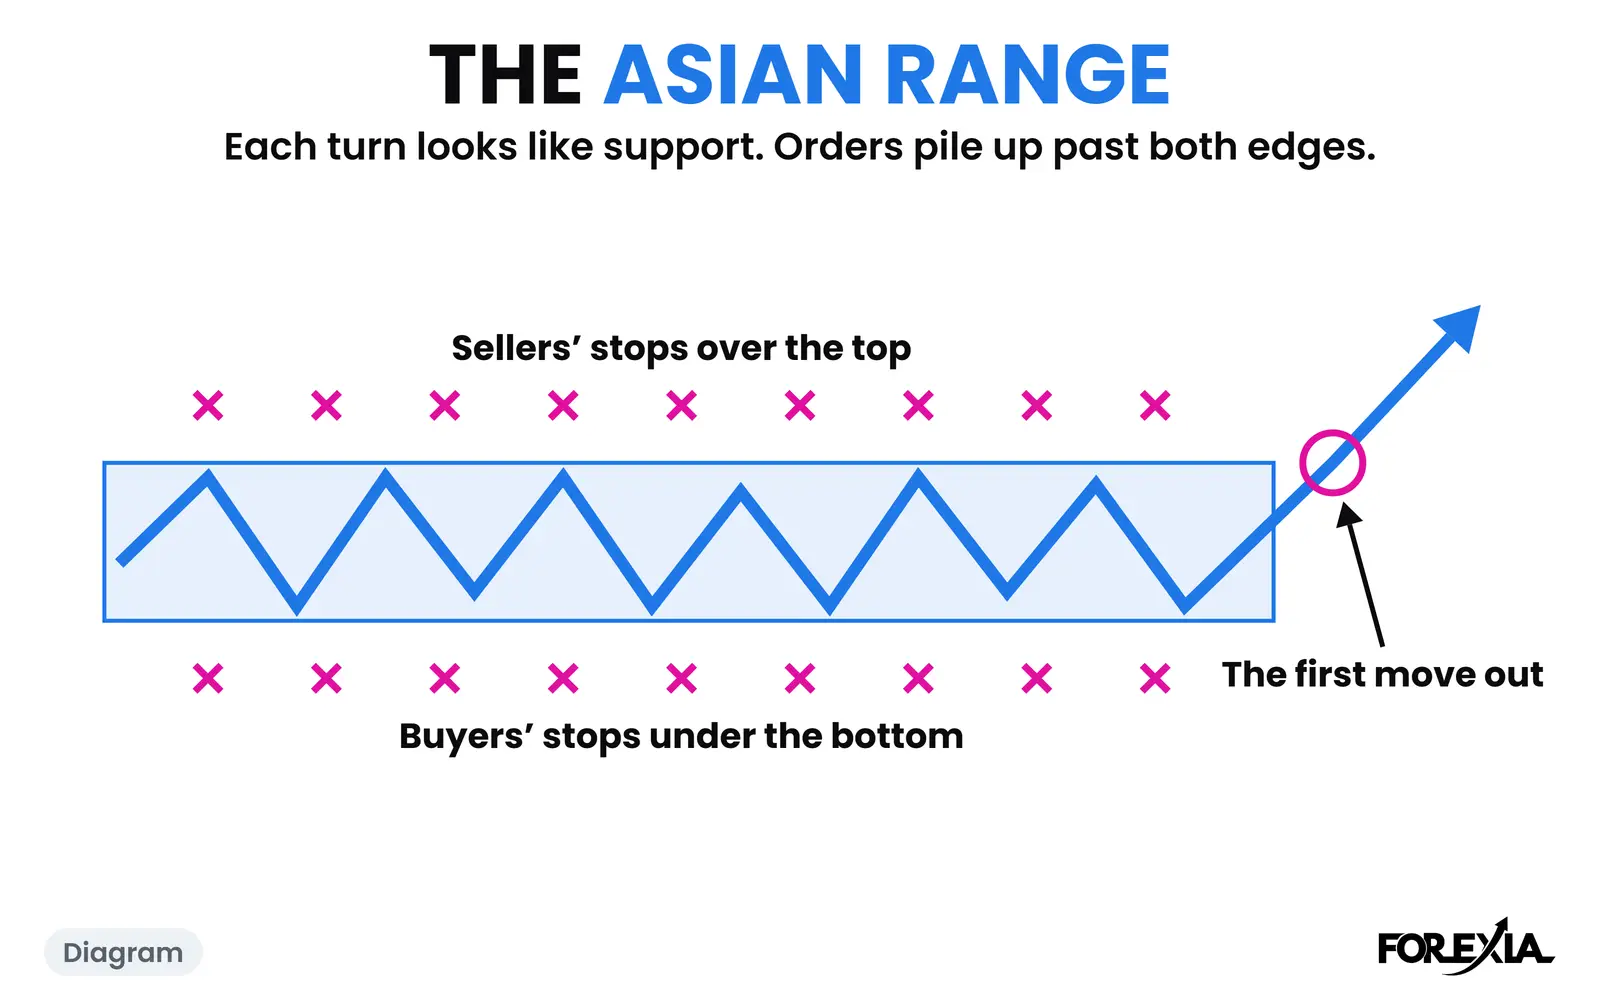
The line is public. Ten quiet hours draw the Asian Box, and everyone sees the same two edges.
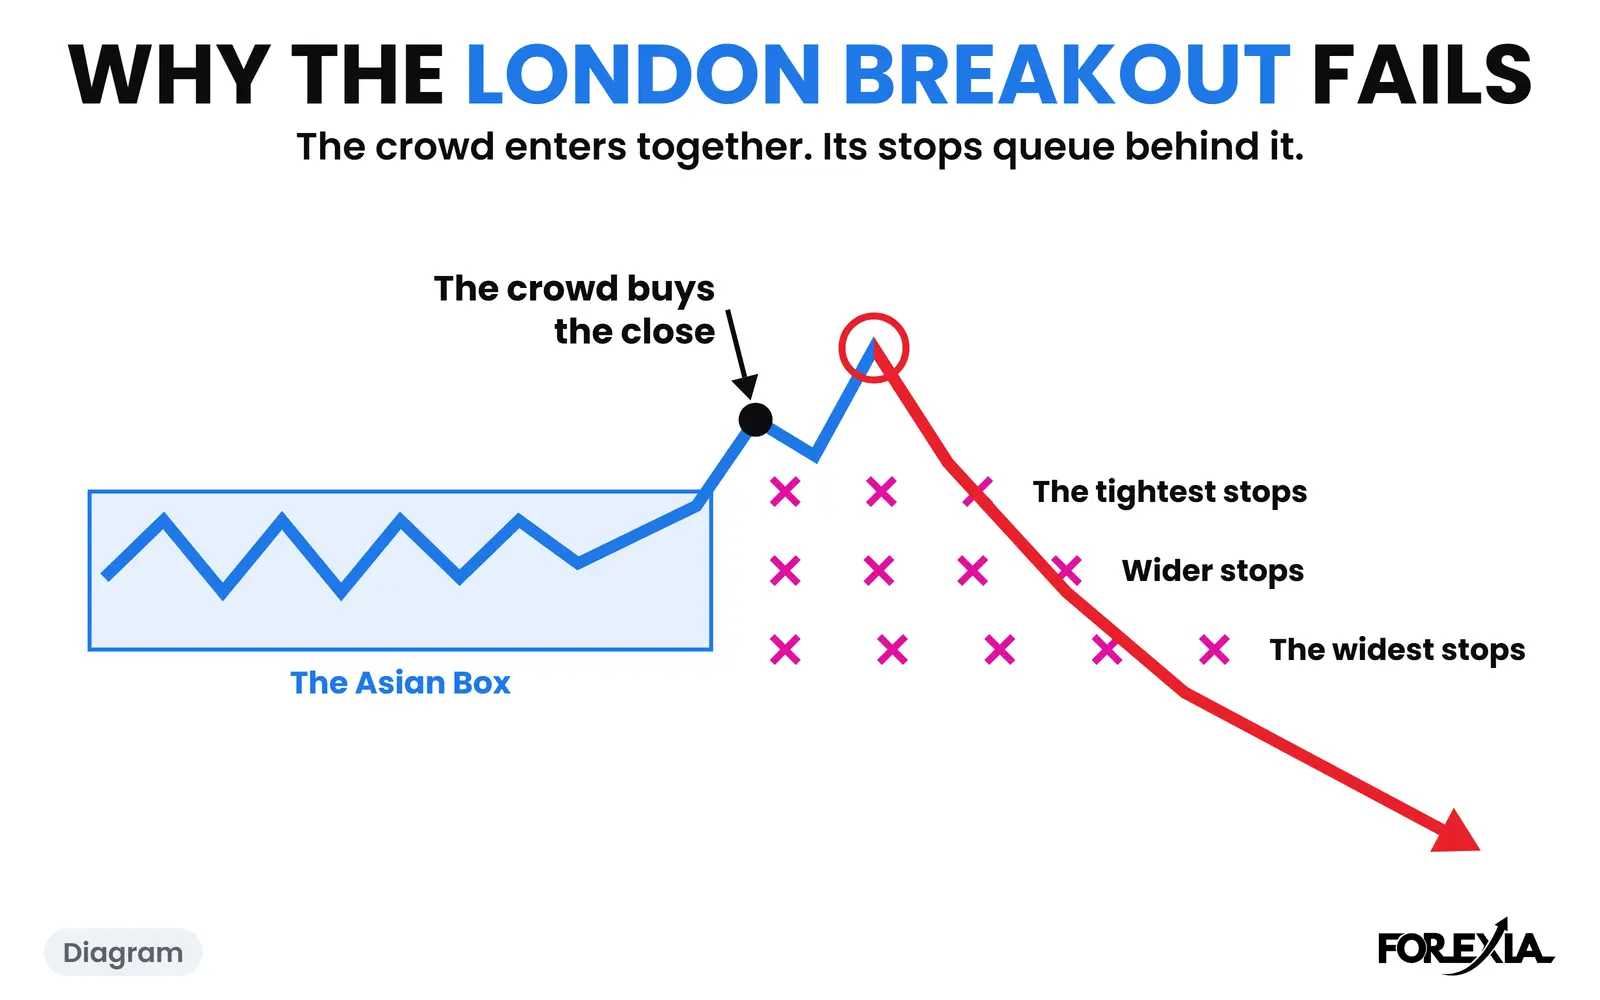
The crowd enters together. The book says buy the first candle that closes over the top. So those orders all arrive in the same few minutes.
Its stops sit in known places. The books put them behind the break, tight or wide, and the lines they measure from are on every chart. A stop is an order waiting to fire, so each one is a sell order at a price anyone can work out.
Confirmation arrives late. A few candles on, the 20 and 50 EMA cross the same way, and that looks like proof. The Trap has the detail. In our count of 1,132 crosses on seven majors and gold from 6 April to 1 October 2026, the median cross came with 63% of its move already done, and 444 had crossed back before that day's 17:00.
A shallow break has little behind it. Of 1,179 box edges that price traded past by at least 3% of the market's average day, 969 saw a close back inside that same day. Those went a median 9% of the average day past the edge. The 210 that never closed back went a median 64%. A break that fails tends to fail early, and most of them are shallow.
Guides list the same symptoms: false breaks, thin follow-through, news. What they rarely ask is who is on the other side of all those orders. We read that as a market maker, or anyone with size to place. To sell size you need buyers, and a break hands them to you. That is a reading, since nobody outside a broker's book can see the queue. Other things kill breaks as well, including plain bad timing.
What does a failed London breakout look like from the crowd's seat?
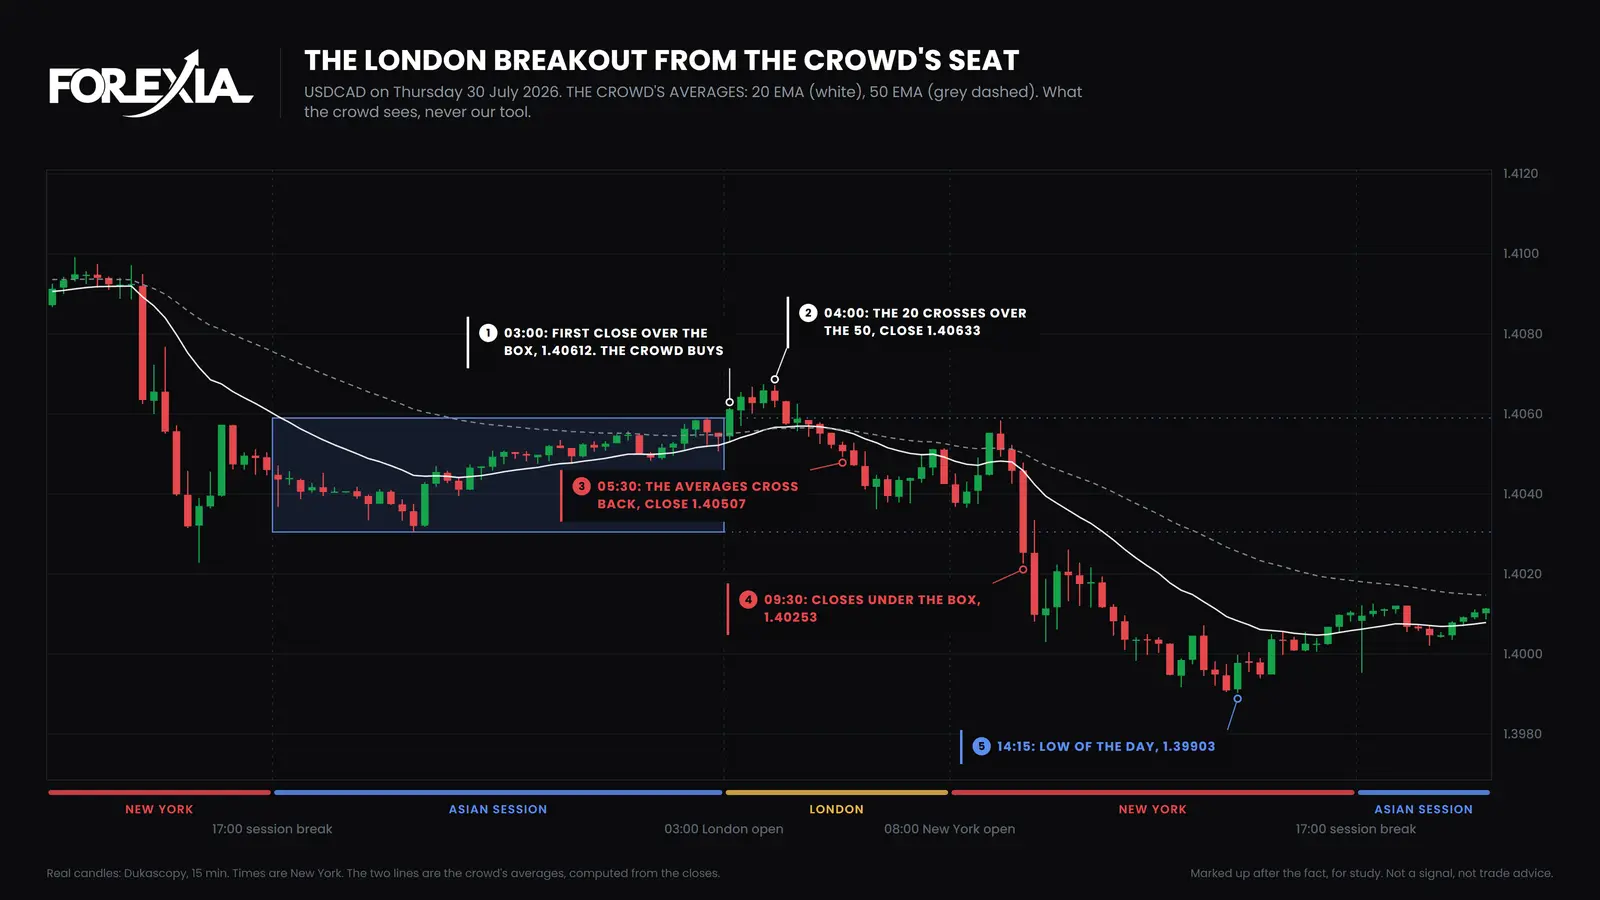
It looks right for about an hour. USD/CAD on Thursday 30 July 2026 spent the night in 29 pips, 1.40305 to 1.40590. On this page a candle is named by the New York time it opens, and the two lines on the chart are the averages the crowd is looking at, never our tool.
The 03:00 candle closed at 1.40612, 2 pips over the box. By the book, that is the buy. The high of the day came at 03:45, 1.40674, 8 pips over. On the next candle the 20 crossed over the 50, with a close of 1.40633. The screen said buy, and no later candle traded above the 03:45 high.
Now follow what the books' stops did that day, tightest first. One just under the top of the box, 1.40590, was gone on the very next candle: the 03:15 candle dipped to 1.40570 before the high had printed, and the 04:15 candle closed back inside at 1.40576. One under the 03:00 candle's low of 1.40529 went at 05:00, when price traded to 1.40525. One under the whole box, 1.40305, lasted until 09:30, after US growth and inflation figures at 08:30. That candle closed at 1.40253 and went through Wednesday's low of 1.40228 on the way.
At 05:30 the averages crossed back, with a close of 1.40507, 13 pips under where they had said buy. By 14:15 price was at 1.39903: 77 pips off the high and 40 under the box.
Does it always take that long?
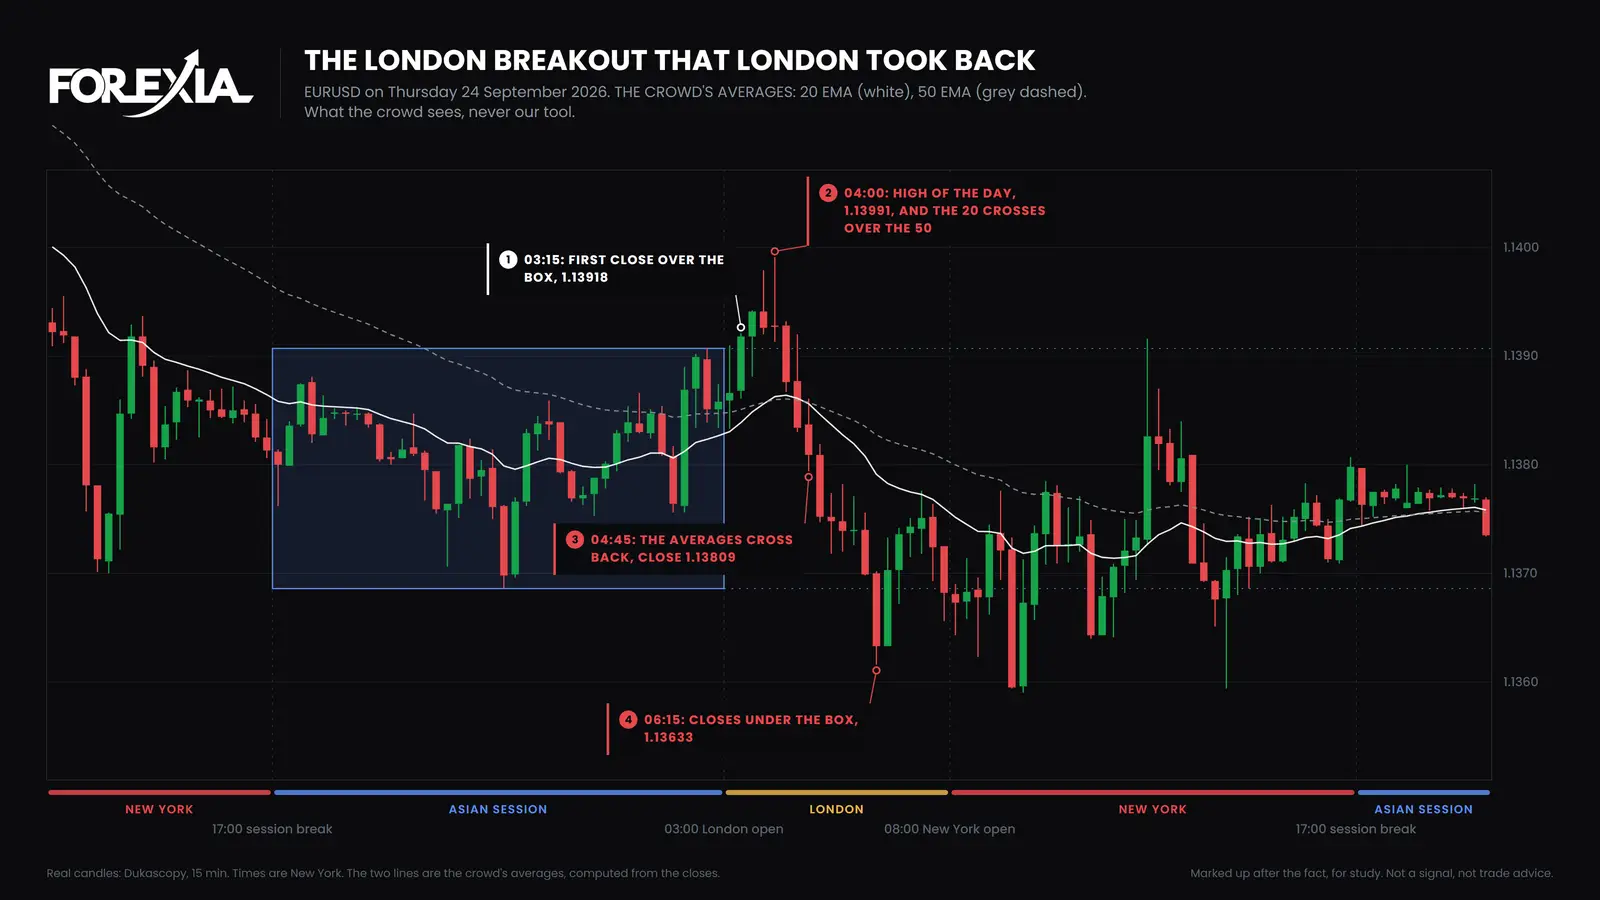
No. EUR/USD on Thursday 24 September 2026 did all of it before New York opened. The box ran 22 pips, 1.13686 to 1.13907, and the 03:15 candle closed a pip over it at 1.13918.
The 04:00 candle made the high of the day, 1.13991, 8 pips over the box, as Germany's business survey came out. The 20 crossed over the 50 on that same candle. The next candle closed back inside at 1.13876. The 04:30 candle traded under the breakout candle's low, and the 04:45 candle closed at 1.13809 with the averages crossing back, 45 minutes after they said buy.
At 06:15 a candle closed under the box at 1.13633, with a low of 1.13616, 38 pips off the high. Every stop the books teach had gone in London. New York added 3 pips, to 1.13590, and then the day did something else: by 12:15 price was back at 1.13916, 33 pips higher. So the box was traded past on both sides, and a seller who chased that low was caught as well.
When does the London breakout not fail?
On plenty of days, including the day before that one. EUR/USD on Wednesday 23 September 2026 ran a 27-pip night, 1.14224 to 1.14497. The 03:30 candle closed a tenth of a pip under the box, on European business surveys, and the 03:45 candle made it plain at 1.14179.
This is the same first close the crowd sells. No candle closed back inside the box for the rest of the day. The nearest price came was 1.14229 at 04:30, half a pip inside it. The low was 1.13700 at 13:15, 52 pips under the box. The crowd read that day correctly, by the book.
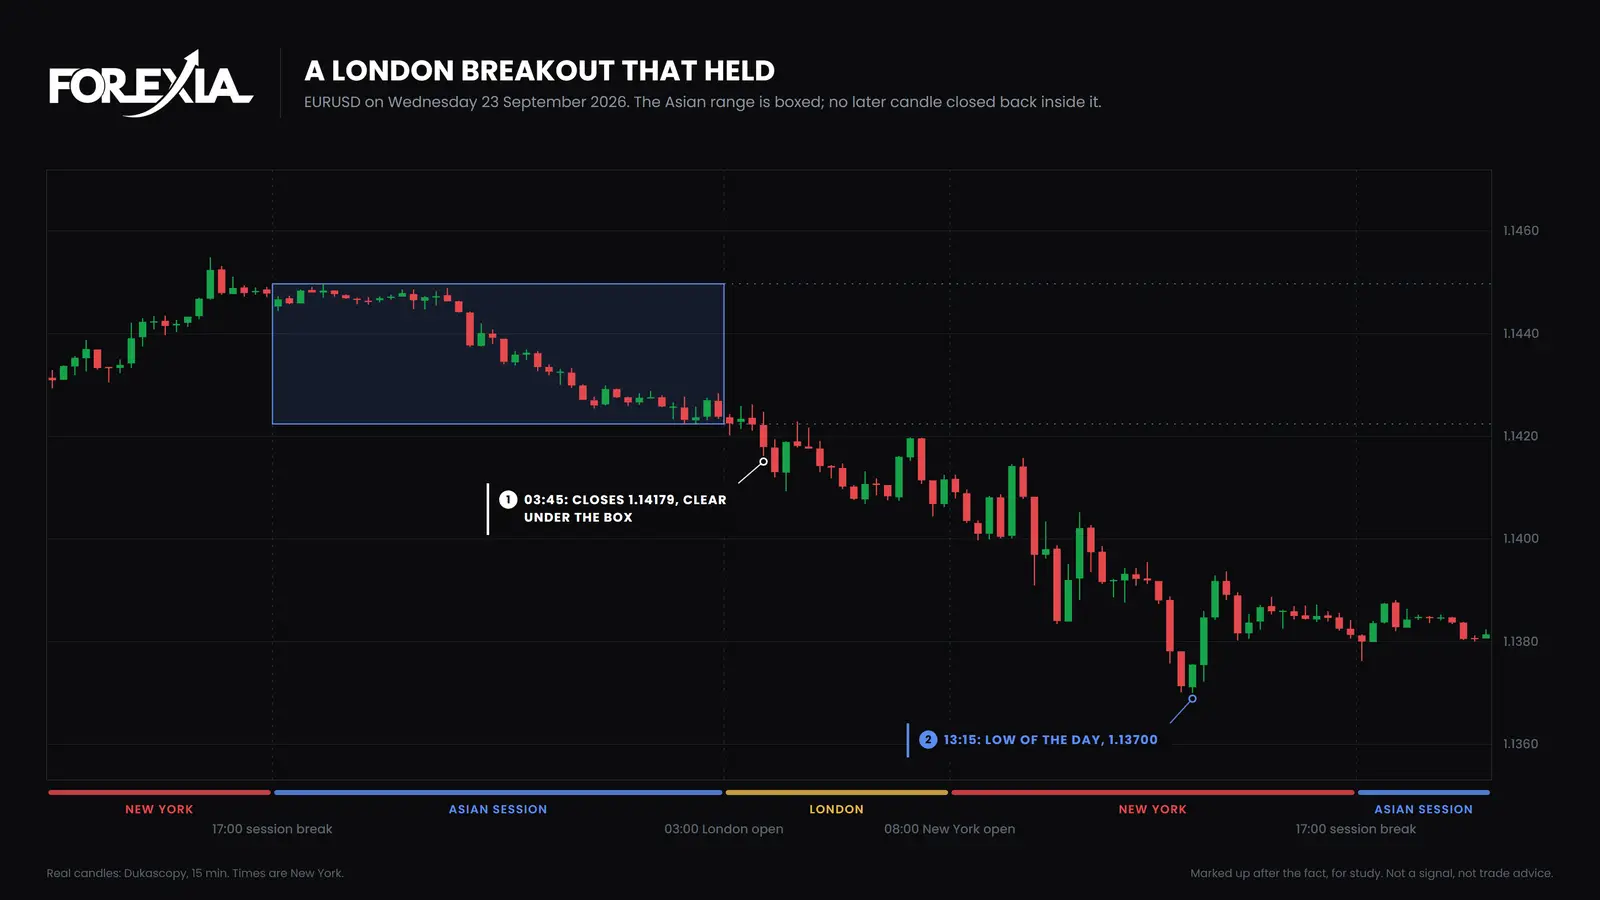
Two days, one pair, similar boxes. At the first close the two looked alike. Only what came after separated them, which is why a reversal seen afterwards is not a setup.
How often does a London breakout fail?
It depends how you define failing, so here is every outcome. We counted seven majors and gold on 15-minute closes, 1,030 market-days from 6 April to 1 October 2026, with the rollover wick left out of the box. A break is London's first close outside the box. It happened on 745 days. Of those 745 breaks:
| What happened next | Days | Share of the breaks |
|---|---|---|
| London undid it: its last close was inside the box or across it | 287 | 39% |
| It stood at New York's open, and a New York candle closed back inside | 264 | 35% |
| It stood at New York's open, and no New York candle closed back inside | 194 | 26% |
So the crowd's break lasted the day about one time in four. Count any close back the same day as a failure, and that is 551 of 745, the first two rows together. A close back is not the end of the story, either. In the separate count of box edges above, 620 of the 969 that closed back traded past the wick again later that day. These count candles and not trades, with no entry, stop or cost. They say nothing about what a strategy earned.
Should you trade the opposite way when it fails?
The count says that is not simple. Of the 287 breaks London undid, 103 closed through the box the other way by 17:00. Run as a mechanical rule, our own test of the setup did not make money. A failed break tells you where the crowd got caught, not what the next trade will do. Whether the London breakout strategy works at all gets its own page, and the first break of the Asian range another.
The day London undoes its own break is a London session reversal, and the morning's other case, the run past yesterday's high, is the London open stop hunt.
What did each seat see?
The Three Seats read the same 03:00 candle three ways.
- Retail saw a breakout and then a confirmation. The night's Asian range broke, and the averages agreed. That crowd is Dumb Money, which only means it did what the books say.
- The market maker, as we read it, saw a queue. Every breakout buy is a buyer to sell to, and every stop inside the box is a sell order at a visible price. Running through them is the Stop Hunt, most traders' liquidity sweep, and our stop hunt page goes further.
- The observer asked one question. If price comes back into the box, whose orders does it fill on the way?
Common mistakes
All three come from staying in the crowd's seat.
- Buying a close because it was first. On USD/CAD price went 6 pips further after it, then 77 the other way.
- Leaning on the averages at the top. On USD/CAD they crossed on the candle after the high, and on the euro on the high's own candle. On the euro they said buy and sell inside 45 minutes.
- Trusting a quiet night to protect a stop. On the euro, price had traded under the breakout candle by 04:30 and a candle had closed under the whole box by 06:15, with New York not yet open.
Course 2 of ForexiaPRO, The Chaos Pattern, teaches this read step by step in lesson 2.2.1, The London Breakout, From the Crowd's Seat.
Frequently asked questions
How often does the London breakout fail?
It depends what you call failing. Of 745 market-days when a London candle closed outside the Asian range, from 6 April to 1 October 2026, London had undone the break by New York's open on 287. New York closed back inside on 264 more, and the break stood all day on 194. That counts candles, not trades.
Should you trade against the London breakout instead?
Our evidence does not support that. Of the 287 days London undid its own break, 103 closed through the box the other way by 17:00 New York. Run as a mechanical rule, our own setup against the hunt did not make money. A failed break is not a trade by itself.
Is it true that 80% of breakouts fail?
We could not find a test behind that figure. It circulates in trading courses and posts as a rule of thumb, with no sample or definition of failing that we could find. Of 745 London breaks we counted, 551 were back inside the range or across it by a close the same day, and 103 of the 287 undone in London went on through the box the other way. Count your own pair by one written rule.
Do filters stop a London breakout failing?
Guides suggest several, such as a tight range or skipping news days. We have seen no published test of them with a stated sample. EUR/USD broke a similar-sized range on 23 and 24 September 2026, one day holding and the next not, and the first close looked alike on both.